 IST,
IST,


State of the Economy
|
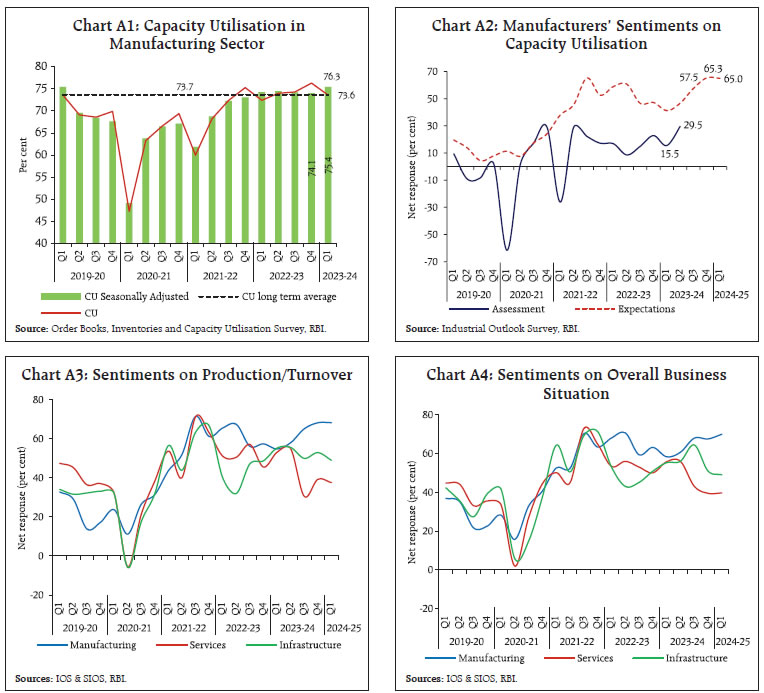
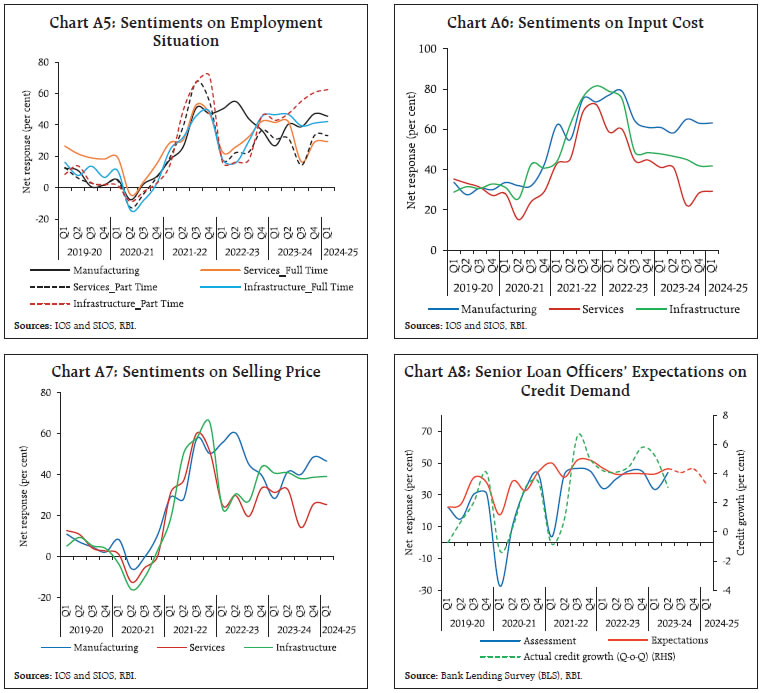
Global growth lost pace from Q3:2023 on the back of weak manufacturing activity and tight financial conditions in advanced economies even as several emerging market economies posted growth surprises. Surging yields and soaring crude oil prices have emerged as proximate risks to global growth. In India, a broad-based gaining of momentum is discernible in high frequency indicators. Deleveraging and higher capacity utilisation have enabled capital-heavy industries to gain traction. The Indian rupee (INR) is exhibiting low volatility. Inflation has moderated from its July peak, bolstering macroeconomic fundamentals. Introduction Global growth appears to have lost pace from the third quarter of 2023, after having quickened in the first half of the year relative to the preceding six months. Headline indicators suggest that labour market tightness in advanced economies (AEs) is easing, with weak wage growth adjusted for inflation dampening consumer spending and confidence. In this group of countries, manufacturing activity is either stagnating or contracting and services are moderating from a robust expansion. Europe’s biggest economies ended the third quarter in contraction, according to purchasing managers’ indices (PMIs). Globally, the modest easing of inflation from historical highs in 2022 has not been enough to recoup real income losses. Tight financial conditions engendered by higher-for-longer stances in monetary policy settings have punctured asset price inflation, with surging bond yields forcing equity markets into correction and sending up the US dollar from strength to strength. Fears are rife that these levels of real interest rates will prolong as neutral rates appear higher, triggering off retreats from risky assets, loan delinquencies, fall in house prices, impediments to rollovers and other such financial stresses. In some AEs, bank lending is beginning to show these strains. It is also reported that global deals involving mergers and acquisitions are languishing at a 10-year low as high interest rates chill activity in equity markets. This has adverse implications for the global foreign direct investment (FDI) cycle, already in a slump. By contrast, several emerging market economies (EMEs), especially in Asia and among the BRICS barring China, have posted positive growth surprises. Their PMIs are in expansion. These countries are standing up to formidable global headwinds that keep stampeding capital flows out of their equity and debt markets and imposing relentless downward pressure on their currencies. Nevertheless, growth profiles in this group are varied, reflecting country-specific circumstances. Ominously, however, the recent rally in crude prices is undermining the overall prospects of these economies. They also appear increasingly vulnerable to sell-offs and safe haven flights. The situation is compounded by rising food prices, a geopolitical fallout. Several EMEs – and even advanced peers - are tapping into foreign exchange reserves to help shore up their currencies or are engaging in open mouth interventions. The US dollar’s strength is now a global risk, tightening the already tight financial conditions even more. Even as energy importers reel under the impact of soaring crude oil prices that resurrect the spectre of inflation alongside external vulnerabilities, the US dollar gets ever stronger on the heft of surging treasury yields, creating a pernicious feedback loop. The more this toxic vortex persists, the greater is the pain for the world. Will the global economy be able to weather crude trading at current levels, especially with elevated energy prices turbocharging the US dollar? Monetary policy authorities facing these combined pressures may remain on guard for longer – in fact, even pauses are being accompanied by higher future rates guidance. Fiscal authorities in many countries may be forced to extend fossil fuel subsidies. Eventually, these forces can take down the global economy by weakening its main engines, notably the US and India. The end game could be to the detriment of all. Indeed, there is a view that an inflection point in the global monetary policy tightening cycle has already been reached, with signs of global activity slowing. Financial market traders too are sensing that this transition is being approached – they are pricing in no further rate increases by AEs and beginning of rate cuts by EMEs. Global trade has lagged global growth through the first half of 2023, with merchandise trade volume having contracted at its fastest annual pace since the pandemic and the tourism-fired rebound in services trade is showing some signs of softening. This downturn has been broad-based in the third quarter, with most of the world reporting falling trade volumes. Although the World Trade Organization (WTO) points to strong automobile production and sales containing the downturn, upward momentum in the third quarter and beyond may be limited as long as export orders, container shipping, air freight and raw materials demand remain weak. Global import demand remains anemic, weighed down by sluggish economic growth in leading economies, including the European Union (EU) and China. The United Nations Conference on Trade and Development (UNCTAD) forecasts global trade in goods and services to grow by barely 1 per cent through the year as whole, the slowest since the end of the World War II. The piling up of unresolved disputes at the WTO seems to bear this out as world trade fragments, geopolitical strife engulfs the earth from Ukraine to Israel and beyond, rendering the world trading order teetering on the abyss of irrelevance.1 In recent editions of the State of the Economy, we have been flagging climate risks. Europe announced its hottest September on record in 2023. At the UN Climate Ambition Summit on September 20, back-tracking on green policies was highlighted, even as countries brace up for COP 28 which will provide yet another opportunity to accelerate action to limit global warming. According to the International Energy Agency (IEA), meeting net zero goals will require tripling of renewable energy capacities to 11,000 giga watts by 2030, increasing annual investment in clean energy from US$ 1 trillion to US$ 4.5 trillion by the early 2030s and driving a large portion of these investments to emerging and developing countries.2 Fossil fuel use, if prolonged, needs to be accompanied by emissions-capturing technology. The main problem is the distribution of climate finance which is skewed towards those countries that have financial resources and infrastructure ready to ensure transition to low-carbon activity. By contrast, the global south faces a daunting disparity in the availability of climate finance, rendering their climate ambitions distant and making them increasingly vulnerable to natural disasters. It is clear that no country can address the impact of climate change by itself, but frayed international cooperation has been described as the ‘Achilles heel of reaching our global climate targets.’3 Global action for climate change also has to be isolated from geopolitical tensions. The pathway to net zero has to be equitable; this will necessarily involve differential timelines. It is the season of forecast revisions again. The OECD is among those presenting an upward revision, observing that India’s ‘growth surprise’ has been positive, with notable strength reflected in its PMIs, and fostering a steady outlook. According to it, India’s robust output growth has been supported by a strong expansion of investment and, on a sectoral level, the continued strength of services. The government’s infrastructure projects have supported momentum in the construction sector. Export growth in respect of services such as information technology and consulting has been strong and relatively unaffected by the slowdown in global growth. The Asian Development Bank has pointed out that strong private consumption and upticks in public and private investment are expected to brighten India’s outlook, although it foresees slight downward revision for 2023-24 due to erratic rainfall patterns. Our view is that they will all eventually gravitate to monetary policy committee’s (MPC’s) projection of 6.5 per cent real GDP growth for the year 2023-24. High frequency indicators discussed in subsequent sections show a broad-based gaining of momentum in August and September. The festival season is all set to light up volumes of e-commerce sales. Entry-level prices of electronics are poised to fall in spite of the focus on ‘premiumisation’. Consumer confidence is upbeat on online shopping, with wider choices, competitive pricing and the convenience of easy return and exchange lifting up the online shopping experience. In response, pan-India demand for warehousing has outgrown supply by an estimated 1.4 times4, with an average growth of 10 per cent in rentals. Rural consumers also appear to be ready to join the party: there is a revival in demand for fast moving consumer goods after the September showers in spite of an uptick in freight and packaging costs. With kharif sowing acreage exceeding last year’s coverage, joblessness in rural areas fell in September. Residential real estate markets across India’s cities are exhibiting a growth momentum that is scaling a six-year high, despite rising mortgage rates and property prices. The cloud to this silver lining is that there are bulk sales in the mid-income and premium segments while the affordable and low-cost segments are undergoing a decline in volume. Overall, the real estate industry is reflecting strong fundamentals. In the corporate sector, rating agencies are reporting credit ratios – upgrades by downgrades – of more than one. The upgrade rate5 has moderated but remains higher than the decadal average while the downgrade rate also undershot its 10-year average. Both investment- and non-investment grade companies recorded improvements in credit profiles. Infrastructure, automotive and cement companies that rely on local consumption harnessed robust cash flows to bolster balance sheets, pointing to a possible revival due in private capex. A secular improvement is underway for financials of rated companies, which is boosting credit ratios. Deleveraging and higher capacity utilisation has enabled capital-heavy industries to stage a broad-based improvement in performance and outlook. In the financial markets, the festival mood is lifting sentiments. In September, primary equity markets sizzled, with the most number of initial public offerings (IPOs) in the past 13 years amidst a buoyant rally in mid- and small-cap stocks. This has been propelled by ebullient inflows into several small and mid-cap funds. The India volatility index (VIX), an equity market fear gauge, has remained subdued during the first half of 2023-24, indicative of the bullish market sentiment. In the bond market, yields have shown a remarkable resilience and stability in the face of the rise in US yields, attributable to country-specific factors such as announcement of inclusion in the JP Morgan emerging market bond index, responsible government market borrowings indicative of underlying fiscal health, and prudent debt and liquidity management. Both passive and active funds are expected to flow into Indian debt markets, but they may bring with them associated volatility which will need to be carefully and nimbly managed. The Indian rupee (INR) has also exhibited low volatility and orderly movements relative to peers in spite of the elevated US treasury yields and a stronger US dollar. Movements in the INR are consistent with the strength of the underlying macro-fundamentals and the reassuring availability of buffers. Term deposit rates have surged to their highest levels in the past five years as banks rush to meet strong credit demand. There is anecdotal evidence that funds are flowing from low-yielding current account savings account (CASA) to higher-interest bearing term deposits. Competition among banks for garnering deposits has intensified after a long hiatus. The structural liquidity mismatch in the banking system is also reflected in the highest issuances of certificates of deposits (CDs) in September during the current financial year. Outflows on account of tax payments and increased demand for credit ahead of the festival season have also tightened access to liquidity. Renewed government spending and the release of the last tranche of the incremental cash reserve ratio (I-CRR) will likely ease liquidity but CD raising will likely continue into October. An important development that has spread cheer all around is the sharp correction in headline inflation in its September print from the recent spike in July and August. Vegetable prices may correct even more in October and expand disposable incomes of consumers. From the point of view of the conduct of monetary policy, the broad-based softening of core inflation has been a result of staying the straight and narrow course of excoriating inflation enduringly. The accumulated force of monetary policy actions and an unswerving disinflationary stance of withdrawing accommodation are yielding results in the form of dissipating the persistence of price pressures, aided by the receding of input costs. It is too early to declare victory though; there are many miles to go. Set against this backdrop, the remainder of the article is structured into four sections. Section II covers the rapidly evolving developments in the global economy. An assessment of domestic macroeconomic conditions is set out in Section III. Section IV encapsulates financial conditions in India, while the last Section sets out concluding remarks. Global growth remains weighed down by tight financial conditions, uncertainty about the monetary policy trajectory, high debt distress and geopolitical tensions which have been further accentuated by the Israel-Hamas conflict. Labour markets in major AEs continue to remain tight prompting central banks to maintain ‘higher for longer’ stance. The International Monetary Fund (IMF), in its October 2023 update of the World Economic Outlook (WEO), kept the global growth forecast unchanged at 3.0 per cent in 2023, same as in its July 2023 update. Growth in 2024 is, however, projected to moderate to 2.9 per cent (downward revision by 10 basis points from the July 2023 update) as a stronger-than-expected momentum6 in the US is likely to be more than offset by a weaker-than-expected growth in the euro area and China (Chart 1). Our model-based nowcast for global GDP points to a pick-up in global growth momentum in Q3:2023 (Chart 2). Geopolitical risks have risen with the escalation of the Russia-Ukraine conflict and the war in the Middle East (Chart 3a). Recent developments in the Middle East add to our concerns on the risks to global growth and stability. The global supply chain pressures index (GSCPI), has ticked up to a seven-month high of (-)0.7 in September 2023, although it remains below its historical average (Chart 3b). 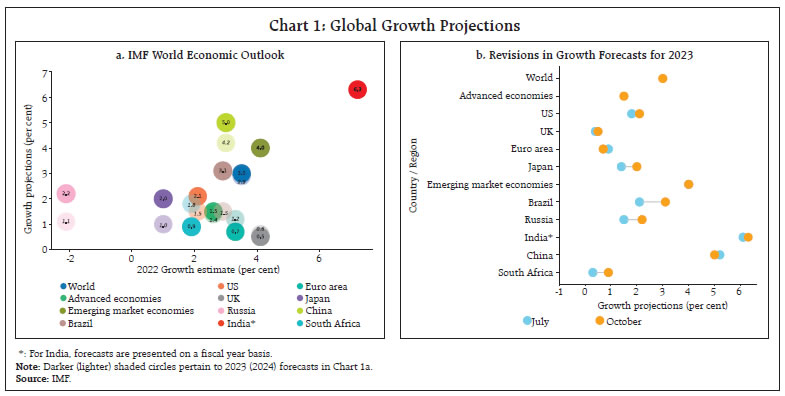 Consumer sentiment worsened across jurisdictions in September, indicative of a weak outlook for demand (Chart 4a). Economies such as the US, the EU and China witnessed further tightening of financial conditions (Chart 4b). 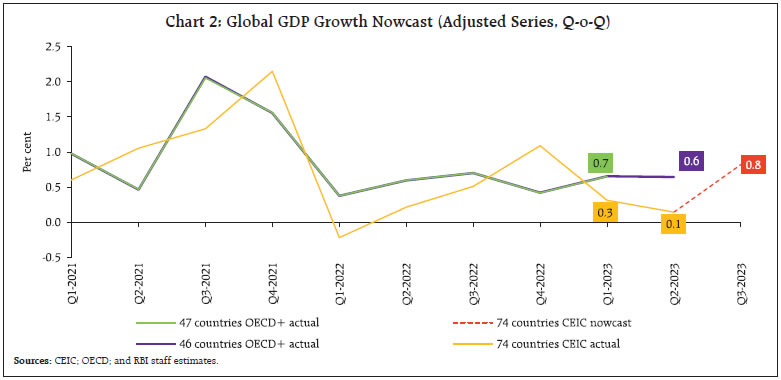 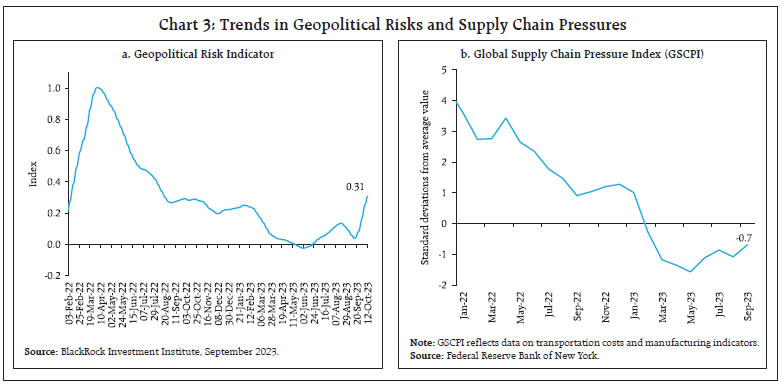 The global composite PMI declined to 50.5 in September from 50.6 in August - its lowest reading since January - as the services component moderated. Despite a marginal pick-up in September, manufacturing PMI remained in the contractionary zone for 13 months in a row, as output, new orders and employment contracted (Chart 5). Global trade continues to face significant headwinds. Export orders for manufacturing remained in contraction in September, albeit with a sequential improvement (Chart 6a). Export orders for services, moved into the contractionary zone after seven consecutive months of expansion. The World Trade Organization (WTO) downgraded the growth forecasts for world merchandise trade volume for 2023, while marginally upgrading the outlook for 2024, in its October 2023 edition of the Global Trade Outlook and Statistics (Chart 6b). 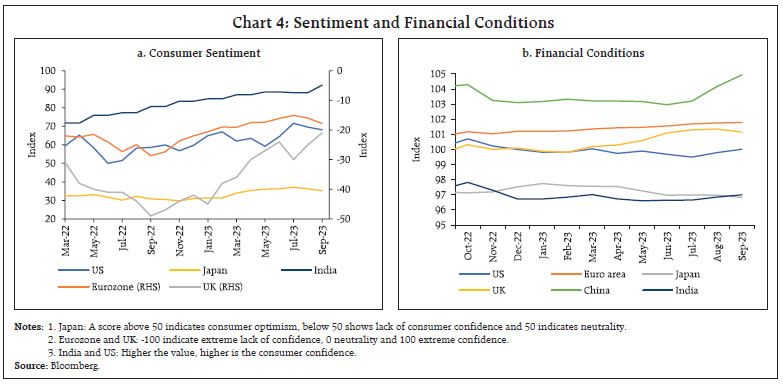 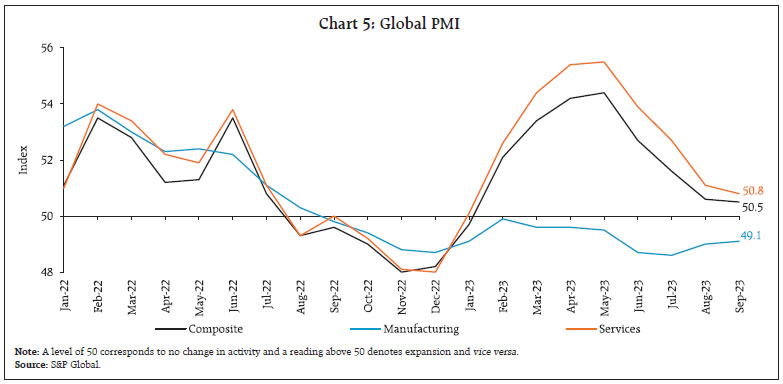 Global commodity prices hardened in September and the Bloomberg commodity price index increased by 1.2 per cent on a month-on-month (m-o-m) basis, driven by increases in energy prices. Supply cuts from OPEC+ and signals of further reductions drove crude oil prices higher, to average US$ 93.8 per barrel in September – a 25 per cent increase since June 2023 (Chart 7a). However, prices declined during the first week of October amidst continued fears of weaker demand stemming from the macroeconomic headwinds (Chart 7b). Crude futures indicate that prices are expected to remain at US$86 per barrel in April 2024 as weaker growth in China and the projected decline in the US retail fuel consumption are likely to subdue demand. Even supply prospects are expected to improve with non-OPEC suppliers such as Brazil and Guyana raising their output. However, the war between Israel and Hamas has added heightened uncertainty to the oil market. 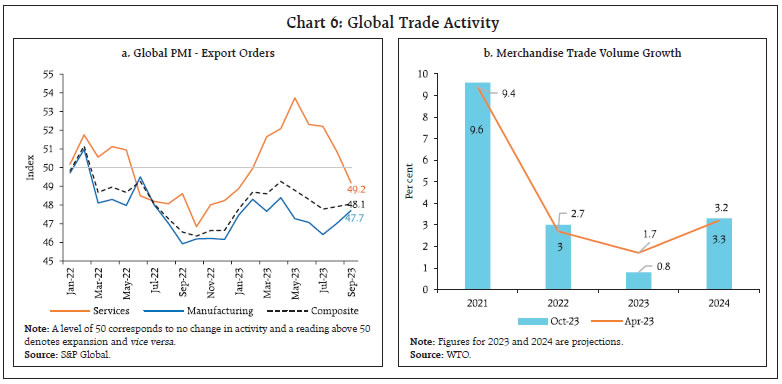 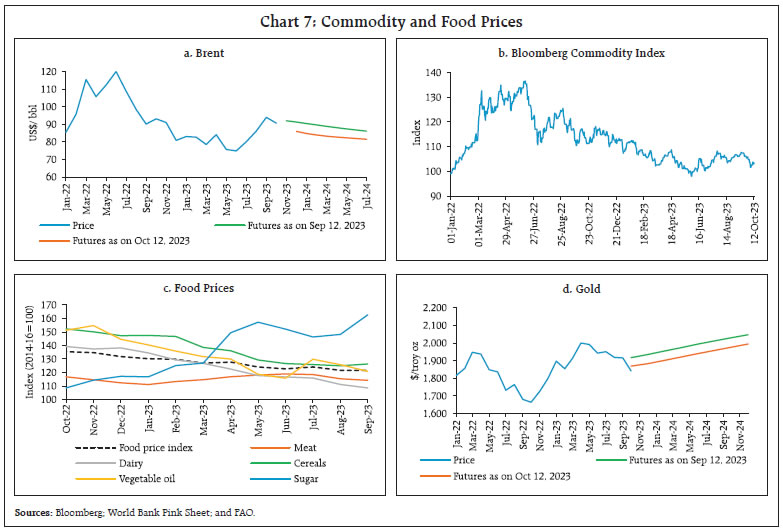 The Food and Agriculture Organization’s (FAO’s) food price index recorded a marginal decline of 0.1 per cent (m-o-m) in September as moderation in the prices of vegetable oils, dairy and meat were largely offset by increases in the prices of sugar and cereals (Chart 7c). Gold prices declined towards end-September and early October due to a stronger dollar and higher treasury yields but edged up thereafter reflecting safe-haven demand in the wake of renewed geopolitical tensions (Chart 7d). Headline inflation remains elevated across countries with renewed pressures in major economies including the US.7 The disinflationary process is slow and uneven, with core inflation8 remaining sticky. CPI inflation in the US remained steady at 3.7 per cent in September 2023, the same as in August. Euro area inflation moderated to 4.3 per cent in September from 5.2 per cent in August. CPI inflation eased marginally in the UK to 6.7 per cent in August, the lowest since February 2022, while Japan’s inflation (CPI excluding fresh food) remained steady at 3.1 per cent. Inflation based on the US personal consumption expenditure (PCE) index edged up to 3.5 per cent in August from 3.4 per cent in July (Chart 8a). Among emerging market economies (EMEs), inflation edged up further to a seven-month high in Brazil and Russia in September (Chart 8b). Core and services inflation ruled above headline inflation in some advanced economies (AEs) [Chart 8c and 8d]. 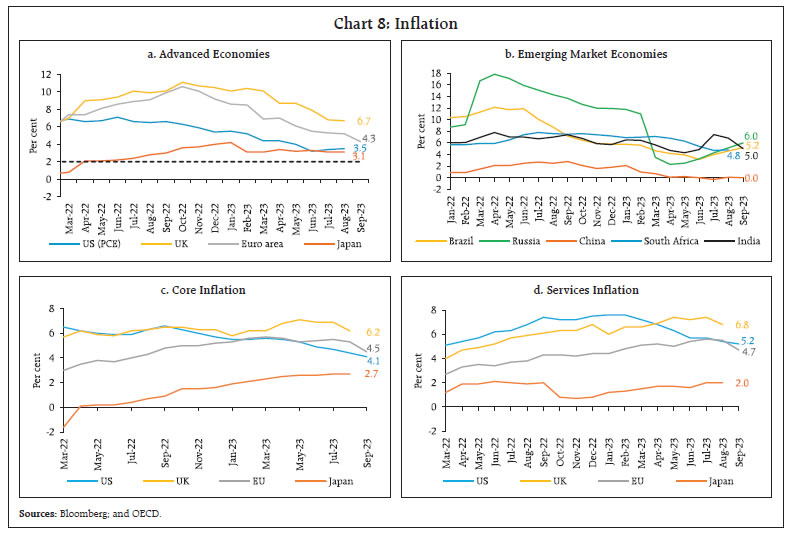 Global equity markets corrected in September and early October in anticipation of ‘higher for longer’ monetary policy stances, elevated energy prices and higher long-term borrowing costs along with weak recovery in China (Chart 9a). The US government bond yields hardened, reflecting the hawkish stance of the US monetary policy, their ongoing liquidity tightening and slow pace of disinflation. Notably, the US yield curve inversion has persisted since July 2022 (Chart 9b). At the long end, the 30-year US treasury yield crossed 5.0 per cent in early October for the first time since October 2007. Geopolitical developments in the Middle East have, however, triggered a predictable flight to safety with the US treasury yields softening and USD appreciating marginally. In the currency markets, the US dollar appreciated in September by 2.1 per cent (m-o-m) and it continued to rise further in October driven by safe haven asset demand amidst significant geopolitical uncertainties. Concomitantly, the Morgan Stanley Capital International (MSCI) currency index for EMEs declined by 0.3 per cent in September and 0.5 per cent in October (up to 12th) as capital outflows, primarily equity outflows continued (Chart 9c and 9d). 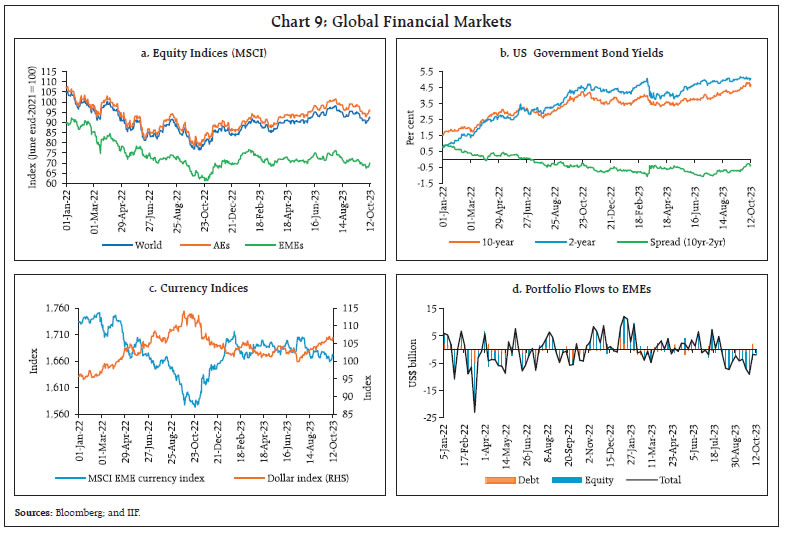 AE central banks in general opted for a pause while some continued with monetary tightening (Chart 10a). In their September policy meeting, the US Fed held the target range of the Federal Funds rate steady at 5.25-5.50 per cent. The United Kingdom, Canada and Australia also kept their policy rates unchanged in September. The European Central Bank (ECB), the Norges Bank (Norway) and Sveriges Riksbank (Sweden), however, raised their key rates by 25 bps each. Among EMEs, Brazil cut its benchmark interest rate by 50 bps while China kept its rates unchanged but reduced the reserve requirement ratio by 25 bps.9 In contrast, Turkey and Russia hiked their policy rate by 500 bps and 100 bps, respectively (Chart 10b). 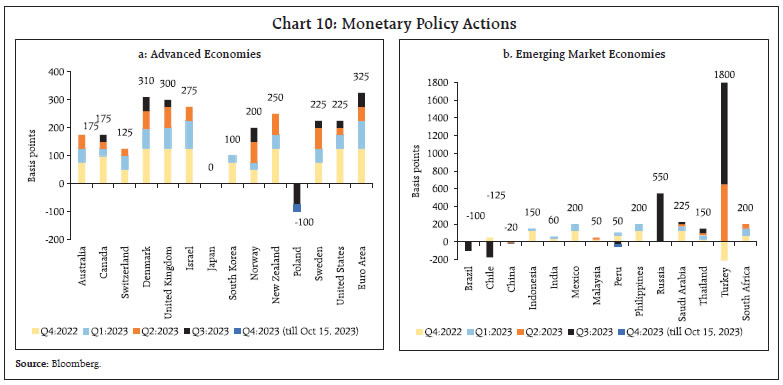 The World Bank’s latest India Development Update (IDU)10, reflects India’s resilience to global spillovers, even as pandemic-induced pent-up demand wanes. Supply chain pressures in India remain below historical average levels (Chart 11a). Consumer Confidence has improved with upticks in most of the macroeconomic conditions (Chart 11b). Overall credit ratio11 of ICRA assigned ratings was 2.0 in Apr-Aug 2023, indicating improved credit quality of India Inc. Rating upgrades were strong in the Hotels, Auto components, Financials and transport and infrastructure sectors Chart (11c). 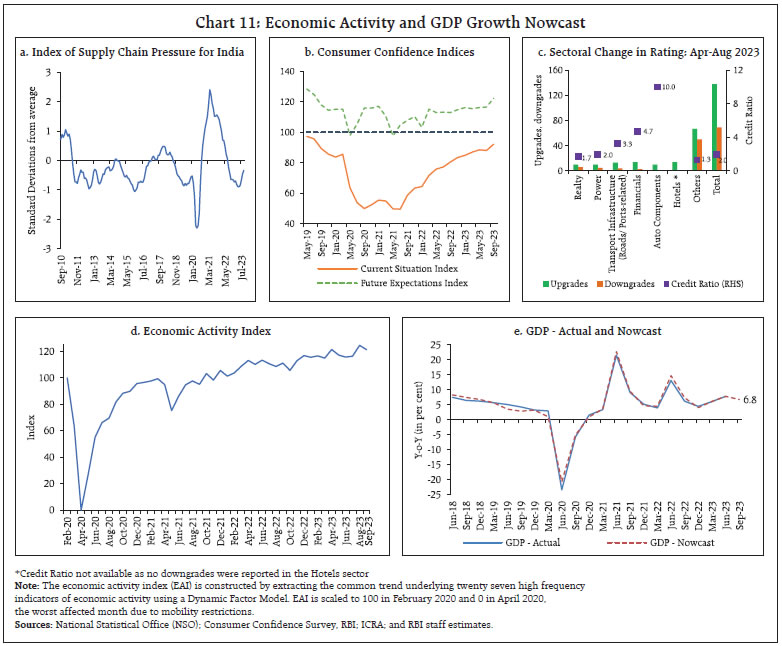 Our economic activity index (EAI) nowcasts GDP growth for Q2:2023-24 at 6.8 per cent (Chart 11d and 11e). Aggregate Demand Demand conditions are upbeat in Q3:2023-24. E-way bill volumes remained above 90 million units in September (Chart 12a). Toll collection expanded 20 per cent (y-o-y) in terms of value (Chart 12b). Automobile sales registered a y-o-y expansion of 4.4 per cent in September 2023 (Chart 13a), led by strong growth in the three wheeler segment. Sales of two wheelers, comprising of scooters and motor cycle also increased in September 2023 (Chart 13b). Domestic tractor sales improved to a three month high in September 2023 although it contracted y-o-y, on a high base of record sales in September 2022 (Chart 13b). Retail sales growth as reflected in vehicle registrations surged to an eleven-month high in September, buoyed by new launches and general festive cheer (Chart 13c). Growth in daily average consumption of petroleum products accelerated to 7.6 per cent y-o-y in September 2023 from 6.5 per cent a month ago (Chart 13d). As per Bizom, in September 2023, fast moving consumer good (FMCG) sales increased by 4.9 per cent y-o-y, despite the effects of erratic monsoon and food price spikes12 which impacted rural sales. The all-India unemployment rate (UR) declined to 7.1 per cent in September 2023 from 8.1 per cent in August, with decline recorded in both urban and rural areas. (Chart 14a). The labour force participation rate (LFPR) recorded a decline in urban areas while rural LFPR recorded a marginal increase. The employment rate (ER) reached its highest level since September 2020 (Chart 14b). The employment outlook in the organised sector, as polled by the PMI for manufacturing and services, remained in the expansionary zone, with the manufacturing employment expanding at the fastest pace in the last ten months (Chart 15). 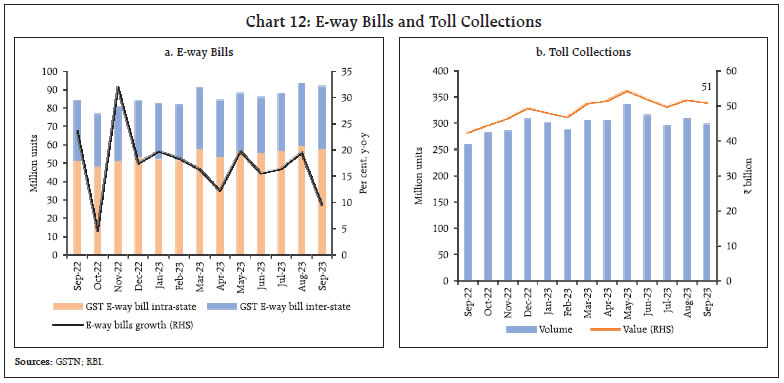 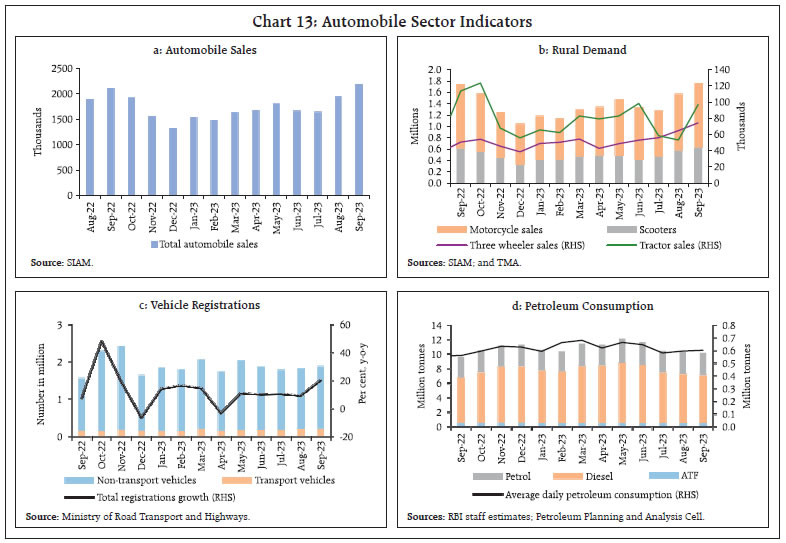 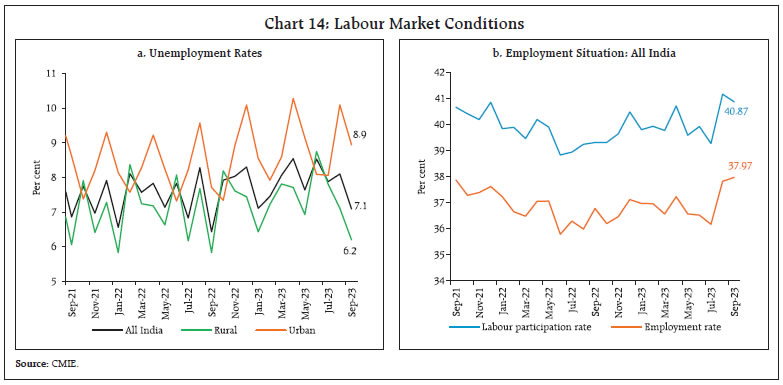 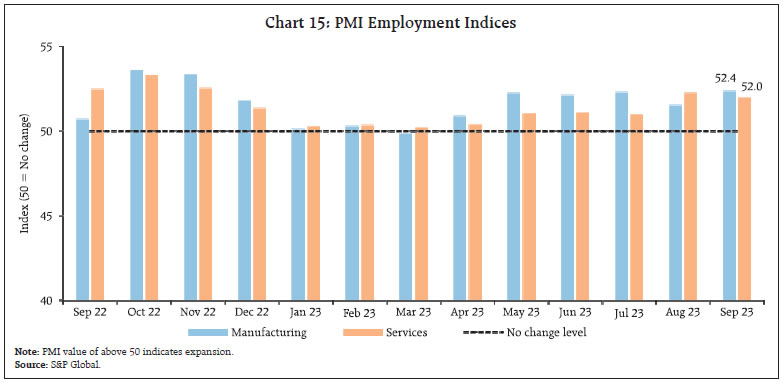 With the revival of the monsoon in September, the demand for work under the Mahatma Gandhi National Rural Employment Guarantee Scheme (MGNREGS) continued to decline with the progress in kharif sowing (Chart 16). 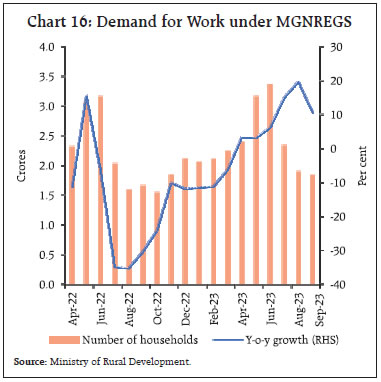 India’s merchandise exports at US$ 34.5 billion13 registered a contraction of 2.6 per cent (y-o-y) in September 2023, with 18 out of 30 major commodities (with a combined share of 51.9 per cent in the export basket) recording a decline (Chart 17). Petroleum products, gems and jewellery, organic and inorganic chemicals dragged exports down, whereas engineering goods, iron ore, cotton yarn/fabrics, made-ups and handloom products contributed positively to export growth in September (Chart 18). The final estimates available for August 2023 showed that India’s exports recorded a growth of 3.9 per cent (y-oy) in August 2023 - the first expansion in six months, as against the earlier estimate of a contraction by (-) 6.8 per cent, reported in the previous edition of this article. Due to an upward revision by US$ 3.8 billion, the growth in value of petroleum products for August 2023 is now placed at 13.7 per cent (y-o-y) on the back of highest ever monthly shipments, as against a contraction witnessed for five consecutive months (Chart 19a). Exports of engineering goods, which account for more than one-fourth of India’s merchandise export basket, grew by 7.8 per cent (y-o-y) in August 2023 after registering a contraction for eight consecutive months. Within engineering goods, 25 out of the 34 goods registered a growth in August 2023. Notably, electric machinery and equipment, other construction machinery and copper contributed positively to export growth, while aluminium and products were the main laggards (Chart 19b). 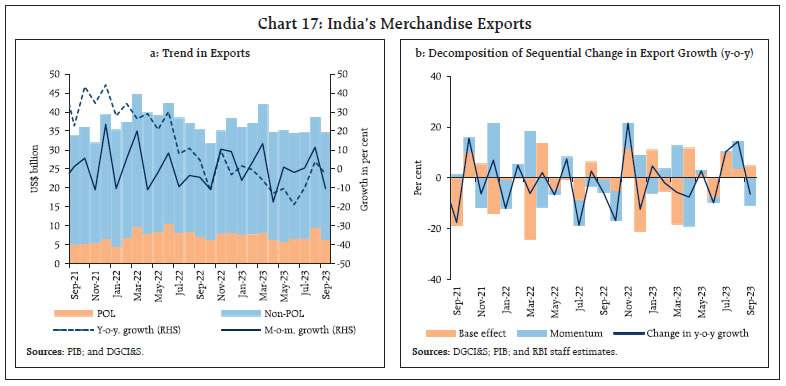 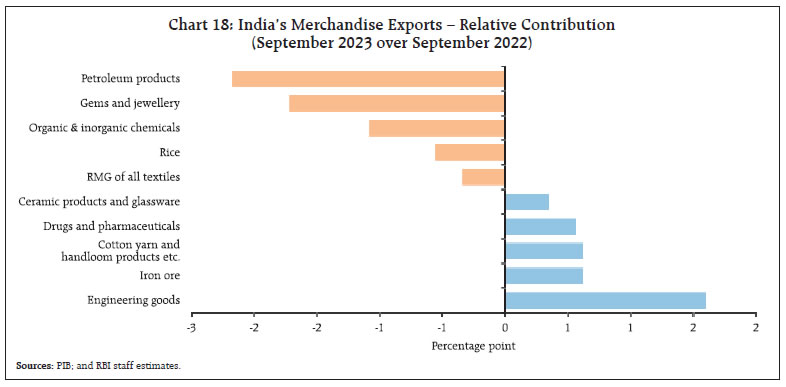 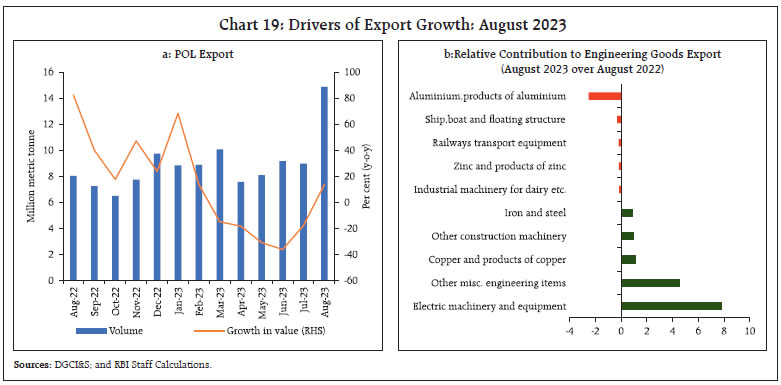 Merchandise imports at US$ 53.8 billion registered a contraction of 15 per cent (y-o-y) in September 2023, the eighth consecutive month of contraction (Chart 20). 20 out of 30 major commodities, accounting for 54.4 per cent of the import basket registered a decline on y-o-y basis. Petroleum, oil and lubricants (POL), transport equipment, coal, coke and briquettes, fertiliser and silver were the main items that dragged imports down while electronic goods, gold, non-ferrous metals, dyeing/tanning/colouring materials and artificial resins, plastic materials, contributed positively in September 2023 (Chart 21). With stronger negative momentum in imports than in exports, the merchandise trade deficit in September declined by US$ 2.3 billion on a sequential basis to reach at US$ 19.4 billion. The oil deficit reached a 4-month high, accounting for about 38.7 per cent of the overall deficit (Chart 22). 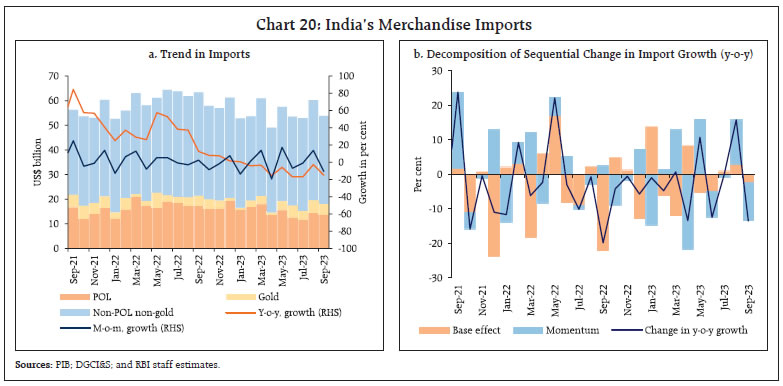 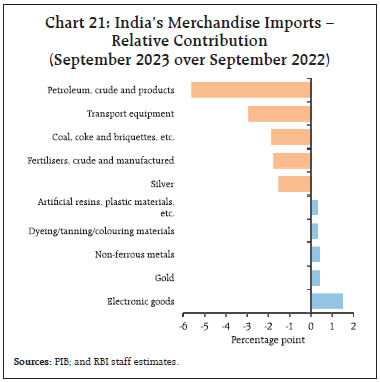 During April-September 2023, India’s merchandise exports at US$ 211.4 billion contracted by 8.8 per cent (y-o-y). Merchandise imports at US$ 327.0 billion declined by 12.2 per cent (y-o-y). Consequently, the merchandise trade deficit narrowed to US$ 115.6 billion from US$ 140.8 billion during the corresponding period a year ago. Petroleum products were the major source of the trade deficit, followed by electronic goods (Chart 23a). Country-wise, China and Russia remained the major sources of the trade deficit for the April-August period (Chart 23b). 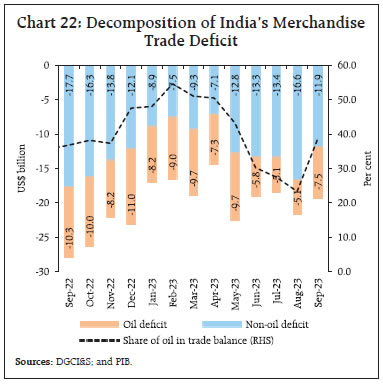 Services exports at US$ 28.7 billion in August 2023 exhibited a robust growth of 8.4 per cent (y-o-y) primarily driven by software and business services. On the other hand, services imports declined by 0.8 per cent y-o-y to US$ 15.1 billion, resulting in net services earnings of US$ 13.6 billion in August (Chart 24). With the global IT spending forecast to grow by 4.3 per cent in 202314, the outlook for India’s services exports remains encouraging. 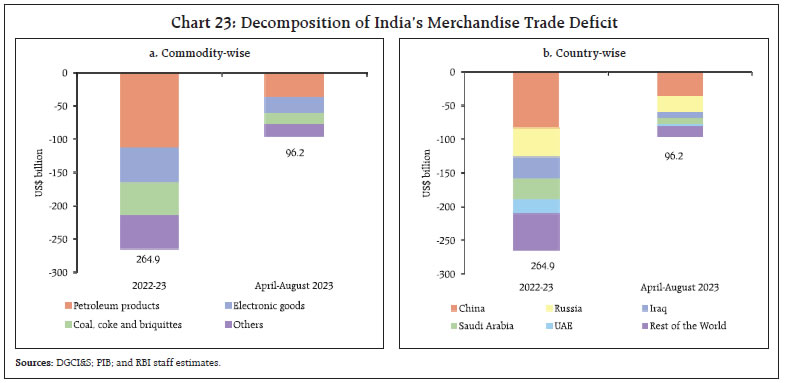 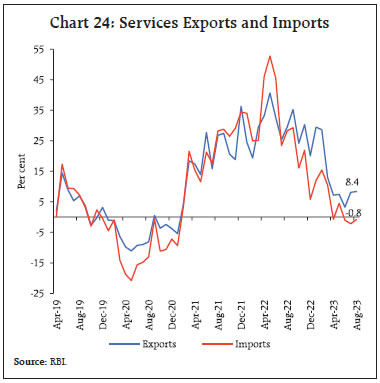 According to the Controller General of Accounts (CGA), the gross fiscal deficit (GFD) of the central government stood at 36.0 per cent of the budget estimates (BE) for 2023-24 during April-August 2023-24, marginally higher than 32.6 per cent of BE during the corresponding period of the previous year. This is attributable to an increase in capital expenditure by 48.1 per cent (y-o-y), which was led by the Ministry of Railways registering a y-o-y growth of 67.6 per cent and revenue expenditure by 14.1 per cent (y-o-y) [Chart 25a]. Revenue expenditure growth reflected the increase in expenditure incurred by the Ministry of Chemicals and Fertilisers on fertiliser subsidy, and the Ministry of Agriculture and Farmer’s Welfare, which recorded a y-o-y growth of 58.7 per cent and 24.9 per cent, respectively. Capital outlay (i.e., capital expenditure excluding loans and advances) recorded an increase of 35.3 per cent, resulting in a marked improvement in the quality of spending of the central government (Chart 25b). 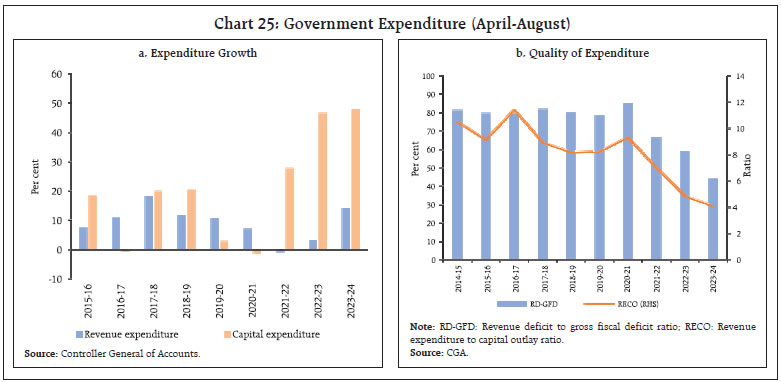 On the receipts side, direct tax collections grew by 26.1 per cent (y-o-y) during April-August 2023-24, with corporation tax growth turning positive for the first time in 2023-24, exhibiting signs of improvement in corporate profitability. The other major component of direct tax viz., income tax receipts recorded a growth of 35.7 per cent during April-August 2023 on top of 33.2 per cent growth during the corresponding period of the previous year. This points to increased compliance and a widening of the tax base.15 Besides, advance tax collections indicate an improvement in income tax and corporation tax collections during Q2:2023-24.16 On the other hand, indirect tax collections grew by 7.9 per cent (y-o-y), with the growth in goods and services tax (GST) and customs revenues outweighing the contraction in excise duties. Higher custom revenues are attributable to, inter alia, higher export and import duties for a few items, counterweighing the contraction in excise duties y-o-y terms, partly on account of duty cuts announced last year. Overall, gross tax revenue recorded a growth of 16.5 per cent y-o-y, led by double-digit growth in all major tax heads, except excise collections, which registered a contraction of 12.4 per cent (Chart 26). 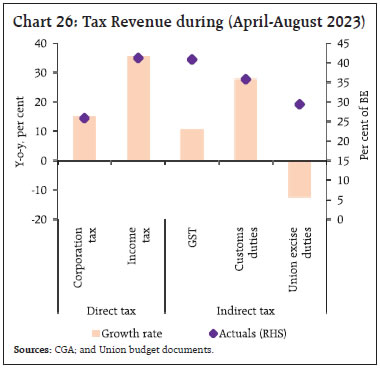 Non-tax revenue collection recorded a y-o-y growth of 79.4 per cent during April-August on the back of higher than budgeted surplus transfer from the Reserve Bank17 while non-debt capital receipts contracted by 51.1 per cent18 (Chart 27). Total receipts of the central government recorded an expansion of 21.3 per cent on a y-o-y basis. GST collections (Centre plus States) grew by 10.2 per cent (y-o-y) to ₹1.63 lakh crore in September 2023 which is the fourth highest monthly collection since its inception (Chart 28). The gross GST collection for H1:2023-24 at ₹9.93 lakh crore is 11 per cent higher than a year ago (₹8.93 lakh crore). 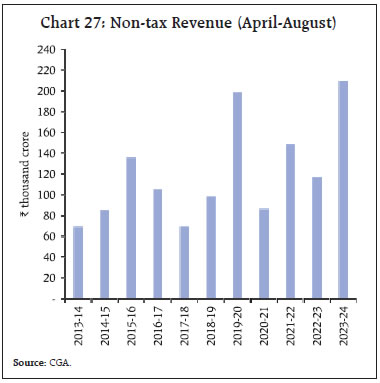 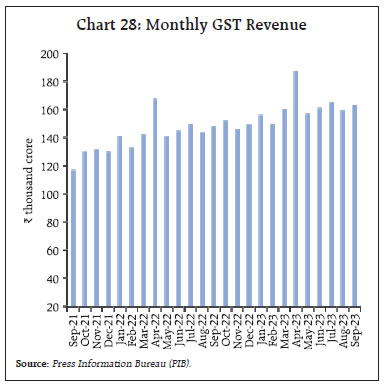 The central government’s borrowing proposal for H2:2023-24 has been kept unchanged at ₹6.55 lakh crore, in line with the full year’s budgeted borrowing target of ₹15.43 lakh crore.19 During 2023-24, ₹20,000 crore will be raised through Sovereign Green Bonds (SGBs), which is 25 per cent higher than the amount raised from SGBs a year ago. Besides, in response to growing market demand for longer duration securities, the government will issue 50-year securities for the first time. As per the accounts data available for April-August20 of 2023-24, states’ key deficit indicators as a proportion to the full year BE were higher than a year ago (Chart 29a). While growth in revenue receipts and expenditure moderated, capital expenditure growth remained robust (Chart 29b). Within revenue receipts, growth in tax revenue, including tax devolution from the Centre and non-tax revenue moderated mainly on account of high base effect, while grants from the Centre contracted sharply (Chart 30a). States’ goods and service tax (SGST) witnessed a y-o-y growth of 20.3 per cent. Among the debt service indicators, both interest payments to revenue receipts (IP-RR) ratio and interest payments to revenue expenditure (IP-RE) ratio remained at levels similar to a year ago (Chart 30b). 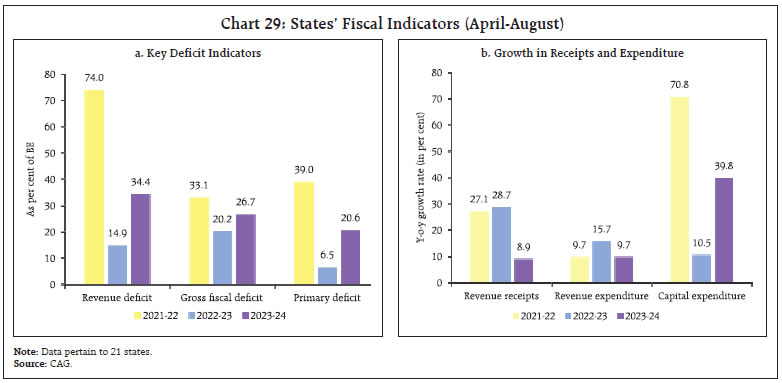 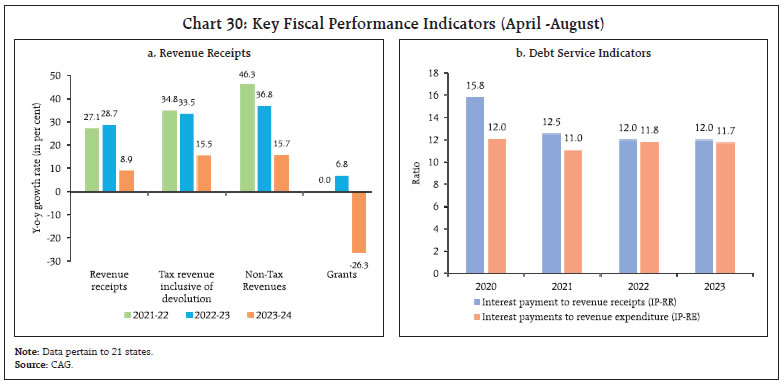 Aggregate Supply The south-west monsoon (SWM) ended with the country recording rainfall at 94.4 per cent of the long period average (LPA), akin to normal precipitation (Chart 31). There was a sharp rebound in September rainfall, aided by positive Indian Ocean Dipole (IOD) and Madden Julian Oscillation (MJO). As per our production weighted rainfall index (PRN), the cumulative monsoon rainfall this year was 7 per cent below the LPA. 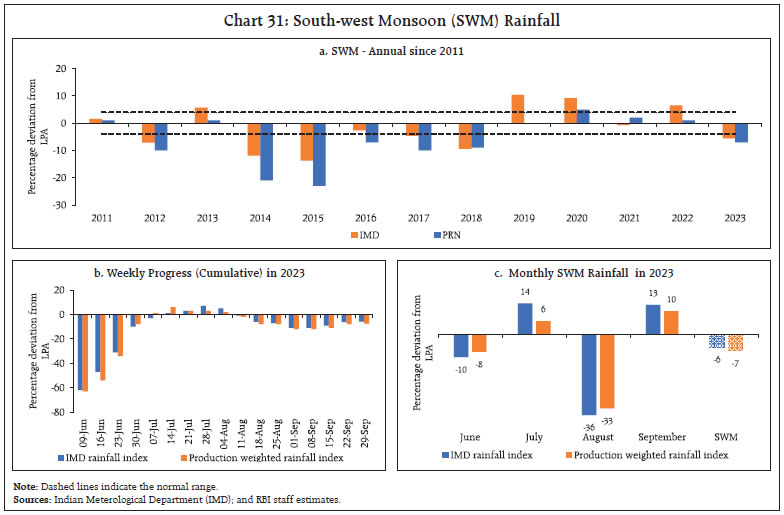 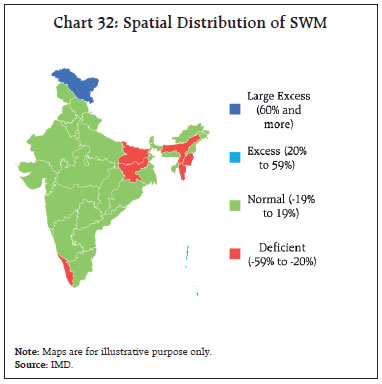 The distribution of rainfall was geographically uneven, with the east and north-east (-18 per cent of LPA) and the south peninsular region (-8 per cent of LPA), recording deficiency in precipitation while all other regions of the country received normal rainfall (Chart 32). It is expected that soil moisture levels are going to improve and rejuvenate the prospects for rabi production. Furthermore, the forecast for the North-East monsoon is ‘normal’ to ‘above normal’ over many areas of northwest and southern peninsular India (Chart 33). As on October 5, 2023, reservoir levels stood at 74 per cent of the full reservoir level (FRL), lower than the decadal average as well as last year’s level (Chart 34). Reservoir conditions in north, west and central India bode well for key rabi crops such as wheat, rapeseed and mustard and gram, which are primarily cultivated in five states belonging to these regions (Chart 35). 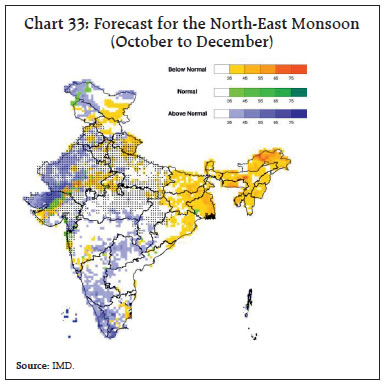 Rice procurement for the Kharif Marketing Season (KMS) for 2023-24 is 18.5 lakh tonnes up to October 8 against 13.6 lakh tonnes a year ago. As of September 16, 2023, the public stocks of rice and wheat were 2.4 and 0.9 times the buffer norms, respectively. The government has set the foodgrains production target for rabi season at 161.2 million tonnes, with wheat at 114 million tonnes, 1.1 per cent higher than the third advance estimates for rabi 2022-23 (Chart 36). Similarly, the target for pulses and oilseeds are set at 18.2 million tonnes and 14.5 million tonnes, respectively, which are 4 per cent and 3.7 per cent higher than the third advance estimates of rabi 2022-23. 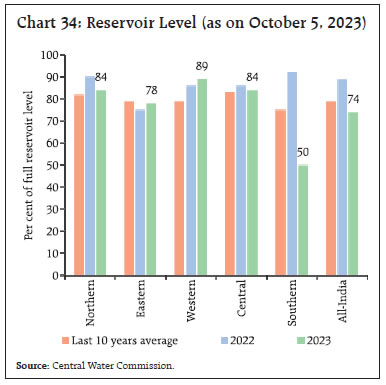 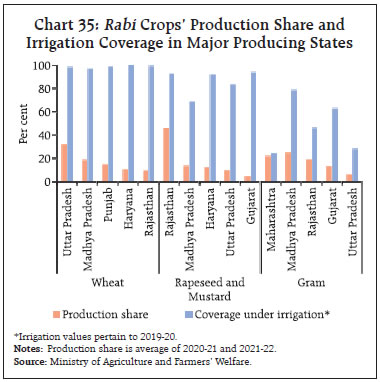 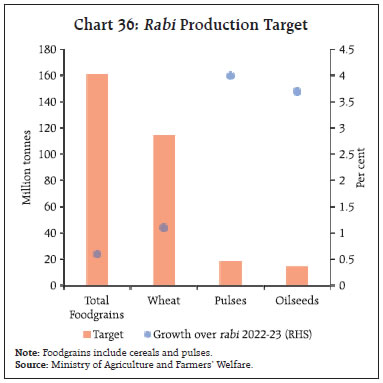 The headline PMI for manufacturing sector moderated to 57.5 in September 2023 from 58.6 a month ago on the back of lower new orders and output. On the other hand, business expectations reached a nine-month high at 65.9 (Chart 37a). The PMI for services expanded to 61.0 in September 2023 (one of the strongest in over thirteen years), with business expectations improving to a nine-year high (Chart 37b). 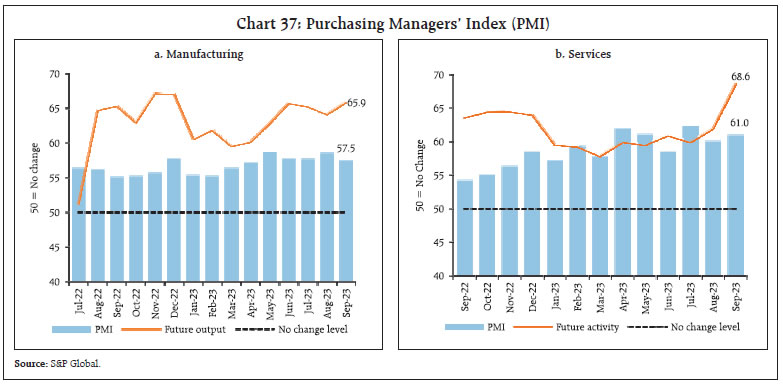 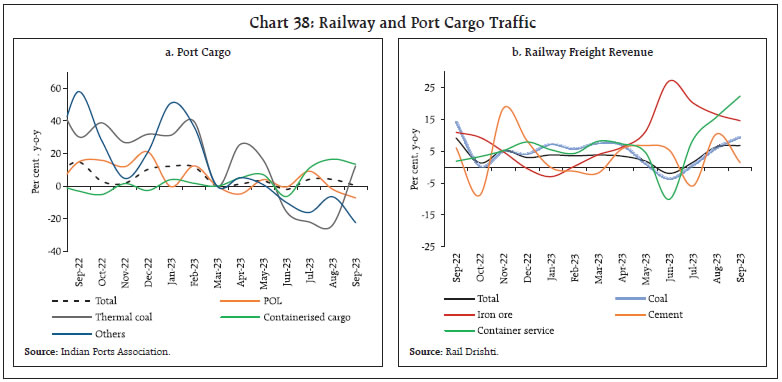 Growth in cargo traffic at major ports moderated to a three-month low (Chart 38a). Railway freight traffic recorded the highest growth in 12 months, driven by an increase in freight of coal and containerised cargo (Chart 38b). Coincident indicators of the construction sector remained strong in September, with steel consumption increasing by 17.9 per cent (y-o-y) aided by high government infrastructure spending. Cement production increased by 18.9 per cent (y-o-y) in August 2023 (Chart 39). 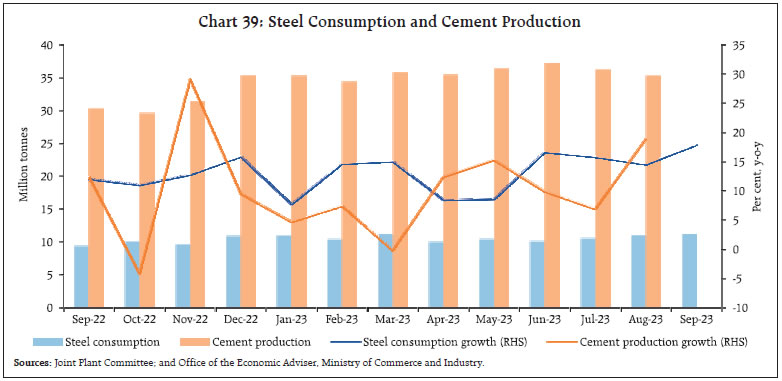 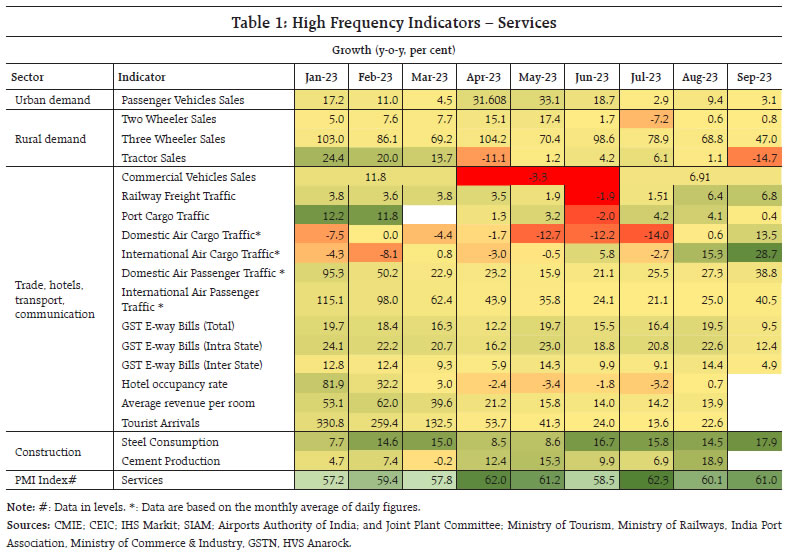 High-frequency indicators for the services sector reflect a broad-based uptick in overall economic activity in September 2023. Higher y-o-y growth in air cargo, railway freight and construction indicators of steel consumption and cement production validated the uptick (Table 1). In terms of regional policy initiatives, Maharashtra’s New Information Technology (IT) and Information Technology Enabled Services (ITES) Policy seeks to make the state a global hub for IT and ITES technology. Odisha launched the Location Accessible Multi-modal Initiative (LAccMI) to establish a seamless public transport network across the state to ensure sustainable, affordable, assured, and safe transportation of passengers and commodities. To generate employment opportunities, Madhya Pradesh will invest ₹2 lakh crore in the establishment of a petrochemicals complex refinery project. Tamil Nadu introduced a subsidy scheme under the E-Rental (E-Vaadagaii) application to meet farmers’ need for agricultural machinery. Inflation Headline inflation, as measured by y-o-y changes in the all-India consumer price index (CPI)21, moderated to 5.0 per cent in September 2023 from 6.8 per cent in August (Chart 40). The softening in inflation by 180 bps came from a strong negative momentum of around 110 bps and a favourable base effect of around 60 bps. Food prices recorded a m-o-m decline of around 180 bps while fuel prices fell around 390 bps m-o-m. The index of core prices (i.e., CPI excluding food and fuel) remained unchanged. 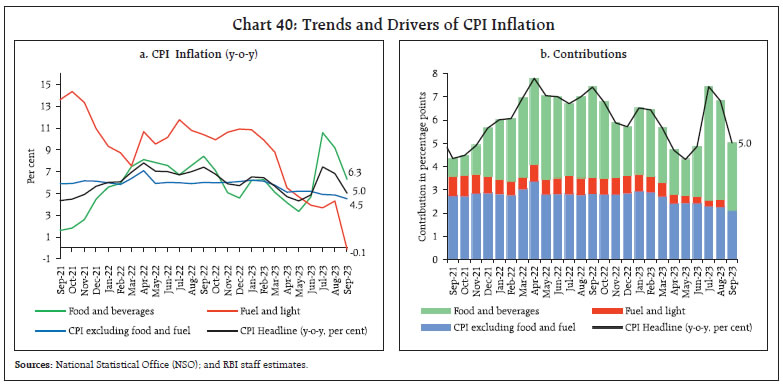 Food inflation (y-o-y) fell to 6.3 per cent in September from 9.2 per cent in August. In terms of sub-groups, vegetable price inflation corrected sharply to 3.4 per cent in September from 26.1 per cent in the previous month. Inflation in cereals, milk, non-alcoholic beverages, and prepared meals also softened. While edible oil prices remained in deflation, inflation edged up in meat and fish, eggs, fruits, pulses and sugar. It remained steady, albeit at elevated levels, for spices (Chart 41). The fuel and light group recorded deflation of (-) 0.1 per cent in September as against an inflation of 4.3 per cent in August. There was a sharp reduction in LPG prices, reflecting the full impact of the reduction in domestic LPG prices by ₹200 per cylinder effected at the end of August. Electricity, firewood and other cooking fuel prices also registered some moderation on a y-o-y basis. Kerosene prices in the public distribution system (PDS) remained in deflation. 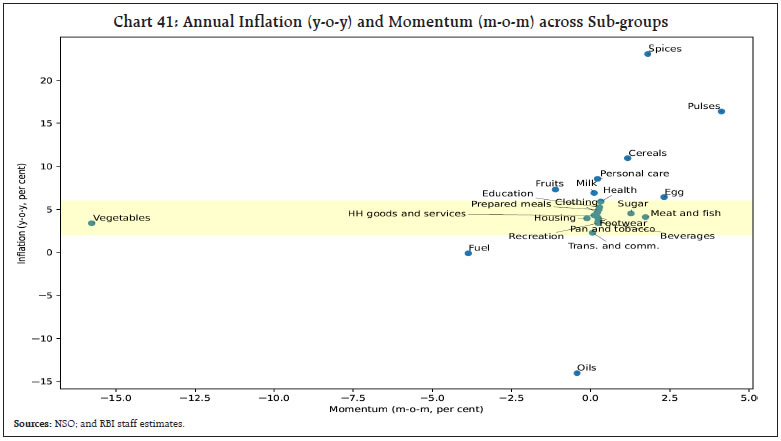 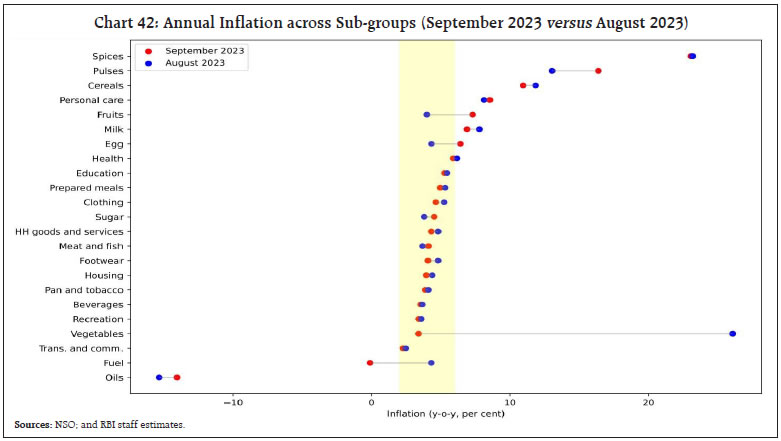 Core inflation moderated to 4.5 per cent in September from 4.9 per cent in August. The moderation was broad-based across most sub-groups (Chart 42). Inflation in personal care and effects, on the other hand, edged up after softening for three consecutive months due to a pick up in gold prices. In terms of regional distribution, rural inflation at 5.3 per cent was higher than urban inflation (4.7 per cent). Majority of the states registered inflation in the range of 4-6 per cent. Haryana, Karnataka, and Rajasthan recorded inflation between 6 to 8 per cent (Chart 43). High frequency food price data for October (up to 12th) show that while cereal and pulses prices rose further, edible oil prices remained in a broad-based decline (Chart 44). Amongst key vegetables, tomato prices continued to correct in October. Onion prices registered a sequential uptick, although at a lower rate. Potato prices remained largely steady. 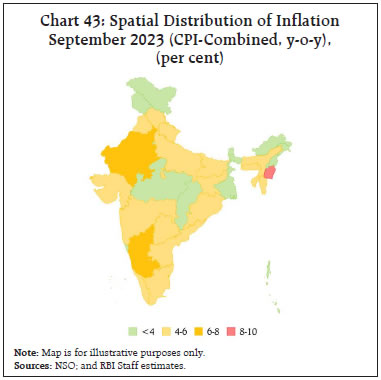 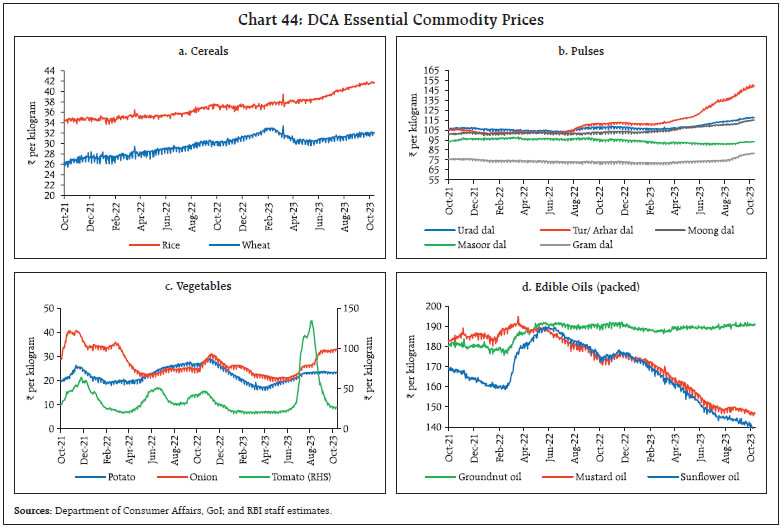 Retail selling prices of petrol and diesel in the four major metros remained steady in October (up to 12th). While kerosene prices increased further following the upsurge in international prices, LPG prices were kept unchanged in September and October (Table 2). The PMIs for September 2023 indicated a moderation in input costs across manufacturing and services. Selling prices, on the other hand, increased in the manufacturing sector while they moderated for the services sector (Chart 45). Surveys conducted by the Reserve Bank indicate that, going forward, input cost pressures remain firm for the manufacturing sector while services and infrastructure companies expect them to moderate (Annex 1). Households’ median inflation expectations declined by 90 basis points (bps) and 40 bps over three months and one year horizons, respectively, to revert to single digits since the onset of the Covid-19 pandemic (Chart 46). The share of households expecting higher inflation for the major product groups has also come down. 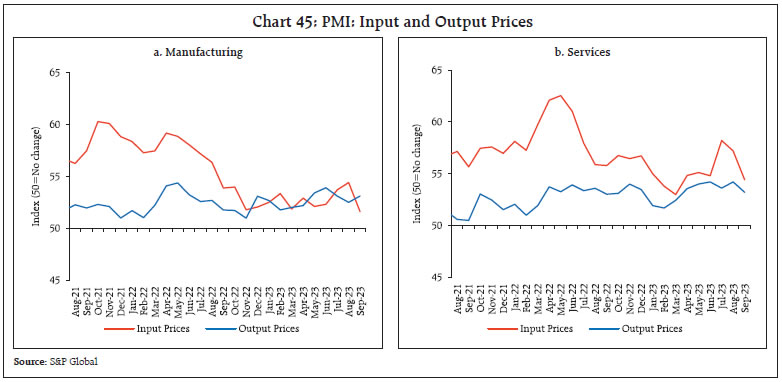 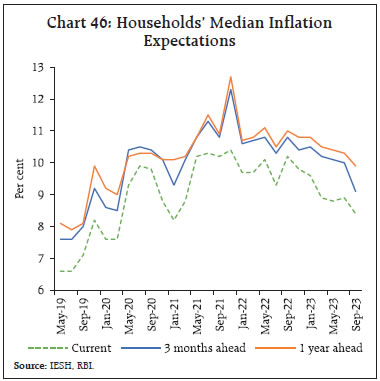 Consistent with the policy decision and stance in the fourth bi-monthly policy meeting of 2023-24 held during October 4-6, the Governor’s statement indicated that liquidity would be modulated through various instruments, including open market sales, as needed. The build-up of government cash balances due to advance tax collections and GST payments tightened liquidity conditions during the second half of September and early October. Consequently, the average total absorption under the liquidity adjustment facility (LAF) declined to about ₹0.8 lakh crore during September 16 – October 13, 2023 from ₹1.0 lakh crore during August 16 to mid-September (Chart 47). Of the total average surplus liquidity, placement of funds under the standing deposit facility (SDF) averaged ₹0.7 lakh crore while the remaining amount was mopped up through main operations in the form of variable rate reverse repo (VRRR). The 14-day VRRR auction conducted on October 6 elicited offers of ₹6,668 crore against a notified amount of ₹50,000 crore at a cut-off rate of 6.49 per cent. As noted in earlier edition of this article, banks have preferred to place funds under the overnight SDF instead of the 14-day VRRR main operations, reflecting heightened uncertainty surrounding payment obligations related to large tax outflows. As liquidity conditions tightened, recourse to the marginal standing facility (MSF) increased, with daily average borrowings during this period at ₹1.3 lakh crore (₹0.30 lakh crore during August 16 – September 15). On a daily basis, MSF borrowings touched an all-time high of ₹1.99 lakh crore on September 21. Large placement of funds under the SDF alongside simultaneous recourse to the MSF is symptomatic of skewed liquidity distribution in the banking system. Net LAF (including MSF) operations slipped into deficit, with the Reserve Bank engaging in average daily net injection of ₹0.7 lakh crore.22 With the release of the remaining impounded I-CRR funds and a pickup in government spending, liquidity conditions should ease despite the festival time increase in currency demand. 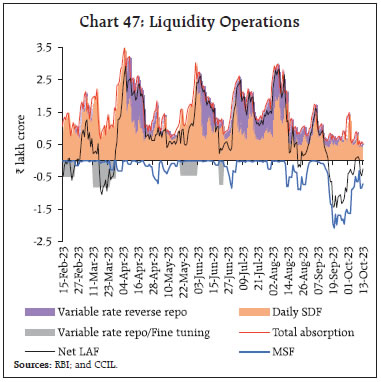 Reflecting the tight liquidity conditions, overnight money market rates hovered close to the ceiling of the LAF corridor during the second half of September.23 On an average, the WACR, triparty and market repo rates traded 23 bps, 26 bps and 22 bps, respectively, above the policy repo rate (Chart 48a). Across the term money segment, the yields on 3-month CDs and commercial paper (CP) for NBFCs stayed elevated, while the yield on 3-month treasury bills (T-bills) was broadly aligned with the MSF rate (Chart 48b). 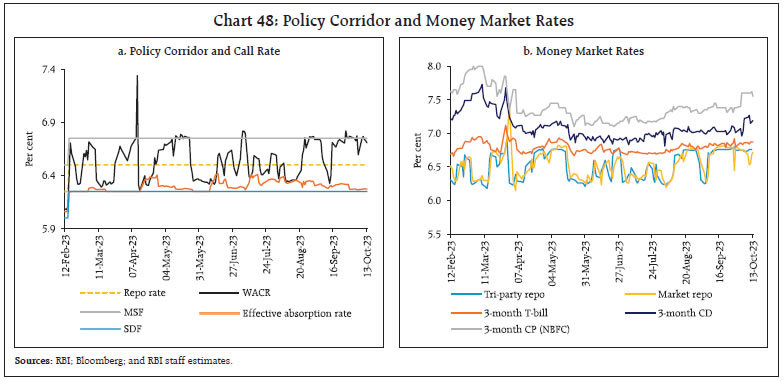 Fund mobilisation through issuances of CDs has picked up to ₹3.31 lakh crore during 2023-24 (up to October 6) from ₹3.08 lakh crore in the corresponding period of the previous year as banks tried to bridge the funding gap caused by faster credit vis-à-vis deposit growth. CP issuances at ₹7.1 lakh crore (up to September 30) were broadly unchanged vis-à-vis ₹7.3 lakh crore a year ago. Domestic bond yields firmed up, taking cues from the rise in the US treasury yields, with the 10-year benchmark yield rising to 7.32 per cent on October 13 from 7.21 per cent on October 5 (Chart 49a). Yields hardened across the term structure and the yield curve shifted upwards (Chart 49b). Corporate bond yields exhibited mixed trend and associated risk premia narrowed during September 18 to October 12, 2023; however, the average risk premia in the liquid segment of the bond market (5-year AAA minus 5 year G-sec) remained unchanged indicating healthy investor appetite (Table 3). Favourable market conditions and a cost advantage over bank loans have increased the demand for corporate bonds. Overall, corporate bond issuances during the current year so far (up to September) at ₹3.9 lakh crore is sharply higher than ₹2.8 lakh crore during the same period of the previous year. 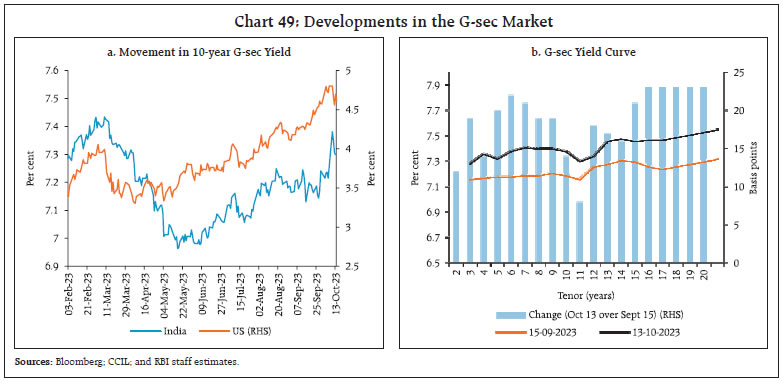 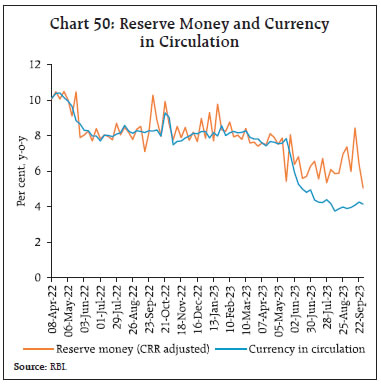 Reserve money (RM), excluding the first-round impact of change in the cash reserve ratio (CRR)24, recorded a growth of 6.1 per cent (y-o-y) as on October 13, 2023 (8.0 per cent a year ago) [Chart 50]. Growth in currency in circulation (CiC), the largest component of RM, decelerated to 3.6 per cent from 8.0 per cent a year ago, reflecting the withdrawal of ₹2000 banknotes25 − 96 per cent has been returned to the banking system (as on September 30, 2023), mostly in the form of deposits. In terms of value, of the total ₹3.56 lakh crore of ₹2000 banknotes in circulation as on May 19, 2023, ₹3.42 lakh crore has been received back leaving only ₹0.14 lakh crore in circulation as at the close of business on September 29, 2023. The facility to deposit/exchange of ₹2000 banknotes was extended from September 30 until October 7, 2023. As on October 6, 2023 money supply (M3) expanded by 11.0 per cent (y-o-y) as against 9.0 per cent a year ago. Aggregate deposits, the largest component of M3, increased by 12.2 per cent (9.1 per cent a year ago). Scheduled commercial banks’ (SCBs’) credit (excluding the impact of the merger of HDFC with HDFC bank) growth remained robust at 14.7 per cent as on October 6, 2023 (Chart 51). 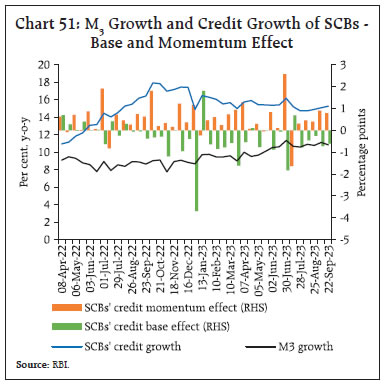 During May 2022 to August 2023, the weighted average lending rate (WALR) on fresh rupee loans increased by 196 bps. The WALR on outstanding rupee loans increased by 112 bps during May 2022 to August 2023. On the deposit side, the weighted average domestic term deposit rate (WADTDR) on fresh and outstanding deposits increased by 233 bps and 157 bps, respectively, during the same period. While the WADTDR on fresh deposits has declined in recent months, rates on outstanding term deposits continue reflecting the repricing at higher rates (Table 4). Savings deposit rates of banks have responded slowly, moderating the extent of transmission to total deposit rates (including term as well as savings deposits).26 The pass-through to WALR on fresh rupee loans and WADTDR on fresh deposits was higher for public sector banks than for private banks, while transmission to WALR on outstanding loans was higher for private banks (Chart 52). On September 29, the government increased the interest rate on the five-year recurring deposit scheme to 6.7 per cent from 6.5 per cent for Q3:2023-24, while keeping the rates same for all other small savings schemes (Chart 53).27 During September 2023, the BSE Sensex increased by 4.64 per cent in the first half of the month, scaling new peaks on strong macroeconomic fundamentals. The benchmark index registered losses in the second half, declining by 2.96 per cent as markets prepared for a high interest rate environment globally following hawkish commentary from the US Fed and the rising 10-year US treasury yield. Overall, the market ended with marginal gains of 1.54 per cent during the month (Chart 54). The broader market indices continued their uptrend, with the BSE MidCap and SmallCap increasing by 3.65 per cent and 1.13 per cent, respectively, during the month. The primary market experienced vibrant activity with 31 initial public offerings (IPOs) comprising a total issue size of ₹9,285 crore – the highest in the current year. 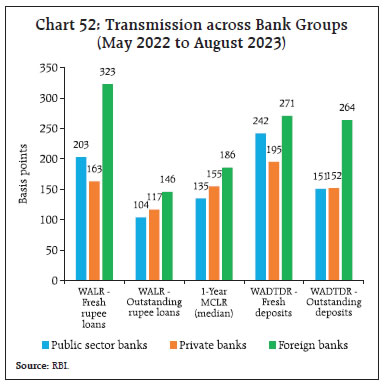 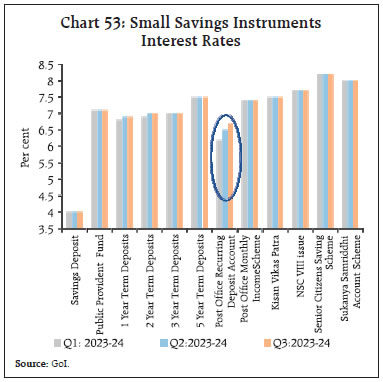 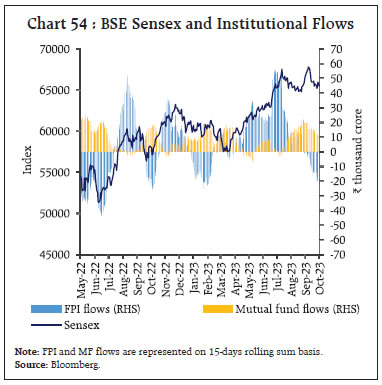 In October, thus far, markets have remained under pressure from the elevated yields globally as well as worsening geopolitical situation in the Middle-East. The markets have registered marginal gains of 0.69 per cent till October 13, 2023. Positive macroeconomic releases have weighed against global uncertainties to keep the markets rangebound. Gross inward FDI moderated to US$ 26.9 billion during April-August 2023 from US$ 34.2 billion a year ago (Chart 55). Manufacturing, financial services, business services, computer services, electricity and other energy sectors contributed around two-third of the FDI equity flows. There was moderation in flows directed towards computer services, manufacturing, financial services and electricity and other energy sectors. Singapore, Japan, the US, the Netherlands and Mauritius were major source countries, accounting for more than two-thirds of the FDI equity flows during the same period. FDI inflows from Singapore, Mauritius and the US slowed during April-August 2023. Net FDI declined to US$ 3.0 billion during April-August 2023 from US$ 18.0 billion a year ago on account of moderating gross FDI and a rise in repatriation. 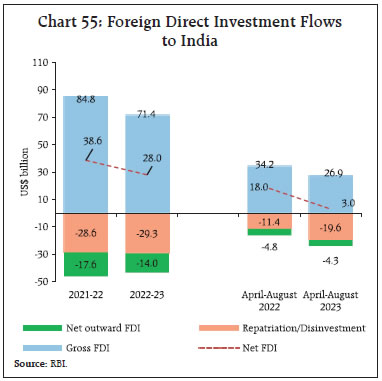 After sustained buying in the last six months, foreign portfolio investors (FPIs) turned net sellers in domestic financial markets in September 2023, with net outflows of US$ 2.0 billion, led by the equity segment (Chart 56a). Within equity, power, oil, gas and consumable fuels, and metals and mining recorded outflows, whereas capital goods and consumer services attracted fresh investments. Amidst high US bond yields and strong US dollar, other EMEs also faced outflow pressures during the month. During the current financial year (up to September 2023), net FPI inflows to India stood at US$ 20.3 billion, with equity inflows at US$ 17.2 billion – the highest among emerging market peers (Chart 56b). In October 2023 (up to 12th), net sales by FPIs were to the tune of US$ 0.5 billion. Net accretions to non-resident deposits rose to US$ 3.7 billion during April-August 2023, led by accretions to Foreign Currency Non-Resident [FCNR(B)] accounts, as compared with US$ 1.4 billion during the same period a year ago. 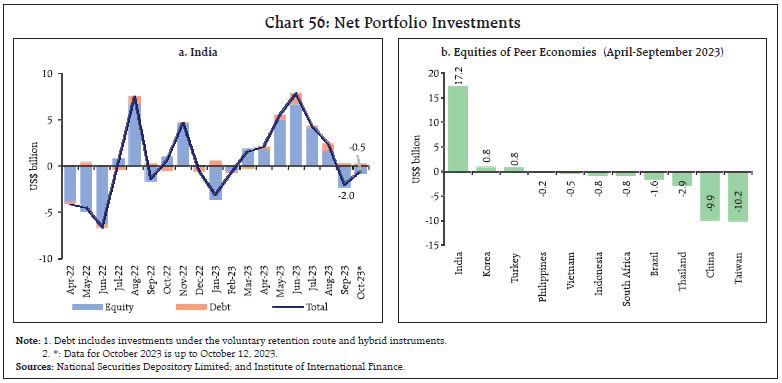 After a surge in Q1:2023-24, external commercial borrowing (ECB) registrations have reverted to their long period monthly average levels in recent months. Gross disbursements of ECBs to India at US$ 18.3 billion during April-August 2023, was more than double US$ 8.3 billion a year ago. On a net basis, ECBs recorded inflows of US$ 6.8 billion as against a small net outflow in the corresponding period of the previous year (Chart 57). 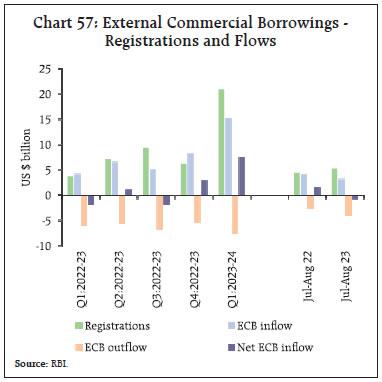 Global monetary tightening led to higher cost of ECBs raised during April-August 2023, even as the weighted average interest margin over the benchmark rates came down to 139 bps from 177 bps a year ago (Chart 58). 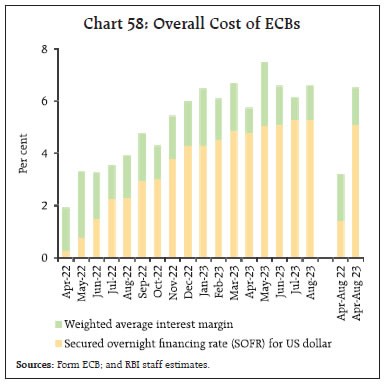 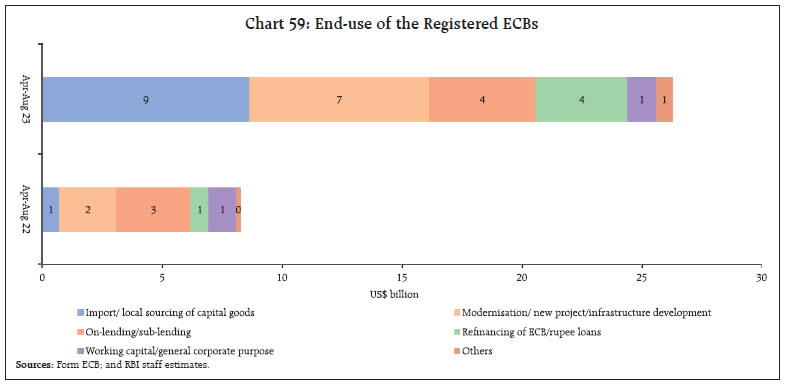 Nearly two-thirds of ECBs registered during April-August 2023 were earmarked for capital expenditure purposes (Chart 59). The foreign exchange reserves stood at US$ 584.7 billion on October 6, 2023 covering about 10 months of imports projected for 2023-24 (93 per cent of total external debt outstanding at end-June 2023) [Chart 60a]. During the calendar year 2023, India’s foreign exchange reserves increased by US$ 22.0 billion, which is the highest among major foreign exchange reserves holding countries (Chart 60b). 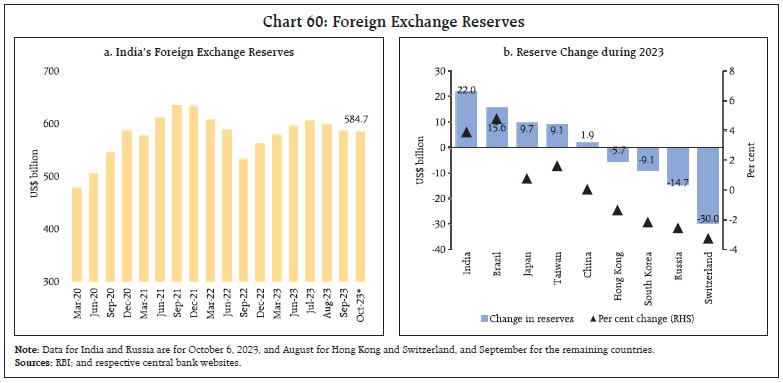 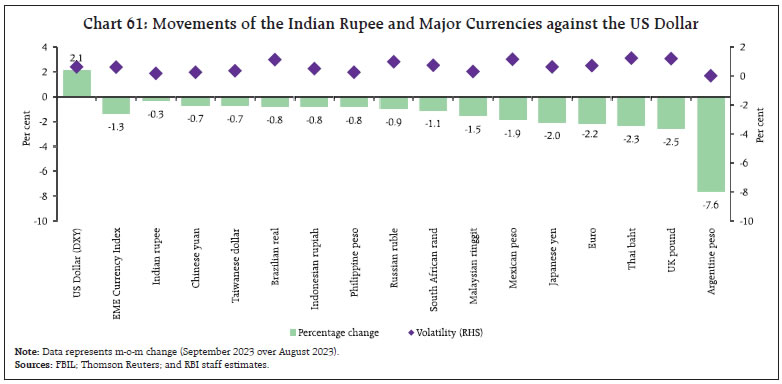 The Indian rupee (INR) depreciated by 0.3 per cent (m-o-m) vis-à-vis the US dollar in September 2023 (Chart 61). The INR remained one of the least volatile among major currencies during the month. The INR depreciated by 1.1 per cent (m-o-m) in terms of the 40-currency real effective exchange rate (REER) in September 2023 as negative relative price/cost differentials more than offset the appreciation of the INR in nominal effective terms (Chart 62). India’s net international investment position (IIP) increased by US$ 12.1 billion during Q1:2023-24 due to a rise in foreign-owned financial assets in the country vis-a-vis residents’ overseas financial assets (Chart 63). Reserve assets accounted for 64.2 per cent of India’s total international financial assets. Liabilities consisted of debt and non-debt components in equal share. The ratio of India’s international assets to international liabilities was 70.9 per cent and net claims of non-residents on India stood at US $ 379.7 billion in June 2023. 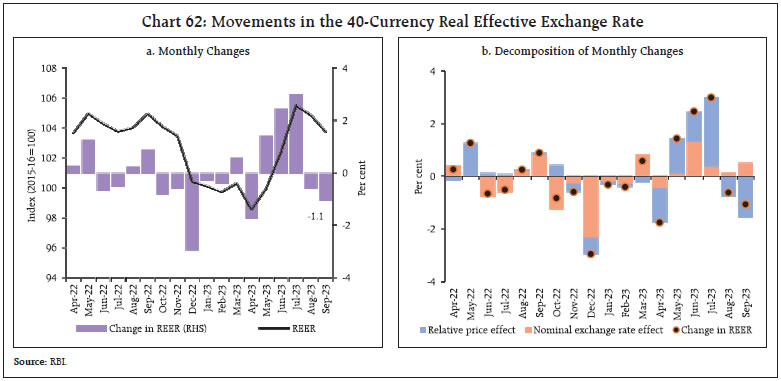 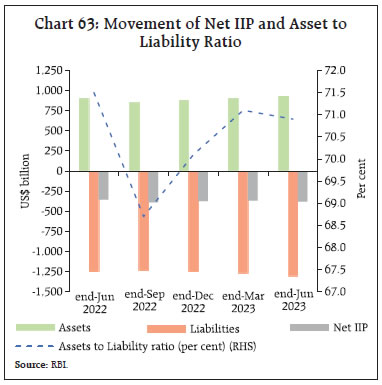 Key indicators of external sector vulnerability remained at sustainable levels at end-June 2023 (Chart 64), indicating India’s external sector resilience (Chart 65). 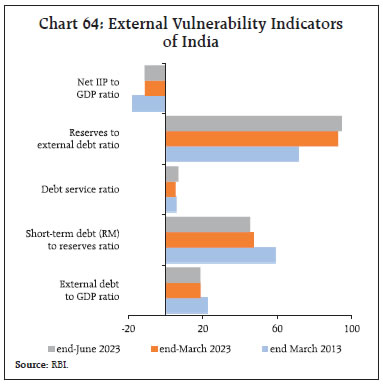 Payment Systems Digital payment transactions displayed steady growth (y-o-y) across large value and retail payment modes in September 2023 (Table 5). The Unified Payments Interface (UPI) recorded more than 10 billion transactions for the second consecutive month, with the aggregate transaction value reaching ₹15.8 lakh crore. Within the UPI, the average ticket size for person-to-merchant (P2M) transactions reduced to ₹640 in September 2023 from ₹717 in September 2022, indicating a shift towards digital payments even for low-value transactions. Transaction volumes under the National Electronic Toll Collection (NETC) recorded an uptick, pushed up by rising vehicle density and enhancements in FASTag usage. In the cards segment, credit card spending scaled the peak of ₹1.48 lakh crore in August on the back of robust growth in e-commerce and point-of-sale transactions. 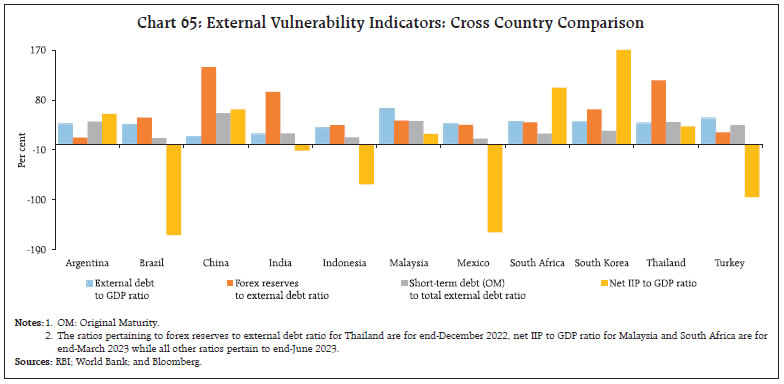 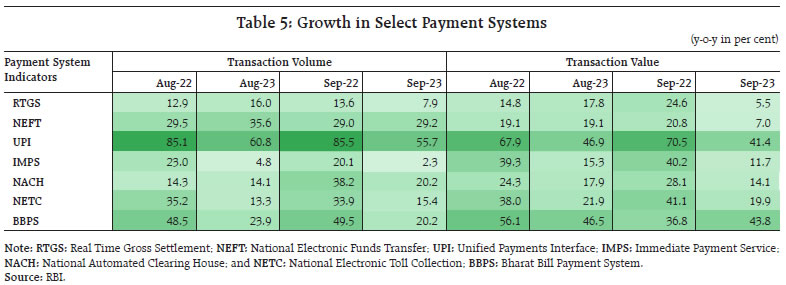 Merchant payments are poised to drive the next phase of growth in the Indian digital payment ecosystem. Buoyed by low transaction fees and expanding acceptance, P2M transactions in India are projected to constitute 75 per cent of all UPI transactions by 2025, up from 58.5 per cent in September 2023.28 Recent digital innovations, including conversational payments, the UPI Tap and Pay facility, and credit lines on the UPI are expected to further boost adoption of digital payments. In the Statement on Developmental and Regulatory Policies announced on October 06, 202329, the Reserve Bank extended the Payment Infrastructure Development Fund (PIDF) Scheme by two years up to December 31, 2025, including for beneficiaries of the PM Vishwakarma Scheme in all centres, thereby encouraging deployment of emerging modes of payment acceptance to promote digital transactions at grassroots level. Additionally, it has been proposed to introduce Card-on-File (CoF) token creation facilities directly at the issuer bank level. Conclusion In this strange and heady environment of formidable global headwinds and resilient domestic economic activity, the MPC met during October 4-6 for its fourth bi-monthly meeting for the year 2023-24. Its resolution reflects the approaching of an inflection point in the conduct of monetary policy in India. The MPC observed that the expected correction in vegetable prices from the spike of July-August along with the recent reduction in LPG prices could improve the near-term inflation outlook. A major positive development is the relative stability in core inflation, with services inflation muted. While risks are evenly balanced, with weather conditions and volatile global energy and food prices weighing in on the upside, firms across manufacturing and services sectors expect moderation in growth of selling prices. Households are looking through the current inflation spike, awaiting better days three months and a year ahead. Consumer confidence in the fight against inflation is upbeat. Accordingly, the MPC retained the CPI inflation forecast at 5.4 per cent for 2023-24, the same as in its August 2023 meeting. Inflation is projected to ease to 4.5 per cent in 2024-25 in the Reserve Bank’s monetary policy report (MPR). In the assessment of the MPC, the outlook for domestic activity is brightening on account of the sustained buoyancy in services, consumer and business optimism, public spending on infrastructure and the underlying strength of the financial sector’s balance sheet even as corporations deleverage and post strong bottom lines. Growth is expected to gain momentum through the rest of the year, especially from the impetus of festival spending. On the external front, the current account deficit (CAD) is modest and more than financed, with foreign exchange reserves providing a strong buffer that is insulating the economy from global spillovers as well as from the slowdown in external demand. While recognising global risks and the volatility in financial markets that they entail, the projection of real GDP growth for 2023-24 was also retained at 6.5 per cent by the MPC, as in June. The MPR maintained 6.5 per cent as the projection of growth for 2024-25. With this growth-inflation configuration going forward, the MPC decided to remain on high vigil on price pressures, with a preparedness to undertake appropriate actions, should the recurrence of food price shocks and the incidence of global spillovers accumulate within the system and impart persistence to inflation formation in the months ahead. With inflation ruling above the upper tolerance level for two successive months, priority has been assigned to maintaining a disinflationary stance and the alignment of inflation outcomes with the target. In this eventful and turbulent milieu, the MPC decided to monitor the pass-through of the cumulative rate increases it had undertaken since May 2022 and maintain status quo on the policy rate. Persevering with its stance of withdrawal of accommodation, it noted that the strength of underlying fundamentals of the Indian economy and the improving consumer and business outlook contribute to its policy decisions. In the words of Governor Shri Shaktikanta Das, “the Indian economy is forging ahead in a challenging global environment…Our commitment to ensure financial stability reinforces our emphasis on price stability and anchoring of inflation expectations. This would keep inflation risk premium low and improve our competitiveness, productivity and growth potential.” Annex 1: Major Takeaways from the RBI’s Enterprise Surveys
* This article has been prepared by G. V. Nadhanael, Subhadhra Sankaran, Shahbaaz Khan, Kunal Priyadarshi, Rohan Bansal, Ramesh Kumar Gupta, Pankaj Kumar, Harendra Behera, Rigzen Yangdol, D. Suganthi, Satyendra Kumar, Harshita Yadav, Ettem Abhignu Yadav, Shivam, Shelja Bhatia, Priyanka Sachdeva, Sakshi Awasthy, Dilpreet Sharma, Khushi Sinha, Avnish Kumar, Pratibha Kedia, Sourajyoti Sardar, Shivangee Misra, Abhilash Arun Satape, Asish Thomas George, Vineet Kumar Srivastava, Samir Ranjan Behera, Deba Prasad Rath, R. Subramanian and Michael Debabrata Patra. Views expressed in this article are those of the authors and do not represent the views of the Reserve Bank of India. 1 At WTO, growing disregard for trade rules shows world is fragmenting, Reuters, October 3, 2023. 4 Economic Times, September 25, 2023. 5 Indian Express, October 4, 2023. 6 The projections are increasingly consistent with a “soft landing” scenario, especially in the United States, where the forecast increase in unemployment is very modest, from 3.6 to 3.9 per cent by 2025. 7 Nonetheless, the OECD in its latest Economic Outlook of September 2023 expects G20 inflation to fall from 7.8 per cent in 2022 to 6.0 per cent in 2023 and further to 4.8 per cent in 2024. 8 Core inflation is expected to increase for G20 Advanced Economies (AEs) from 4.2 per cent in 2022 to 4.3 per cent in 2023 before softening to 2.8 per cent in 2024. 9 For all banks except those that have implemented a 5 per cent reserve ratio. 10 IDU is a companion piece to the South Asia Development Update, a twice-a-year World Bank report that examines economic developments and prospects in the South Asia region and analyses policy challenges faced by countries. 11 Credit Ratio is defined as the number of entities upgraded to that downgraded. 12 https://www.cnbctv18.com/business/fmcg-sales-down-23-in-q2-amid-food-inflation-erratic-monsoon-bizom-data-17993191.htm 13 As per the provisional data released on October 13, 2023 https://pib.gov.in/PressReleasePage.aspx?PRID=1967357 14 As per Gartner, an IT research firm and consultancy group. 15 https://pib.gov.in/PressReleseDetail.aspx?PRID=1944821#:~:text=The%20total%20number%20of%20ITRs,till%2031st%20July%202022 16 https://incometaxindia.gov.in/Lists/Press%20Releases/Attachments/1152/PressRelease-Gross-Direct-Tax-collections-for-the-Financial-Year-2023-24.pdf 17 During 2023-24, the Reserve Bank transferred a surplus of ₹87,416.22 crore to the central government which is higher than both the amount transferred last year (₹30,307.45 crore) and the budgeted amount under Dividend/Surplus transfer of Reserve Bank of India, Nationalised Banks and Financial Institutions in the Union Budget 2023-24 (₹48,000 crore). 18 During April-August 2023-24, the government mobilised ₹5,601 crore in the form of disinvestment receipts as compared with ₹24,560 crore during the corresponding period of the previous year. 19 https://pib.gov.in/PressReleasePage.aspx?PRID=1961016#:~:text=Out%20of%20Gross%20Market%20borrowing,including%20%E2%82%B920%2C000%20crore%20through 20 The data pertains to 21 states. 21 As per the provisional data released by the National Statistical Office (NSO) on October 12, 2023. 22 Average net LAF slipped into deficit mode in September – the first time since May 2019. 23 Overnight money market rates dropped on September 28 reflecting lower borrowing requirement on that day which was earlier a scheduled holiday and cancelled later. To ensure smooth functioning of the financial markets and non-disruptive settlement of transactions especially in view of the quarter / half year end, the RBI decided, in public interest, to keep the Government securities market, foreign exchange market, money market and rupee interest rate derivatives market operational on September 29, 2023 in addition to September 28, 2023. 24 This takes into account the impact of imposition of Incremental CRR (I-CRR). 26 For details see Monetary Policy Report, October 2023. 27 https://dea.gov.in/sites/default/files/RuI_Q3_2324.pdf 28 Worldline. India Digital Payments Report HI 2023. September 27, 2023. 29 https://www.rbi.org.in/Scripts/BS_PressReleaseDisplay.aspx?prid=56503 30 https://www.rbi.org.in/Scripts/BS_PressReleaseDisplay.aspx?prid=56520. |

شارك هذه الصفحة:


بھارت موبائل ایپلی کیشن کے ریزرو بینک کو انسٹال کریں اور تازہ ترین خبروں تک فوری رسائی حاصل کریں!
ہماری ایپ انسٹال کرنے کے لیے QR کوڈ اسکین کریں۔


صفحے پر آخری اپ ڈیٹ:


