
VI. Price Situation - ربی - Reserve Bank of India


VI. Price Situation
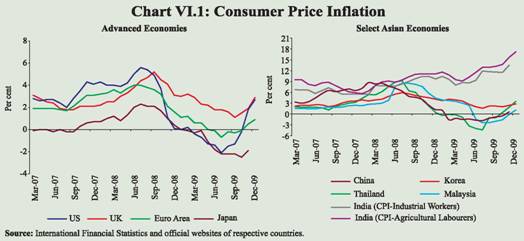
In 2009-10, particularly in recent months, sustained high inflation has been manifested in the form of rising overall WPI inflation, even though a significant number of items exhibited negative or no inflation. The inflationary momentum is clearly visible in terms of the increase in WPI by 8.0 per cent in December 2009 over March 2009 level. The consumer price inflation continues to remain high in double digits, further indicating the existence of price pressures. The risk of high food prices generating inflationary spiral through the expectations channel and thereby causing generalised inflation at some stage remains a major concern for the conduct of monetary policy. VI.1 The year-on-year WPI inflation during 2009-10 has been significantly volatile, and in recent months inflation has firmed up, reflecting the increase in food and fuel prices as well as the impact of the waning of base effect. The WPI inflation was negative during June-August 2009, before turning positive in September and increasing sharply thereafter to 7.3 per cent by December 2009. The emerging inflationary pressures could also be seen from the increase in WPI during the current financial year over end-March 2009 by 8.0 per cent (up to December 2009) and CPI inflation remaining high in the range of 13.5-17.2 per cent in November/December 2009. Though the supply side pressures in a limited number of commodities led by food articles and the partial pass-through of increase in international oil prices have conditioned the inflation momentum so far, the risk of food inflation triggering inflationary expectations to cause generalised inflation remains a potential threat. Global Inflation VI.2 Global inflation, which had abated significantly during the first two quarters of 2009-10, continued to remain subdued during the third quarter, though inflation in most of the major economies turned positive on the back of increasing international commodity prices and stronger signs of global economic recovery. International commodity prices recorded further increases during the third quarter, continuing the firming up from the lows registered in December 2008. The uncertainty over recovery and the presence of significant unutilised capacity, however, have limited the risk of any significant rise in global inflationary pressures in the near term. The central banks, in general, have therefore continued their accommodative monetary policy stance to spur economic growth. In countries like Australia and Israel, however, the risk of potential inflationary pressures has led to the gradual retreat from the accommodative stance. VI.3 During the first two quarters of 2009-10, headline inflation in major advanced economies remained negative on account of the significant contraction in demand. The sharp fall in global commodity prices (fuel, metals and food) during the second half of 2008-09 worked its way to the consumer prices in advanced economies, exerting further downward pressure on inflation. Since September 2009, CPI inflation in most advanced economies recorded increases, yet remained significantly moderate. Most advanced economies, except Japan, registered positive CPI inflation in December 2009 (Table 6.1). The recent increase in inflation in the advanced economies is attributable to the base effect of sharp decline in consumer prices registered a year ago and the recent increases in commodity prices. Year-on-year consumer price inflation in OECD countries, which declined to (-) 0.6 per cent in July 2009 from its peak of 4.9 per cent in July 2008, moved up to 1.3 per cent in November 2009. Amongst the major economies, headline inflation in the US and Euro Area, which had turned negative since March 2009, reversed and have become positive (Chart VI.1). UK also witnessed increase in CPI inflation to 2.9 per cent in December 2009 from 1.1 per cent in September 2009. Core inflation also started to increase in major economies. In OECD countries, excluding food and energy, consumer prices rose by 1.5 per cent in November 2009. Producer price index (PPI) inflation declined sharply, both in the advanced as well as emerging market economies (EMEs). PPI inflation in the OECD countries continued to remain negative (-1.0 per cent in November 2009). VI.4 Concerns over a possible deflationary spiral created by the negative inflation in the US, Japan and the Euro Area during the first half of 2009 have abated with the recent increases in CPI inflation in major economies. On the other hand, inflation risks may be more in emerging economies, where output gaps are smaller and the recovery may be stronger. IMF (October 2009) projects the inflation in advanced economies to be close to zero in 2009, with modest increase to 1 per cent in the following year; inflation in emerging economies is expected to hover around 5 per cent in 2010. In the emerging economies, inflationary pressures have remained subdued during 2009-10, so far, excluding India and Russia (Table 6.1)
VI.5 Most central banks in the advanced economies kept their policy rates unchanged at near zero levels to facilitate the recovery of their economies from recession or significant slowdown in growth. Policy rates in advanced economies, such as the US and Japan, which had reached near zero levels in 2008, were left unchanged during 2009. Policy rate cuts were effected by central banks in other advanced economies such as the U.K., Euro Area and Canada between March-May 2009, with no subsequent changes. As inflationary pressures started to emerge, the Reserve Bank of Australia has increased the policy rate by 50 basis points during 2009-10 so far on the back of signs of economic recovery and improvement in measures of confidence (Table 6.1). Bank of Israel has increased the policy rate by a total of 75 basis points since September 2009. Among the other major central banks, Peoples Bank of China raised the reserve requirement ratio by 50 basis points with effect from January 18, 2010 while Bank of Russia reduced the policy rate by a total of 125 basis points during the third quarter of 2009-10.
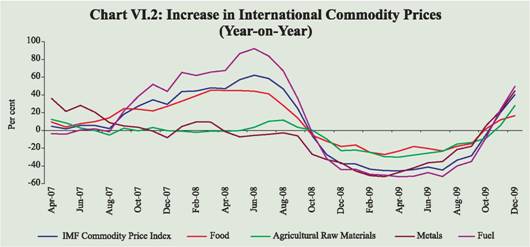
Global Commodity Prices VI.6 International commodity prices have gradually increased during 2009-10, so far, (over March 2009 levels) led by increases in crude oil and food prices (Table 6.2). On a year-on-year basis, most commodity prices, which had exhibited significant negative inflation during the first half of 2009-10, turned positive since November 2009, partly reflecting the base effect of decline in prices last year and the buildup of the commodity price pressures during the current year (Chart VI.2). Economic recovery from the recession in major advanced economies and improved growth prospects in emerging economies along with the weak supply prospects in major agricultural products have been the major drivers of the recent increases in international commodity prices. VI.7 International crude oil prices have gradually firmed up since March 2009, in response to expected global economic recovery and successive production cuts by the Organisation of Petroleum and Exporting Countries (OPEC) to support prices. Crude oil prices increased by about 81 per cent in December 2009 (y-o-y). While crude oil prices declined marginally in September and December 2009, they have been volatile in January 2010, tracking expectations of a recovery in global oil consumption in the face of sustained economic growth in China and signs of a turnaround in other Asian countries. Despite the occasional spurts in recent months, crude oil prices have, in general, remained range bound between US$ 70 and US$ 80 per barrel. According to the US Energy Information Association (EIA), the presence of high oil inventories and expectation of increased supplies by both OPEC and non-OPEC members may prevent any sustained increase in oil prices. EIA forecasts that West Texas Intermediate (WTI) crude spot prices would average about US$ 80 and US$ 84 per barrel in 2010 and 2011, respectively. Although compliance with cuts announced by the OPEC has weakened and global oil inventories and spare production capacity remain very high by historical standards, expectations of a continued global economic turnaround have continued to buttress oil markets.
VI.8 Metal prices also have rebounded since April 2009, led by copper, lead, zinc and nickel. Improvement in global economic prospects has impacted the prices of cyclically sensitive base metals. The increases in prices were due to strong import demand and restocking in China and significant producer cuts. Supply cutbacks in response to the prolonged decline in prices have impacted the prices of certain key metals such as aluminium, tin and zinc. VI.9 Improved supplies, particularly in foodgrains and oilseeds, and unwinding of commodity investments by financial markets participants had eased the pressure on international food prices, and the food prices declined significantly during June 2008 and February 2009. Since then, international food prices have been increasing gradually (except in July 2009). The FAO Food Price Index, a measure of the monthly change in international prices of a food basket composed of cereals, oilseeds, dairy, meat and sugar has been increasing significantly since August 2009, led by all its components. In December 2009, the FAO food price index averaged 172 points, which was 24 per cent higher than the trough in February 2009. The major driver of this increase was sugar, as output in the two major sugar producing countries, i.e., India and Brazil, declined. VI.10 Agricultural raw materials exhibited greater volatility on account of changes in rubber prices, which track the price of crude oil prices. Strong demand and supply disruptions caused by unfavourable weather conditions exerted pressure on rubber price in recent months. Cotton prices also exhibited some firming up on account of strong demand from textile manufacturers in East Asia. Inflation Conditions in India VI.11 The Annual Policy Statement (APS) of the Reserve Bank for the year 2009-10 was announced at a time when the global demand was experiencing significant slump and global commodity prices had fallen to very low levels. Taking into account the decline of WPI inflation to below one per cent by end-March 2009 and the slowdown in economic growth, the APS had emphasised the need to support the revival of economic growth, while ensuring price stability and anchoring inflationary expectations. Accordingly, the policy rates were further reduced by 25 basis points in April 2009 as part of the monetary stimulus measures (Table 6.3). The APS had projected WPI inflation at around 4.0 per cent by end-March 2010, keeping in view, the prevailing global trends in commodity prices and domestic demand-supply balance.
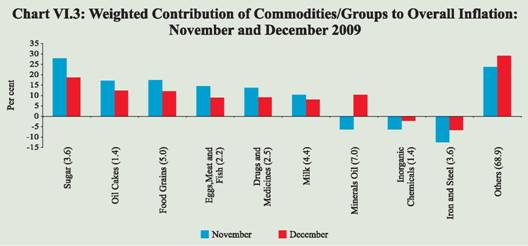
VI.12 The First Quarter Review (FQR) of Monetary Policy 2009-10 (July 2009) was announced against the backdrop of WPI inflation being negative and significant divergence between inflation based on CPIs and WPI. The FQR noted that the negative WPI inflation number in June 2009 was due to the statistical base effect and was not indicative of a contraction of demand. It also observed that the sharp decline in WPI had not brought about a commensurate decline in inflationary expectations. The FQR also stated that the immediate challenge for the Reserve Bank was to manage the balance between the short-term compulsions of providing ample liquidity and the potential build-up of inflationary pressure on the way forward. The FQR, therefore, had revised the WPI inflation projection upward to 5.0 per cent. VI.13 The Second Quarter Review (SQR) of Monetary Policy 2009-10 (October 2009) noted that the upside risk of deficient monsoon projected in the FQR had materialised, exacerbating the price pressures in primary food items and manufactured food products. The inflationary pressures during 2009-10 were seen to be quite different from those witnessed in April-October 2008. Although both inflation episodes were driven by supply side pressures, the inflation in 2008 was triggered largely by a sharp increase in the prices of basic metals and minerals oil. In the current episode, however, price pressures are from domestic sources and concentrated in food articles and food products. The SQR had also noted, in the context of the growing divergence between CPI and WPI based inflation, the need for using all information available on price trends for the conduct of policies. Keeping in view the global trends in commodity prices and the domestic demand-supply balance, the baseline projection for WPI inflation at end-March 2010 was revised upwards to 6.5 per cent with an upside bias. Since the release of SQR, the inflationary pressures have further increased as manifested by the rise in both WPI and CPI based inflation. Wholesale Price Inflation VI.14 After exhibiting significant volatility in 2008-09, WPI inflation in India in 2009-10 remained moderate during April-May 2009 and subsequently turned negative during June-August 2009 on account of the strong base effect of the significant increase in administered prices of petroleum products in June 2008. As the base effect of sharp increases in prices during the first half of 2008-09 waned and price pressures from domestic supply shortages as well as international commodity prices started to emerge, WPI inflation increased significantly and reached 7.3 per cent by December 2009. VI.15 During the current financial year so far, WPI has already increased by 8.0 per cent in December over the March 2009 level. The upward revision of prices of petrol and diesel (effective July 2, 2009), increase in prices of freely priced products under the fuel group in line with hardening of international crude oil prices, and higher prices of sugar, vegetables and drugs and medicines drive the current inflation. Prices of most non-food commodities moved in line with the international commodity prices. Domestic food prices, however, exhibited contrarian movement in relation to the international food prices, sugar being the sole exception (Table 6.4). Indian imports to address the domestic supply constraints, however, entail the risk of transferring price pressures to international markets, particularly in food items like sugar where India is among not only the major producers but also one of the largest consumers. VI.16 The current phase of inflation in India is driven by increases in prices of a few commodities. Sugar, oil cakes, foodgrains, eggs, meat and fish and drugs and medicines, which have a combined weight of 14.8 per cent in overall WPI, explain a significant part of the inflation during the recent months. It may, however, be noted that the contribution of these key drivers has come down in December 2009 as compared with November 2009, indicating early signs of inflation getting generalised (Chart VI.3). Commodities with zero or negative inflation, however, had an aggregate weight of 50.7 per cent in the WPI.
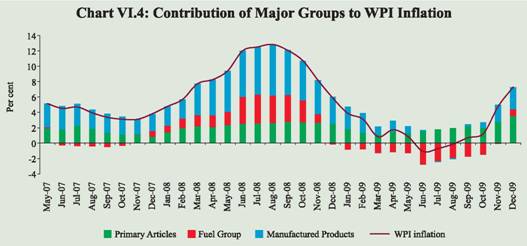
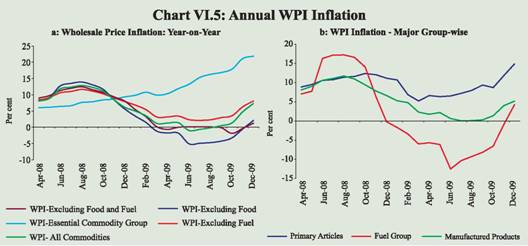
VI.17 In terms of contribution to overall inflation by the major groups, primary articles group continues to drive the overall WPI inflation, besides the manufactured food products. The contribution of non-food manufactured products group, which waned during the declining phase of inflation, has also started to increase in recent months. The contribution of the fuel group, which was significantly negative since January 2009, showed a reversal of trend in recent months and now contributes positively to overall inflation (Chart VI.4). VI.18 The divergent trends in inflation across different groups and sub-groups make the assessment of overall inflationary pressures based on an overall measure of inflation difficult, and an investigation into the different components of inflation becomes necessary for understanding the underlying inflationary pressures. At a disaggregated level, the y-o-y WPI inflation excluding fuel was at 8.1 per cent in December 2009 as compared with 7.9 per cent a year ago. WPI inflation excluding food and fuel, which was negative during 2009-10 up to November 2009 turned positive in December 2009 (1.3 per cent). Prices of essential commodities group increased by 21.9 per cent, y-o-y, in December 2009, driven by food items, particularly sugar, eggs, fish, meat, milk, rice, vegetables and pulses, all of which had recorded double-digit inflation ranging from 54.0 per cent (sugar) to 13.4 per cent (milk) (Chart VI.5a). VI.19 The weekly data release on overall WPI has been discontinued by the Ministry of Commerce and Industry from November 5, 2009 and instead, weekly price indices for primary articles and commodities in ‘fuel, power, light and lubricant’ group are being released. In addition, a monthly WPI for all commodities is being released from November 14, 2009. VI.20 Amongst the major groups, primary articles inflation, y-o-y, increased by 13.9 per cent as on January 9, 2010 (5.2 per cent at end-March 2009), mainly on account of food articles, which registered high double-digit inflation. Non-food primary articles viz., raw cotton and oilseeds prices also increased on a year-on-year basis. Minerals prices, however, registered decline on a year-on-year basis (Table 6.5).
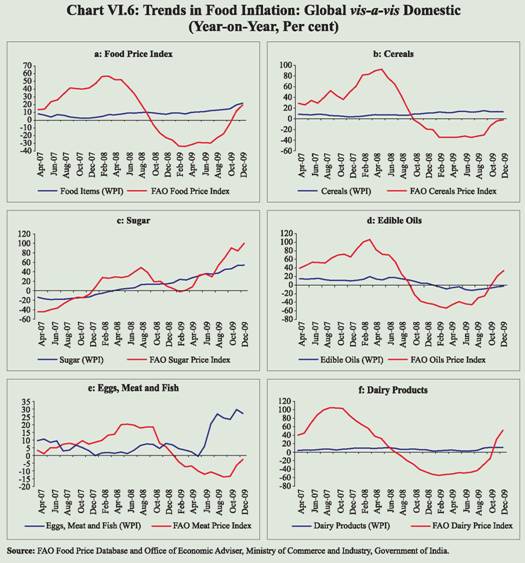
VI.21 Primary articles prices have increased by 14.3 per cent (as on January 9, 2010) over the end-March 2009 level of the index. Vegetables and pulses prices have been the key drivers of the increase in primary food prices during the current financial year, so far. However, some part of the vegetable prices increase could also be attributed to the seasonal hardening of prices during the third quarter, which usually declines during the January-March quarter with the arrival of the winter crop. Pulses, another key driver of inflation, increased on account of the significant reduction in kharif pulses output during 2009-10 (8.3 per cent decline as per the first advance estimates for the year 2009-10). The current rabi sowing, however, indicates an improvement in overall pulses cropping (5.8 per cent increase as on January 15, 2010), which could help in dampening some of the price pressures by the end of the financial year. VI.22 Among non-food articles, prices of raw cotton and oilseeds increased during the current financial year. Raw cotton and oilseeds prices mostly moved in line with the international prices, which increased by more than 25 per cent in the case of oilseeds and by about 38 per cent in the case of cotton since December 2008 when the prices hit the trough. Moreover, oilseeds output is expected to decline by 15.1 per cent for the kharif crop during 2009-10. Cotton output, however, is expected to increase by 2.2 per cent (First Advance Estimates). VI.23 Apart from the efforts to augment domestic supply of food, import of food has also being viewed as an option to contain high food inflation. It may, however, be noted that the recent increases in international food prices have limited the scope of import being a significant option to check price rise. All major food products registered secular increase in inflation during recent months (Chart VI.6). The volatility in international prices of essential food items, however, has been much higher than in India. VI.24 Year-on-year, fuel group inflation, which remained significantly negative since December 2008 on account of the fall in international crude oil prices, turned positive in December 2009 reflecting the base effect of downward revision of administered prices in December 2008. With the Government announcing hikes in administered prices of petrol and diesel effective from July 2, 2009 to partially offset the under recoveries of oil companies arising from increase in international crude prices, fuel price inflation changed course. During the current financial year (up to January 9, 2010), fuel prices have increased by about 9.2 per cent. Prices of various freely priced petroleum products have increased over their levels in end-March 2009 in line with international prices. While increase in the prices of furnace oil was the highest, at 60.2 per cent, that of bitumen was the least at 15.4 per cent. Price increases in other products were 46.8 per cent for aviation turbine fuel, 27.6 per cent for light diesel oil and 52.5 per cent for naphtha. VI.25 Manufactured products inflation, year-on-year, has also increased since August 2009 and was at 5.2 per cent in December 2009 (Table 6.6). The sub-groups under manufactured products, however, showed significant divergence. The movement in manufactured products inflation was largely driven by the manufactured food products, led by sugar. The sugarcane production during 2009-10 is expected to decline by 8.9 per cent (First Advance Estimates) on top of a decline of 21.4 per cent a year ago. On the expectations of India turning a net importer of sugar, international sugar prices also increased significantly, exerting further pressure on domestic prices. The other major contributor to manufactured food inflation was oil cakes (which moved in line with international prices) and dairy products (the prices of which were affected by reduced supplies in the wake of the recent weak monsoon and its impact on animal fodder and increase in prices of oil cakes). VI.26 ‘Basic metals, alloys and products’ sub-group of manufactured products registered negative inflation y-o-y, in December 2009, mainly on account of a decline in the prices of iron and steel. There was, however, marginal increase in the price of steel sheets within the iron and steel sub-group over end-March 2009 level. Prices of iron bar and rods have also increased since September 2009, indicating a revival in construction activity.
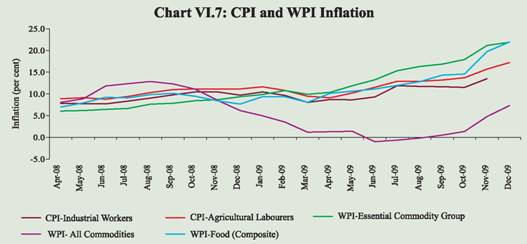
Consumer Price Inflation VI.27 Inflation based on y-o-y variations in consumer price indices (CPIs) have continued to increase during 2009-10 so far, mainly due to increase in the prices of food, fuel and services (represented by the ‘miscellaneous’ group). The various measures of consumer price inflation remained high in the range of 13.5-17.2 per cent during November/December 2009, as compared with 10.4-11.1 per cent in November 2008 and 8.0-9.7 per cent in March 2009 (Table 6.7). VI.28 CPI inflation has been significantly different from the WPI inflation in the recent period and despite the higher increase in WPI inflation, the divergence persists (Chart VI.7). VI.29 Though there has been significant divergence between WPI and CPI inflation, disaggregated analysis points to similar trends in WPI inflation in essential commodities and CPI inflation. The divergence could be attributed to the higher weight of food articles in CPIs, which have displayed higher inflation in recent months.
VI.30 Overall, the WPI inflation in India has shown significant firming up in recent months, with the pressure though coming from primary articles and manufactured food products. The dominance of food prices as the key driver of inflation in recent months indicates a limited role for demand management in effectively curbing the price pressures. Consumer price inflation continues to remain firm and the divergence between CPI and WPI inflation still persists. Unlike the inflation episode of the first half of 2008, when the external supply shocks conditioned the inflation path, the current episode is characterised by dominance of domestic supply side pressures largely emanating from deficient South-West monsoon and its impact on foodgrain production. Persistence of food price inflation over a long period could erode the purchasing power of the public at large who may be compelled to devote larger share of their disposable income to food consumption. Moreover, high food inflation and elevated CPI inflation could potentially generate wage-price spiral and raise inflationary expectations. |
|||||||||||||||||||||||||||||||||||||||||||||||||||||||||||||||||||||||||||||||||||||||||||||||||||||||||||||||||||||||||||||||||||||||||||||||||||||||||||||||||||||||||||||||||||||||||||||||||||||||||||||||||||||||||||||||||||||||||||||||||||||||||||||||||||||||||||||||||||||||||||||||||||||||||||||||||||||||||||||||||||||||||||||||||||||||||||||||||||||||||||||||||||||||||||||||||||||||||||||||||||||||||||||||||||||||||||||||||||||||||||||||||||||||||||||||||||||||||||||||||||||||||||||||||||||||||||||||||||||||||||||||||||||||||||||||||||||||||||||||||||||||||||||||||||||||||||||||||||||||||||||||||||||||||||||||||||||||||||||||||||||||||||||||||||||||||||||||||||||||||||||||||||||||||||||||||||||||||||||||||||||||||||||||||||||||||||||||||||||||||||||||||||||||||||||||||||||||||||||||||||||||||||||||||||||||||||||||||||||||||||||||||||||||||||||||||||||||||||||||||||||||||||||||||||||||||||||||||||||||||||||||||||||||||||||||||||||||||||||||||||||||||||||||||||||||||||||||||||||||

Share this page:


بھارت موبائل ایپلی کیشن کے ریزرو بینک کو انسٹال کریں اور تازہ ترین خبروں تک فوری رسائی حاصل کریں!


