 IST,
IST,


V Growth, Inflation and The Conduct of Monetary Policy
Monetary Policy and Growth
Transmission of Monetary Policy to Growth
The Credit Channel
The Constraints on Growth-Oriented Monetary Policy
Concluding Observations
Introduction
5.1 The conduct of monetary policy has been engaging considerable attention in the context of the current slowdown in the Indian economy. From financial markets and industry, the case for easy monetary policy has been expressed in terms of lower interest rates. With the upturn remaining elusive, an intellectual advocacy for monetary activism via monetisation of the fiscal deficit has been gaining ground. It is argued that neither credit nor commodity markets in India are supply-constrained and monetisation of the fiscal deficit does not cause inflationary pressures when the economy is demand-constrained (Patnaik, 2001). It is also pointed out that maximising seigniorage revenues may, in fact, be optimal in a situation where the budget constraint is hard (Rakshit, 2000). The revival of the call for monetary activism in India via the fiscal deficit is not new; indeed, it characterised the debate in the mid-1990s on some unpleasant monetarist arithmetic (Venkitaramanan, 1995) and why gentlemen prefer bonds (Moorthy, 1995). Against the welling tide of arguments for monetary easing, it is important to take note of a near solitary view that interest rate reductions in India have gone too far and it is necessary to recognise the country's specific vulnerabilities while formulating monetary policy response (Tarapore, 2001). The debate remains unsettled, and it is plausible that as the economy continues to be bound by the inertial dynamics of the downturn, more heat would be generated.
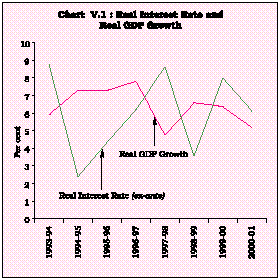
5.2 The argument for monetary easing is valid to the extent that monetary policy is essentially viewed as an instrument of stabilisation, working through aggregate demand to smooth oscillations of economic activity around the desired path. In accommodation of this perceived role, monetary policy in India has moved into contra-cyclical mode since 1997 with successive cuts in key interest rates and cash reserve requirements (CRR) signalling the monetary stance. Active liquidity operations have been undertaken to satisfy and stabilise the demand for bank reserves so as to ensure that growth is not constrained by the availability of credit. Reflecting this stance, nominal risk-free interest rates measured by yields on government securities are the lowest in the last two decades and real interest rates in the recent period, on an average, have been below the real growth rate of the economy (Chart V.1).
|
5.3 This Chapter attempts to contribute to the debate eclectically, within the limits of an empirical and country-specific framework. The structure of the Chapter is as follows: Section I addresses the unfinished debate on neutrality and the role of monetary policy in the context of growth. Section II deals with the transmission of monetary policy to growth. Section III examines the macroeconomics of credit with a view to assessing the credit channel as a conduit of transmission of monetary policy. Section IV covers the constraints on operating monetary policy for revitalising growth. It covers issues related to the time inconsistency problem associated with a growth oriented monetary policy and the institutional arrangements under which the implicit ‘inflation bias’ in growth-centric monetary policy is minimised. This is followed by concluding observations.
5.4 For monetary policy to be effective in supporting the revival, it must exert a systematic influence on economic activity, i.e., output, employment, real interest rates and real exchange rates. Thus, the question of what monetary policy can or cannot do in the context of the deceleration is inextricably linked to the debate on the issue of neutrality of money, i.e., whether or not monetary policy has any lasting influence on the real economy. The debate itself has dominated economic thinking in the 20th century - does money matter (non-neutral) or not (neutral). The swings in the paradigm across the spectrum of the debate have been a powerful force in shaping the stance and conduct of monetary policy.
The Neutrality Debate Revisited
5.5 The classical view of a dichotomy between the real and nominal worlds, and thereby, of monetary policy being neutral, was co-terminus with the view of the economy as self-correcting, inherently prone to revert to equilibrium and full employment. Accordingly, money had no influence on real variables in the long run; changes in money supply caused a proportionate change in the price level via the quantity theory. The Great Depression of 1929 and the growing dominance of Keynesianism in its aftermath swung the debate in favour of non-neutrality. Policy makers were confronted with the clear danger of the economy slipping further and further away into depression. Consequently, interventions had to be made in the form of monetary and fiscal policies to prevent and correct macroeconomic failures.
5.6 Until the 1950s, monetary policy was subordinated to fiscal policy. Expansionary fiscal policy supplemented by the discretionary financing of fiscal deficits by monetary policy, while keeping interest rates low in order to stimulate investment was the preferred combination. In the 1960s, influential work on the US economy showed that peaks and troughs of money supply changes systematically preceded the peaks and troughs of economic activity, leading up to the premise that monetary policy has powerful effects on real variables in the short run (Friedman and Schwartz, 1963). Accordingly, the debate produced a transient synthesis during the 1960s and the 1970s within the dominance of the Keynesian paradigm. Money began to matter and central banks began to employ monetary policy to reduce fluctuations in real variables. Several developed countries including the USA, Canada and Britain pursued expansionary monetary policies and experienced healthy increases in output and reduction in unemployment rates (Handa, 2000).
5.7 Although the period 1940-71 was characterised by fixed exchange rates under the Bretton Woods par value system, most countries sought to have some discretion in the conduct of monetary policy. Many countries, both developed and developing, established exchange controls and revenue was extracted through financial repression and seigniorage. The fiscal domination of monetary policy set up an inconsistency with the exchange rate objective, and when the USA suspended the convertibility of the US dollar in 1971-73, the end of an era was in sight. Monetary policy had lost its nominal anchor. The massive oil price hike of 1973 stepped up global inflation and worsened the situation. Inflation in the industrial countries rose from low levels in the 1950s and the 1960s to double digit levels. At the same time, unemployment rates remained persistently high; the phenomenon of 'stagflation' was incompatible with the standard Keynesian analysis and the latter's abandonment in the design of policy frameworks seemed imminent.
5.8 The stagflation of the 1970s fuelled scepticism about the beneficial effects of expansionary monetary policy. The counterrevolution was led by Milton Friedman, the keeper of the 'living tradition' of the classical faith (Colander, 1986). Persistent inflation was found to be largely or solely the result of excessive monetary growth. Augmenting the Phillips curve with expectations showed that the trade-off between unemployment (growth) and inflation could possibly exist in the short run; in the long run, however, there was no trade-off. Furthermore, it was argued that long and variable lags in the operation of monetary policy can destabilise the impact of counter-cyclical monetary policy and accordingly the desired short-run impact was virtually unpredictable. Indeed, short-run discretionary monetary policy was rendered dangerous by forecast errors - expansionary monetary policy to fight a downturn can take effect when the economy is booming. All this led to the advocacy for resisting the temptation to exploit the possible short-run trade-off and to set up a rigid rule fixing the growth rate of money stock to the trend growth rate of output. Backed by the predictive model of the Federal Reserve Bank of St. Louis (1968), money began to matter in influencing output and employment, although its potentially destabilising effects were emphasised and long-run neutrality regained prominence in shaping the contours of monetary policy.
5.9 The first half of the 1970s was thus characterised by a considerable amount of uncertainty regarding the conduct of monetary policy. 'Policy ineffectiveness' raised questions regarding the ability of policy makers to 'fine tune' the economy. The operational design of monetary policy was marked by an increasing recourse to credit rationing. The introduction of floating exchange rates, however, did not provide the independence for monetary policy to pursue domestic objectives. External viability remained as a dominant concern of monetary policy right through the 1980s.
5.10 In the second half of the 1970s and up to the mid-1980s, monetary targeting became the raison d’etre of the conduct of monetary policy. Empirical investigation turned out systematic evidence of stability in the money demand function (or the LM curve) which strengthened the case for using monetary aggregates as the intermediate target since changes in money supply could be traced to predictable changes in prices, interest rates and income. Money supply rules were also seen as a means of securing freedom for monetary policy from fiscal domination by eschewing discretionary actions. Germany, Switzerland and the USA were amongst the first to adopt monetary targets in the operating framework of monetary policy in 1975, followed by Canada in 1976, and France and Australia in 1977 (Argy et al, 1989). Beginning in 1978 and well into the 1980s, many developing countries also adopted various formulations of the money rule.
5.11 During this period, the institutional setting for monetary policy, however, underwent radical changes. Globalisation and financial sector reforms and the explosion of financial innovations had a fundamental impact on the stability of the money demand function, both in the parametric and in the predictive senses. As a consequence, there was a breakdown in the observed relationship between monetary aggregates, the inflation rate and the real activity. In part, this reflected the operation of Goodhart's law: any observed statistical regularity will tend to collapse once pressure is placed on it for control purpose. Incorporating rational expectations and market clearing into macro-economic analysis produced theoretical conclusions which questioned Keynesian and 'synthesis' propositions (Muth, 1961; Phelps, 1967; Lucas, 1972). Under these conditions, discretionary policies, both fiscal and monetary, are ineffective in influencing real variables as people anticipate policy changes and respond in a manner which renders policy changes sterile. This triggered a 'new classical' renewal of the classical money neutrality hypothesis although new Keynesians produced non-neutral effects of monetary policy even with rational agents on account of the existence of rigidities in the system (Box V.1). The impact of this shift in the paradigm in the debate on money neutrality brought about a fundamental revision in the conduct of monetary policy in the 1980s. In the 1980s, several countries either modified the operating framework of monetary policy to a monetary-cum-output targeting approach or abandoned monetary targeting altogether. Germany and Switzerland persevered with monetary targeting, although in a significantly modified form of the monetary rule. In view of these developments, the European Central Bank (ECB) follows two pillar-framework of monetary policy, with reference values of money supply being only one of the pillars.
Neutrality of Money: Theoretical Perspective
Neutrality is defined as a once-for-all change in the level of nominal money producing no real effects, i.e., not affecting real variables including real balances (like capital, output or real income, welfare, mix of consumption and investment goods, real interest rates, real exchange rates) permanently. A permanent shift or continuous changes in money supply not affecting the real variables is known as super neutrality. The so-called 'quantity theory of money' - strictly proportional (positive) relation between money and prices is viewed as a special case of neutrality. Similarly, the classical case of dichotomy - the equilibrium value of real variables are independent of both the supply of and demand for money - implies neutrality. As pointed out in the literature, money neutrality holds under the following assumptions -no money illusion, absence of inflationary expectations, full wage-price flexibility, dependence of marginal product of capital only on the capital intensity, no distributional effects of seigniorage and time independence of saving and consumption behaviour (i.e., independent of the stage of the life cycle).
However, the neutrality debate has also taken a time dimension as there is more or less general agreement among the competing schools of thought regarding short-run non-neutrality and long-run neutrality. In the short run, even monetarists (Quantity Theorists) believe that money is non-neutral like Hume's argument that prices do not immediately rise proportionately with increased money and that, in the intervening period, it stimulates production. Non-neutrality holds on account of a number of reasons: redistribution of real income due to rising prices between debtors and creditors with different saving propensities (forced savings); no one to one and lagged response of individual prices (wage-price rigidities) to money growth rate; disequilibrium or under employment equilibrium state of the economy; the existence of a tax structure (income and capital gains tax) formulated in nominal terms and partial adjustment to the rate of inflation; and the inability on the part of individual to judge whether the change in price is with respect to the goods he is concerned with (in which case there is change in relative prices warranting quantity adjustment) or a change in the general price level (in which case there is no change in relative prices). Therefore, it is argued that only unanticipated monetary changes produce real effects, with predicted changes in money simply being reflected in price-level movements with no impact on output. Since short-run fluctuations in money are likely to be at least partially unpredictable, they will cause output and employment movements. Subsequent work by Mishkin (1982) and others showed that both anticipated and unanticipated money appear to influence real economic activity. Thus, the balance of opinion is in favour of short-run non-neutrality of money, of both anticipated and unanticipated nature.
Even with rational expectation, money can have real effects on the economy in the presence of rigidities or price stickiness. A distinctive feature of the ‘new Keynesian’ view is the notion that considerable economic rigidities can be generated even by small barriers to nominal price flexibility. Such price rigidities may arise due to the prevalence of longer-term wage contracts, the presence of imperfect competition, the costs of price adjustment (menu cost) and the persistence of co-ordination failures in the related markets.
Friedman and Schwartz's (1963) study of the relationship between money and business cycles probably still represents the most influential empirical evidence that money does matter for business cycle fluctuations. On the other hand, Tobin argued that the positive correlation between money and output that Friedman and Schwartz interpreted as providing evidence that money caused output movements, could, in fact, reflect just the opposite - output causing money. It has also been argued that correlation may arise from the endogenous response of the banking sector to economic disturbances that are not the result of monetary policy actions. More recently, based on equilibrium models with endogenous money, it has been pointed out that money should be more highly correlated with lagged output than with future output. The endogeneity problem is likely to be more severe if the monetary authority employs a short-term interest rate as its main policy instrument; in such a case, changes in money supply will be endogenous and cannot be interpreted as representing policy actions.
References:
Friedman, M. and Anna J. Schwartz (1963), 'Money and Business Cycles', Review of Economics and Statistics 45 (1).
Lucas, R.E. Jr. (1996), 'Nobel Lecture: Monetary Neutrality', Journal of Political Economy 104, No. 4 (August).
Mankiw, N. G. and D. Romer (1991), New Keynesian Economics: Imperfect Competition and Sticky Prices, Vol. I, MIT Press.
Mishkin, F.S. (1982), 'Does Anticipated Monetary Policy Matter? An Econometric Investigation', Journal of Political Economy 90 (February).
Monetary Policy in Transition
5.12 In the period since the latter half of the 1980s, central banks all over the world are experimenting with a variety of operating instruments and analytics with a broad preference for indirect instruments and a market orientation of monetary policy. In recent years, particularly in the 1990s, there has been an upsurge of interest in the operational framework for monetary policy. Beginning in 1989, a number of countries have put in place institutional settings for directly achieving the primary target of monetary policy - inflation.
Essentially inflation targeting relies on the use of simple and explicit rules for monetary policy. While inflation targeting has been characterised alternatively as 'constrained discretion' and 'the interest rate analog of a money growth rule', it has opened up a number of dilemmas for practitioners of monetary policy, i.e., the lack of complete integration into economic theory, the neutrality hypothesis and the relationship between growth and inflation, what to target - a precise number or a range, the trade-off between the exchange rate and inflation and the transmission channels from the instrument to the target.
5.13 The debate on the neutrality of money remains unsettled. The central opposing views have modified their positions and moved closer. Monetarists, for instance, have toned down their argument regarding the Phillips curve being vertical in the long run. Keynesians concede that if a long run trade-off exists, it is limited and the scope for long run policy activism is small. In the interregnum, monetary policy and its operational framework transit through a twilight zone.
Some Practitioner Perspectives on the Debate
5.14 In the economics profession, the impact of monetary policy on output, employment and prices has always been recognised. Recent empirical research developing on the 'narrative approach' of Friedman and Schwartz suggests that negative monetary shocks are followed by marked downturns in real economic activity that cannot be predicted from the past behaviour of the economy (Romer and Romer, 1989, 1994a). Furthermore, real effects of the monetary shocks are not only substantial but also long-lived (though not permanent) with the effects remaining up to 3 years. It is found that the Federal Reserve recognises quickly that recessions are underway and typically responds to downturns with prompt and large reduction in interest rates. Discretionary fiscal policy, in contrast, rarely reacts before the trough in economic activity and even then the responses are usually small reflecting inside lags (Romer and Romer, 1994 b). Monetary policy shocks have a persistent effect on output, while inflation displays an inertial response (Christiano et al, 2001). The Bank of England's macro-model shows that a temporary increase (increased for one year and then reversed) of interest rates by 100 basis points lowers output by around 0.20-0.35 per cent after about a year, while it reduces inflation by around 20-40 basis points after a year or so.
5.15 Growing recognition of the powerful effects of monetary policy on the real economy explains as to why societies have reposed the conduct of monetary policy with central banks/monetary authorities. In the dispensation of this responsibility, central banks have to take positions on the short run trade-off between growth and inflation; the choice is severely conditioned by the losses of macroeconomic welfare that can result in an inappropriate position occupied in the growth-inflation curve. The conduct of discretionary monetary policy, especially since the 1970s, is centred around the choice of a rate of inflation for the national economy consistent with the choice of a rate of growth. In developing countries, the dilemma becomes sharper, especially with the conviction that there are segments in the growth-inflation curve in which some inflation is beneficial for growth. In recent years, monetary authorities have increasingly come out of the closet to reflect growth considerations, both explicitly and implicitly, in their objective functions. Even in countries which have adopted inflation targets as the goal of monetary policy, output considerations (reflected in the deviations of output from target growth) are explicitly incorporated in their monetary policy frameworks (Table 5.1). In 2000 and 2001, the process has come full circle with the Federal Reserve almost single-handedly undertaking the task of soft-landing the US economy and revitalising growth. Increasingly, monetary policy is viewed as an integral element of macroeconomic policies for growth and stability.
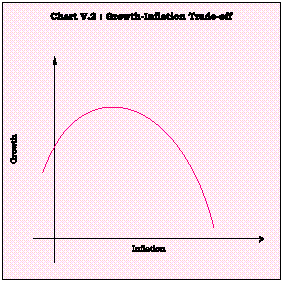
5.16 At the operational level, there is also a recognition that the growth-inflation curve has non-linear segments, i.e., inflation at some low level has positive effects for growth by 'greasing the wheels' of the economy, but there is a point beyond which inflation can be harmful for growth (Chart V.2). Multiplicity of objectives entails assignment of degrees of importance, depending on the hierarchy of macroeconomic priorities. Consequently, the weights set for growth and inflation by the monetary authority must reflect an understanding of the functioning of the economy.
|
The International Evidence
5.17 A proximate starting point to the resolution of the dilemma is the identification of the threshold (optimal, tolerable) level of inflation beyond which it has negative effects on growth. Empirical investigation of the location of the threshold have proliferated in the literature since the 1970s. Early efforts were based on estimating Phillips curve type relationships with high frequency data (Fischer, 1983). Subsequently, the threshold inflation was estimated under growth accounting frameworks. The empirical evidence produced in the second half of the 1990s suggests that there exists a significant and negative correlation between high inflation and growth. Inflation volatility is robustly and negatively correlated with growth variability at high levels of inflation. The threshold rate of inflation in industrial countries is placed in the range of 1-3 per cent (Fischer, 1996).
Central Bank | Single | Multiple | Objectives | |
Target | Target | |||
Argentina | 4 | Value of currency and financial system stability. | ||
Australia | 4 | Price stability over the medium-term with the aim of | ||
encourging strong and sustainable economic growth. | ||||
Canada | 4 | Inflation taget to contribute to rising living standards. | ||
Chile | 4 | Low and stable inflation contributing to | welfare. | |
European Central Bank | 4 | Price stability. | ||
Indonesia | 4 | Price stability and exchange rate stability. | ||
Israel | 4 | Inflation target. | ||
Japan | 4 | Price stability and financial stability as foundations | ||
for sound economic development. | ||||
Malaysia | 4 | Monetary and financial stability for growth. | ||
Mexico | 4 | Maintaining stability of the purchasing power of | ||
currency, sound development of financial system and | ||||
proper functioning of payment systems. | ||||
New Zealand | 4 | Price stability. | ||
Pakistan | 4 | Economic growth and price stability. | ||
Russia | 4 | Stability of the currency, development of banking | ||
system and efficient settlement system. | ||||
Singapore | 4 | Sustained and non-inflationary growth and sound and | ||
progressive financial services sector. | ||||
South Africa | 4 | Value of currency, achievement and maintenance of | ||
financial stability. | ||||
South Korea | 4 | Price Stability. | ||
Thailand | 4 | Monetary and financial stability for achieving | ||
sustainable economic growth over the long run. | ||||
U.K. | 4 | Inflation target as a precondition for achieving | ||
sustainable growth and employment. | ||||
USA | 4 | Maximum employment, stable prices and moderate long | ||
term interest rates. | ||||
At the same time there is a strong argument against zero inflation (Akerlof et al, 1996). Resistance to nominal wage cuts brings with it rigidity in real wages and some inflation is necessary to allow real wages to adjust. This has been expressed as a case against price stability and inflation at 3-4 per cent has been suggested as a long run target (Krugman, 1996). Several recent studies incorporating developing countries, including India, have empirically located threshold inflation rates in the range of 8 per cent (Sarel, 1996) to 40 per cent (Bruno and Easterly, 1995). The range is relatively wide for samples including developing countries since measured productivity in the traded sectors in these countries is generally higher than in the non-traded sectors. Measuring threshold inflation in a cross-country framework runs the risk of being influenced by extreme values since samples include countries with inflation as low as 1 per cent and as high as 200 per cent and even higher. The appropriate inflation threshold, therefore, needs to be estimated for each country separately (Rangarajan, 1997).
The Indian Evidence
5.18 In the 1970s, although there was considerable concern about inflation in the face of oil price hikes and agricultural supply shocks, there was a lack of consensus about the tolerable rate of inflation (Singh, Shetty and Venkatachalam, 1982). The reference of the Chakravarty Committee to 4 per cent as the acceptable rise in prices can be regarded as the first influential fix on the threshold rate of inflation in India. Testing for the threshold within the framework of a macroeconometric model suggested a range of 5 to 7 per cent, initially 6-7 per cent and eventually 5 to 6 per cent (Rangarajan, 1997). Employing a variety of methodologies, studies conducted in the Indian context obtain a range from 4 to 7 percent for the threshold inflation rate. The lower bound of 4 per cent may be regarded as output-neutral inflation rate with the positive effects of inflation petering off after 7 per cent. At an inflation rate of 10 per cent, inflation has adverse consequences for growth. There is not much empirical support for the trade-off between the anticipated rate of inflation and output growth although the adverse effects of inflation surprises on output growth are robustly confirmed. A recent study suggests that for inflation of up to 6.5 per cent, the growth objective of monetary policy can take precedence over the price stability objective. However, once the inflation level reaches 6.5 per cent, price stability objective should be given greater relative importance (Samantaraya and Prasad, 2001). With prolonged price stability at the global level as well as in India, the threshold can be expected to move downwards.
Estimating the Precise Threshold Inflation for India
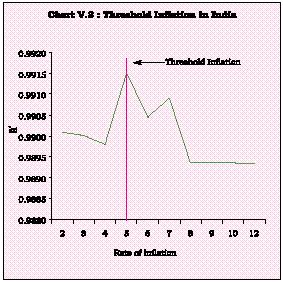
5.19 The various empirical studies conducted for estimating the threshold inflation for India show that the results are sensitive to the methodology, the period of study and the choice of plausible factors determining growth or 'conditioning' variables. There is no consensus on the specification of the appropriate model for estimating the growth-inflation relationship, perhaps because the relationship itself is changing fairly rapidly. Accordingly, updating the estimate of the threshold inflation to take into account these underlying shifts assumes importance. Obviously, in this exercise, feasible computation takes precedence over analytical finesse. In this section, the methodology adopted by Sarel (1996) is employed to estimate the threshold inflation in India as a point estimate as opposed to the range estimates. The Sarel 'spline' technique is intuitively appealing as it specifically incorporates non-linearity in the inflation and growth relationship. It employs a search procedure to identify the structural break or 'kink' in the growth-inflation curve. This yields a unique estimate of threshold inflation. The threshold inflation in this study is estimated under a production function framework where real output is regressed on capital, labour, actual inflation rates and inflation dummies characterising alternate inflation regimes by using the Sarel methodology - which derives the threshold level corresponding to the maximum fit of the model represented by the value of the adjusted R2. Based on this, threshold inflation for India estimated for the period 1970-71 to 1999-2000 is 5 per cent (Chart V.3 and Table 5.2).
|
Study | Year | Period | Estimated |
of Study | of Study | Threshold | |
Inflation | |||
(per cent) | |||
1 | 2 | 3 | 4 |
Rangarajan | 1998 | - | 5-7 |
Kannan and Joshi | 1998 | 1981-96 | 6.0 |
Vasudevan, Bhoi and Dhal | 1998 | 1961-98 | 5-7 |
Samantaraya and Prasad | 2001 | 1970-99 | 6.5 |
Estimate of the Chapter | 2001 | 1970-2000 | 5.0 |
II. TRANSMISSION OF MONETARY POLICY TO GROWTH
The Role of Interest Rates
5.20 The impact of monetary policy on the economy has been viewed by some as powerful and lasting. Monetary policy impulses travel to output, employment and inflation through a number of channels. While these channels are not mutually exclusive, the relative importance of each channel may differ from one economy to another depending on a number of factors including the underlying structural characteristics, state of development of financial markets, the instruments available to monetary policy, the fiscal stance and the degree of openness. Broadly, the vehicles of monetary transmission can be classified into financial market prices (e.g., interest rates, exchange rates, yields, asset prices, equity prices) or financial market quantities (money supply, credit aggregates, supply of government bonds and foreign denominated assets). The interest rate channel emerges as the dominant transmission mechanism of monetary policy. It induces movements in other asset prices to generate wealth effects, in terms of market valuations of financial assets and liabilities, like through exchange rates - higher interest rates induce an appreciation of the domestic currency which, in turn, leads to a reduction in net exports and, hence, in aggregate demand and output. Monetary policy can also operate on aggregate demand through changes in the availability of loanable funds, i.e., the credit channel. It is, however, relevant to note that 'credit channel' is not a distinct, free-standing alternative to the traditional transmission mechanism but rather as a set of factors that amplify and propagate conventional interest rate effects (Bernanke and Gertler, 1995). Nevertheless, it is fair to regard the credit channel as running alongside the interest rate channel to produce monetary effects on real activity. The credit channel is the subject of the next section.
Real Interest Rates
5.21 The real interest rate assumes critical importance in the transmission of monetary policy to growth. The real interest rate is not 'real' in the sense that, unlike nominal rates, it is not directly observed. Consequently, monetary authorities are constrained to take a 'view' on the real interest rate to ensure the efficacy of policy intervention. The classical view of the real interest rate being determined by the real forces of saving (thrift) and investment (productivity) and unaffected by nominal variables such as monetary growth or inflation does not fit well with the operational conduct of monetary policy. In the short-run, given wage and price rigidities, monetary factors can influence real interest rates and even in the long-run, variations in the rate of monetary growth can have effects on real interest rates through Tobin-Mundell portfolio effects. Similarly, the Keynesian treatment of the interest rate as being purely a monetary phenomenon determined in the money market has to be regarded as only a partial explanation of the determination of interest rates. The concept of a 'neutral rate of interest' - a rate consistent with the stock and flow equilibrium of households and firms (savers and investors) at the natural rate of growth of the economy - reconciles the two approaches within the academic debate (Allssopp and Glyn, 1999). The synthesis identifies a host of real and monetary factors - savings, investment, technology and other preference shocks, stance of fiscal policy (size of public debt coupled with the absence/presence of Ricardian equivalence), the stance of monetary policy and its interventions, credit restraints, the efficiency of the financial system, the degree of financial liberalisation - as determinants of real interest rates in a general equilibrium framework.
5.22 There is a growing recognition that there is no unique fundamental equilibrium real long-term interest rate. Empirical evidence for the US, the UK, France and Germany suggests that the real interest rates increased from 1980s onwards over the levels prevailing during the 1950s and 1960s (Chadha and Dimsdale, 1999). The low real interest rates during the 1950s and 1960s reflected the greater policy weightage assigned to output expansion. The surge in real rates from 1980s onwards reflected tighter monetary policy to contain inflation. The response of short-term nominal interest rates to inflation has improved in the recent years -in other words, variability of real interest rates has declined - reflecting greater policy focus by the monetary authorities on inflation control. Higher real interest rates since the 1980s also reflected a looser fiscal policy stance (Ford and Laxton, 1999) and an overall tendency towards deregulation of financial markets.
Real Interest Rates in India
5.23 The issue of the appropriate real interest rates for India has acquired a growing focus with the shift away from a planned economy to a market-determined economy in the context of financial sector reforms (Reddy, 1998). An important early input in this regard was the Report of the Committee to Review the Working of the Monetary System (RBI, 1985). Recognising that the depositor needs to be assured of a 'reasonably high positive real rate of interest' on savings to deter 'leakages' of financial saving in the form of gold, real estate and physical assets, it recommended a real positive interest rate of up to 3 per cent depending upon maturity, issuer and instrument: marginally positive real return on 91-day Treasury Bills, a positive real return of 2 per cent per annum for bank deposits of maturity of 5 years or more and a positive real return of 3 per cent per annum on 15-year government dated securities. There is also an influential view that the optimum real interest should be closer to the expected long-term growth rate of the economy; hence, for an economy, like India, growing at 6-8 per cent per annum, the optimum real rate would be higher than that for an economy growing at 2-3 per cent (Brahmananda, 2000).
Measuring Real Interest Rates
5.24 The principal wedge between real and nominal interest rates is inflation expectations. In practice, the real interest rate is typically measured as inflation adjusted nominal interest rates but this is an ex-post assessment of how inflation has eroded the returns on investment in some past period. To obtain a forward-looking ex-ante measure, the real interest rate may be defined as nominal interest rate less inflationary expectations. An important aspect in this context is the time horizon. Very short-term official interest rates set by government and overnight inter-bank interest rates are in a sense reflective of the real interest rates since over such horizons, prices are essentially constant (except episodes of hyperinflation).
5.25 Accordingly, the first step towards obtaining a forward-looking view of the real interest rate is to estimate inflation expectations. A variety of approaches has been employed to model inflation expectations, like collecting information on people's attitudes about the inflation outlook through surveys, observing differences in yields of nominal and indexed bonds, and drawing inferences from macroeconomic data. Inflation expectations could alternately be modelled through time-series based on econometric approaches. The real interest rate calculated by adjusting the representative nominal interest rate for inflation expectations would diverge from an ex-post measure depending upon the volatility of the inflation rate in the past. Movements in ex-ante real interest rates - nominal interest rates less inflationary expectations with inflationary expectations obtained from estimates of the aggregate supply curve estimated below -are reflected in Charts V.1 and V.4.
|
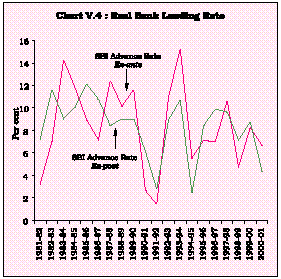
5.26 The ex-post real interest rates (SBI Advance Rate less actual inflation) have remained high in the recent period (1995-2000), averaging around 8.7 per cent as against the average real growth rate of 6.6 per cent. On the other hand, ex-ante real interest rates (SBI advance rate less inflation expectations) averaged 7.5 per cent, lower than the ex-post rates over the same period. Real interest rates in India imbibe some of the rigidities characterising nominal interest rates: (i) household preferences for fixed rate deposits reduces the banks' flexibility to reduce interest rates in the short-run; (ii) relatively high-level of non-performing assets coupled with high non-operating costs imparts a stickiness to banks' lending rates; (iii) persistent and large volume of market borrowing requirements of the Government; and (iv) structure of administered rates on small savings. It is in the context of (iv) that the Report of the Expert Committee to Review the System of Administered Interest Rates and Other Related Issues (Chairman : Dr. Y.V. Reddy) (RBI, 2001) recommended that the interest rates on small savings and other administered instruments of various maturities be benchmarked, with a spread of a maximum of 50 basis points and with an objective to reduce the spread over a period to the secondary market yields of various government securities of corresponding maturities. Provident funds could be offered only on a floating rate basis, while for all other small savings, an option of fixed versus floating rates may be provided at the time of entry.
Nominal Interest Rates
5.27 In the 1980s, with the erosion of the stability of money demand and the explanatory power of monetary aggregates on account of financial innovations, globalisation and the growing sophistication of financial markets, monetary authorities have increasingly resorted to interest rates, to the almost complete exclusion of monetary or reserve aggregates, both as sources of information for determining policy as well as operating instruments for conducting monetary policy. The main operating instrument for most central banks today is a short-term interest rate. Markets are the deepest in the short-end, allowing central banks to intervene in support of policy objectives without generating serious repercussions on market activity. Moreover, impulses from the short-end are transmitted relatively quickly across the term structure of interest rates and this makes for efficiency in intervention. The recent experience has shown that central banks have been proactively moving target interest rates in support of output/employment and financial stability considerations, even if this has meant a temporary departure from their commitment to price stability. A contractionary monetary policy is reflected in an increase in the nominal short-term interest rate. As wages and prices take time to adjust to the interest rate change, the higher nominal interest rates translate into higher real short-term as well as long-term interest rates which dampen investment and consumption leading to a fall in aggregate demand and contraction in output. Over a period of time, as wages and commodity prices begin to adjust, aggregate demand is restored and real activity, the real interest rate and the real exchange rate return to their fundamental levels. In consensus models underlying the reactions of monetary authorities under constrained discretion, the relationships of short-term (policy) interest rates and output via the real interest rate have come to be regarded as almost axiomatic: raise interest rates today and, given the lags in the operation of monetary policy, output (and inflation) contracts say 8-16 months hence. The key issue in this context is the sensitivity of consumption and investment to movements in the interest rates.
5.28 In India, interest rates as an instrument of monetary policy, were activated in the 1990s. With the financial sector reforms, the monetary management has been increasingly relying upon the use of indirect instruments like interest rates and open market operations including repos. During the pre-reform period, the Bank Rate had a limited role as a monetary policy instrument. It was activated and made as a signaling and reference rate in April 1997 linking it to rates at which accommodation is provided by the Reserve Bank. Changes in the Bank Rate are also seen as an integral part of the monetary policy stance of the Reserve Bank announced from time to time and provide a direction to general level of interest rates in the system. As such, the importance of the Bank Rate which influences cost and availability of credit in the economy has increased.
5.29 Along with the Bank Rate, the open market operations of the Reserve Bank have also been actively used. With the Reserve Bank’s stance to move away from the sector-specific refinance schemes, the liquidity in the system is managed increasingly through the liquidity adjustment facility (LAF), which was introduced in June 2000. The operating procedures of the LAF including auction methods and periods are being refined periodically to make it more efficient. With a strategy for a smooth transition of call money market into a pure inter-bank market, the liquidity support available from the Reserve Bank has been rationalised. As such, the repo and reverse repo rates emerging from the LAF auctions essentially reflect the market conditions of availability of liquidity in the system along with the rate at which the liquidity is available from the Reserve Bank. The LAF injects/absorbs liquidity on a day-today basis in a flexible manner and in the process provides a corridor for the call money and other short-term interest rates. During the last decade, deposit interest rate structure in India has been, by and large, deregulated except the savings deposits rate, which is currently prescribed by the Reserve Bank. Commercial banks have been given virtual freedom to determine their lending rates. The interest rates, particularly at the short-end of the market, are more aligned and integrated. The economic agents are currently responding to changes in the interest rates. Nevertheless, there are quite a few rigidities in the structure of interest rates.
5.30 The Report of the Working Group on Money Supply (RBI, 1998b) found a positive impact of expansionary monetary policy on output, both through reduced interest rates and increased credit. A comparative assessment indicated that the output response operating through the interest rate channel was stronger and more persistent than that of the credit channel. Similar findings are reported from a comparison of monetary impulses transmitted through interest rate effects with that through liquidity effects for the period 1961-2000. The interest rate emerges as a significant factor explaining the variation in real activity in the 1990s as compared with a negligible impact in the 1980s (Dhal, 2000).
5.31 Thus, variations in short-term nominal interest rates by the monetary authority do have real effects in the short- and medium-term. However, the possibility of inflation bias - dynamic inconsistency - arising out of the policy discretion has provoked the search for specifying systematic, stable and predictable policy rules to guide the conduct of interest rate policy a la the Taylor's rule (Taylor, 1993) under which the nominal interest rates are calibrated to respond symmetrically to deviations of output from its potential growth path and inflation (expectations) from the target. Such rules or policy reaction functions, as they are euphemistically termed, reduce the inflation bias in growth oriented monetary policy (Svennson, 1999).
Operating Framework for Monetary Policy in India
5.32 There has been a progressive erosion in the analytical underpinnings of 'monetary targeting with feedback' during the second half of the 1990s. The monetary and credit policy for 1998-99 raised questions about the explanatory power of the money demand function (RBI, 1998a). Similar sentiments were expressed regarding the predictive stability of money demad by the Third Working Group on Money Supply (RBI, 1998b). Accordingly, in the recent period, there has been an intensive quest for the analytics underlying the operational framework of current monetary policy in India and their empirical validation.
5.33 It is possible to capture the dynamics of the operational conduct of current monetary policy through a small, computable model linking the objectives and instruments of monetary policy within a simple representation of the macroeconomic processes through which monetary policy is transmitted. The model is set in the modern tradition of the 'consensus' approach which is being increasingly employed to capture the prevailing operating procedures of central banks worldwide. The 'consensus' model has the advantage of being simple, transparent and tractable. Relative to large-scale macroeconomic models, the consensus approach allows for easier evaluation of alternative policy rules. Although highly aggregative, these models have considerable theoretical content in providing stylised representation of the monetary policy transmission mechanism.
5.34 The model estimated in this Chapter draws from the empirical approach adopted in the context of examining the impact of bond financing of fiscal deficits in India (Moorthy, Singh and Dhal, 2000) and the foregoing discussion: i) monetary policy is faced with a multiplicity of objectives, although a single goal is desirable; specifically, monetary policy cannot avoid concerns about stabilising the real economy around a desired growth path even as it commits itself to price stability; ii) there exists a short run trade-off between growth and inflation and monetary authorities are constrained to take a position on the growth-inflation curve, reflecting their policy priorities; iii) money plays no explicit role in the model although the key monetarist assumption that inflation in the long run is determined by monetary policy is retained implicitly; iv) the interest rate is treated as the principal instrument of monetary policy in consonance with monetary policy operating procedures all around the world under which monetary authorities adjust interest rates in response to economic developments. The interest rate becomes an overall index of financial conditions and all financial prices move in a stable and predictable way with changes in the policy rate (Meyer, 2001).
5.35 The first issue is the choice of objective(s) for monetary policy. The stated objectives of monetary policy in India are to 'provide sufficient credit for growth while ensuring that there is no emergence of inflationary pressures on this account' (RBI, 2001). These objectives are consistent with announced projections of growth and inflation, with projections for non-food credit performing the ad hoc role of an intermediate variable. The choice of these objectives inevitably involves a consideration of societal welfare, i.e., deviations (of inflation and growth) from the chosen combination cause losses of macroeconomic welfare. There is considerable agreement among academics and central bankers that the appropriate loss function involves stabilising inflation around an inflation target as well as stabilising the real economy represented by the output gap (Svensson, op cit). The conduct of monetary policy should be directed towards minimising these welfare losses. The critical policy choice is the relative importance or weights to be assigned to deviations of output and inflation from the targets. This involves a knowledge of the structural characteristics of the economy. In terms of the model, this can be expressed through a simple three equation system specifying aggregate demand, aggregate supply and a policy rule setting out the response of the monetary policy to fluctuations in demand and supply (Chart V.5).
|
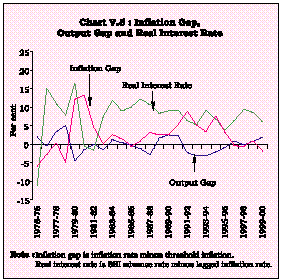
5.36 As in the case of fiscal policy, monetary policy operates by influencing the gap between aggregate demand and supply which, as indicated in Chapter IV, has to be estimated within the framework of a macroeconomic model (as in Chapter VIII). For operational purposes, however, a reasonable approximation of the aggregate demand-aggregate supply gap can be obtained as the difference between actual and the underlying or structural component of output. Therefore, the first building block of the model is the specification of the behaviour of aggregate demand (output gap) that depends upon its past behaviour and the real interest rate which has a negative impact on demand. The real interest rate is defined in a forward-looking sense by deducting inflation expectations (proxied by lagged inflation) from the nominal interest rate represented by the SBI advance rate. In India, cyclical changes in economic activity have often been induced by supply shocks, predominant among which has been that emanating from increases in international oil prices. This is explicitly incorporated in the estimation of the aggregate demand in the model in the form of fuel price inflation. Essentially, in terms of standard economic analysis, the aggregate demand function takes the form of an expectational IS (Investment-Saving) function of the type that can be justified by dynamic optimisation analysis.
5.37 Deviations of inflation from the threshold can be studied from the supply side of the economy. The aggregate supply curve can be represented by a Phillips curve type formulation in which inflation is positively related to the output gap. The supply curve also captures the effect of inflation expectations on inflation with expectations formed in an adaptive way, i.e., current inflation is determined by its past. The introduction of lagged inflation in the estimation of the supply curve produces the short-run tradeoff between inflation and growth. Food prices, another major source of supply shocks, are introduced into the supply curve reflecting the structural characteristics of the Indian economy.
5.38 The model is closed by specifying a policy rule setting out the response of the monetary policy to deviations of the economy from the desired combination of growth and inflation chosen by the monetary authority to minimise welfare losses. In view of the country-specific situation involving the conduct of public debt management by the monetary authority and the recourse of the fisc to money financing, the fiscal deficit is explicitly introduced into the monetary policy reaction function. The policy reaction is embodied in the adjustments in the Bank Rate, the principal signaling variable as well as an anchor for interest rates on standing refinance facilities, repo rates and in general, the term structure of interest rates in India. The deployment of the Bank Rate is postulated as being symmetric in response to inflation and output deviations. An increase in the Bank Rate results in a rise of the market rate for advances, which compresses aggregate demand (or output gap) and aligns the output/inflation deviations with targets/threshold.
5.39 The statistical results of the model turn out to be reasonably robust1. In the aggregate demand equation, the coefficient of aggregate demand with respect to real bank lending rate is estimated at (-)0.24 in the short-run and almost (-)0.5 in the long-run. This suggests that a 100 basis point reduction in the real interest rate raises the aggregate demand and narrows the output gap by almost 25 basis points in the short-run and up to 50 basis points over time. Supply shocks embodied in the international oil price hikes have a major influence on aggregate demand, generating cyclicity in output behaviour. Adjustments of aggregate demand fluctuations to its underlying levels are fairly rapid, with almost one-half of the output gap closed within one year. This suggests that the amplitude of the cycle in the Indian economy is relatively small - upturns quickly follow downturns, vindicating the results of the spectral analysis conducted in Chapter III. The operation of monetary policy through real interest rates appears to have had a stabilising influence on aggregate demand. Simulations of the estimated equation indicate that the impact of policy measures for demand compression during the balance of payments shocks of 1990 had prolonged effects. Aggregate demand was constrained well below its potential up to 1996-97 when, following the cyclical catch-up, aggregate demand was predicted to experience a downturn. The behaviour of actual aggregate demand indicates that the model overpredicted the downturn, mainly on account of demand stimulus emanating from the Fifth Pay Commission award and a strong rebound in agricultural growth (Chart V.6).
|
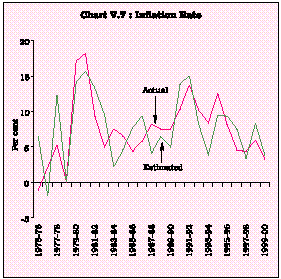
5.40 The estimates of the aggregate supply equation2 indicate that the dynamic or long-run effect of aggregate demand on (changes in) inflation is about 0.5, i.e., a 100 basis points increase in the aggregate demand (above its underlying) results in almost 50 basis points rise in the inflation rate. The role of food prices, a traditional channel for transmission of supply shocks to domestic inflation, is also significant; an increase of 100 basis points in foodgrains inflation rate leads to an increase of 44 basis points in the inflation rate (Chart V.7). The estimated supply equation captures the turning points fairly closely.
|
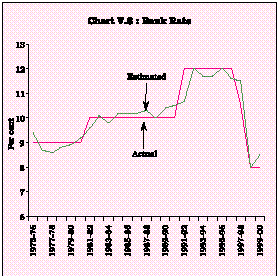
5.41 Estimates of the monetary policy reaction function satisfy a priori expectations of symmetrical response of the monetary policy to output and inflation movements3. An expansion of the aggregate demand and/or rise in inflation above threshold provokes a revision in the Bank Rate in the similar direction. The estimates show that the Bank Rate is positively related to the size of the fiscal deficit (the long-run coefficient of fiscal deficit/GDP ratio is placed at 1.4) indicating that the monetary policy reaction is partly attributable to the size of the fiscal deficit which imparts a downward rigidity to the interest rates in the country. The lagged coefficient of the Bank Rate turns out to be significant suggesting a strong order of interest rate smoothing in support of financial stability, a result consistent with the empirical evidence emanating from the estimated reaction functions of other major central banks (Clarida, Gali and Gertler, 1998). The estimated and actual paths of the Bank Rate are indicated in Chart V.8.
|
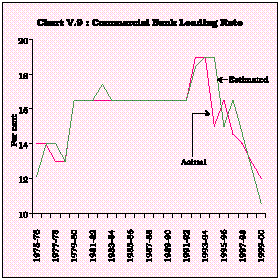
5.42 As real interest rates employed in the model are derived from the commercial bank lending rate (SBI Advance Rate), the latter is linked through a linear relationship with the Bank Rate4 (Chart V.9).
|
5.43 In the model, a macroeconomic disturbance resulting in a demand-supply imbalance provokes a monetary policy reaction in the form of a change in the Bank Rate. The commercial bank lending rate changes in a linear and symmetric manner. As inflation expectations are inertial in the short-run, the change in nominal interest rates is reflected in real interest rates. This has a negative impact on aggregate demand and, in turn, on inflation. The monetary authority analyses the developments in aggregate demand and inflation in response to its initial interest rate move and re-calibrates, if necessary, its reaction. A negative shock to ( reduction in) the Bank Rate, as discussed in Chapter VIII, produces some positive effects on the real economy in the short-run, but has adverse effects on inflation over time. In the long-run, therefore, monetary policy has to constantly rebalance the short-run output gains against the loss of welfare due to higher future inflation. This is the constraint facing growth-oriented monetary policy.
Sacrifice Ratio
5.44 Despite the recent record of low inflation the world over, the current disinflation cycle affecting both developed and developing countries has generated considerable scepticism about the primacy, and, in some cases, the single mindedness of monetary policy pursuing inflation. In recent years, there has been a proliferation of empirical work on measuring the macroeconomic costs of reduction in inflation from a certain low level. As Japan has learned, and Europe may soon find out, there is a new danger - falling prices may lock countries into a spiral of economic decline (The Economist, 1999). Given the short-run trade-off between inflation and output on account of wage and price rigidities, it stands to reason to expect a point beyond which attempts to reduce inflation would necessitate a reduction in output. In other words, a sacrifice of output is inevitable in the pursuit of inflation reduction. This loss of output, referred to in the literature as the sacrifice ratio, has encouraged the use of several alternative methodologies for their measurement, largely in the tradition of Okun. In the context of an increasing mass of developed economies having already achieved a relatively low inflation in the 1990s, the concept of sacrifice ratio, and the appropriate conduct of monetary policy, is being subjected to critical review. Of particular concern is the increasing evidence obtained from estimation of sacrifice ratios for industrial countries that aggregate supply curves tend to flatten out in an era of low inflation and structural rigidities. This may increase sacrifice ratios and lead to higher unemployment as firms would be forced to adjust, not through changes in wages which acquire an additional rigidity at low inflation rates, but through changes in employment. Thus, a tightening of monetary policy would have stronger real effects than in the past. The question, therefore, is raised as to whether 'gain from reducing inflation to zero is worth the sacrifice in output and employment that would be required to achieve it'.
5.45 The empirical evidence points to rising sacrifice ratios in periods of declining inflation. For 19 industrial countries for which inflation rates had fallen from 8 per cent (1965-85) to 3.5 per cent (1985-98), an increase of almost 75 per cent in the sacrifice ratios from 1.5 to 2.5 was observed (Anderson and Wascher, 1999). At the same time, the size of sacrifice ratio also depends upon the speed of adjustment with gradual disinflation leading to a higher sacrifice ratio compared to a cold turkey approach providing empirical support for rapid disinflation (Ball, 1993). The preference for speed of disinflation would critically depend upon the shape of the social welfare function. The increase in sacrifice ratios is also found to be relatively less for the countries that had undertaken measures to increase labour market flexibility.
5.46 An important related issue is whether increased central bank independence lowers the sacrifice ratio, i.e., whether there is a credibility bonus associated with independent central banks? A priori the public is expected to more readily believe the anti-inflationary pronouncements of an independent central bank and this, in turn, should lower output losses. Some studies, however, did not find any such credibility bonus; on the contrary, a positive and significant relationship between central bank independence and sacrifice ratio was observed. In other words, more independent central banks, on an average, pay a higher output price per percentage point of inflation to reduce the inflation rate (Fischer, 1994). The results suggest that even independent central banks have to fight hard and long to bring inflation down after an inflationary shock has struck.
5.47 Estimations of sacrifice ratios for developing countries, and particularly, for India are scanty. Nevertheless, given the current low level of inflation, concerns have been raised regarding the efficiency gains, and, more recently, on the potential output losses associated with assigning relatively higher weights in the conduct of monetary policy to reduce inflation. Accordingly, an attempt is made to estimate the sacrifice ratio for India from the aggregate supply curve (Phillips Curve) estimated as an element of the operating framework of the Indian monetary policy (presented earlier in this section). The specification of the inflation process in the aggregate supply curve follows the ‘triangle model of inflation’ (Gordon, 1997; Turner and Seghezza, 1999). The sacrifice ratio5 for India turns out to be almost 2 over the period 1975-2000, i.e., in a low inflation environment, a further reduction in the inflation rate by 1 percentage point would reduce the output by 2 percentage points from its potential level.
5.48 The estimated sacrifice ratio for India is relatively lower than that of major industrial countries. Estimates of sacrifice ratios are found to be sensitive to the estimation methodology. For a sample of 19 countries, the estimated sacrifice ratio averaged 5.8 per cent based on quarterly data and 3.1 per cent based on annual data (Ball, 1993). Similarly, for OECD countries, based on single equation estimates, the average sacrifice ratio was 3.2; for most of the countries, the ratio lay in a range of 2-4, although outliers of 1.6 (Japan, Italy and the Netherlands) and 7 (Norway) were also observed (Table 5.3). System estimates yielded a common sacrifice ratio of 3.7 for 15 out of the 17 sample countries (Turner and Seghezza, 1999). Given that the threshold inflation in India is at around 5 per cent and that the average inflation has been higher than the threshold, the lower order of sacrifice ratio for India compared with the OECD countries is to be expected; however, once the inflation falls below the threshold inflation of 5 per cent, the sacrifice ratio could end up being higher.
5.49 In India, an abiding faith in the working of the credit channel of policy transmission runs through the conduct of monetary policy right from the 1950s. The tone was set out in the First Five-Year Plan document itself which envisaged 'judicious credit creation somewhat in anticipation of the increase in production and the availability of genuine savings' (GoI, 1952). Right up to the 1980s, fiscal policy was accorded primacy in stepping up the investment rates and generating a 'virtuous circle' of growth through vertical inter-relationships and monetary policy accommodated the same. The inflationary consequences of primary financing of government expenditures were tackled by curbing credit to the commercial sector and raising the cash reserve ratio (CRR) and statutory liquidity ratio (SLR) to a peak level of around 60 per cent of bank's net demand and time liabilities by 1990.
5.50 The logical evolution of the monetary policy setting in the 1970s was in the direction of credit rationing as an integral element of developmental planning. The rationing of credit evolved with food credit being given the first charge, followed by the prescribed priority sector lending, sectoral limits for credit deployment and selective credit controls. Sectoral credit targets became the proximate targets for monetary policy which was operated through allocations of non-food commercial bank credit.
Study | Methodology | Coverage and Study | Estimates of Sacrifice Ratio (%) |
Period | |||
1 | 2 | 3 | 4 |
Ball (1993) | Actual developments in output | 19 industrial | Average 5.8 per cent for quarterly data |
and inflation | Countries; 1960-92. | and 3.1 per cent for annual data. For | |
annual data, the range was 0.9 (France) | |||
– 10.1 (Germany). | |||
Anderson and | Aggregate supply curve; structural | 19 OECD countries; | Average of 1.5 (1965-85) and 2.5 |
Wascher (1999) | wage and price equations; actual | 1965-85 and 1985-98. | (1985-98). |
developments in output and inflation | |||
Turner and | Aggregate supply curve | 21 OECD countries; | Average of 3.2 with a range of 1.6 |
Seghezza (1999) | 1963-97. | (Japan, Italy and the Netherlands) – | |
7.0 (Norway). | |||
Current Study | Aggregate supply curve | India; 1975-2000. | 2.0 |
Selective credit controls were strengthened by the institution of the Credit Authorisation Scheme in 1966-88 and with the nationalisation of banks, the institutional apparatus for conducting monetary policy through the credit channel, to the virtual exclusion of other channels, was complete. Refinance was provided in order to make up for the shortfall of credit targets in relation to demand. The quantitative credit planning implied a reduced role of the interest rate as an equilibrating mechanism in the credit market. The interest rate structure was complicated and administered, rendering it inflexible and sterile as an instrument of monetary policy. The policy of setting up interest rate ceilings up to 1987-88 in situations of excess demand reinforced the rationing of bank credit in order to influence aggregate demand.
5.51 The conduct of monetary management has undergone significant changes in the 1990s in terms of objectives, framework and instruments, reflecting broadly the progressive liberalisation of the Indian economy. The Reserve Bank announced a multiple indicator approach in 1998-99, which accords the necessary flexibility to respond to changes in domestic and international economic and financial market conditions more effectively. The monetary stance of the Reserve Bank in the recent period has been to ensure that all legitimate requirements for credit are adequately met consistent with the objective of price stability. Liquidity operations are conducted with a view to ensuring that the demand for reserves is stable and adequately satisfied so that credit projections consistent with the macroeconomic objectives of growth and inflation are achieved. Simultaneously, progressive improvements in the modes of delivery of bank credit have been pursued.
Sifting the Literature for the Credit View
5.52 The genesis of the credit view is essentially traced to a critique of the standard macroeconomic literature which treats the financial structure as irrelevant to real outcomes (Modigliani and Miller, 1958). There has, however, been a long standing alternative tradition in the literature beginning with Fisher (1933) and Keynes (1930) and upheld in more recent years by Bernanke (1983), Blinder (1987), Gertler (1988) and others which has asserted a central role of the credit market in the propagation of cyclical fluctuations. In this alternate view, deteriorating credit-market conditions - sharp increases in insolvencies and bankruptcies, rising real debt burdens, collapsing asset prices - are not passive reflections of a declining economy, but are themselves major contributors to the depression. Abandoning the classical view of the financial system just acting as a 'veil' and merely accommodating the real sector requirements, the credit view literature incorporates credit market imperfections into the standard macroeconomic models to show the crucial role of credit behaviour in explaining even 'garden-variety' cyclical fluctuations (Bernanke, Gertler and Gilchrist, 1999). The two key assumptions in the credit channel are that banks cannot shield their loan portfolios from changes in monetary policy and that borrowers cannot fully insulate their real spending from changes in the availability of bank credit. Monetary policy works by affecting bank assets, i.e., loans, in addition to bank liabilities, i.e., deposits and the credit channel is a supplement, not an alternative, to the usual money channel (Box V.2).
Credit View
The 'credit view' questions the asymmetry in the traditional macroeconomic models, i.e., the special role of money, the bank liability, in the determination of aggregate demand of the economy while, in contrast, lumping together bank loans with other instruments in a 'bond market' and suppressing the same by Walras Law (Bernanke and Blinder, 1988). The 'money view' holds that financial intermediaries like banks offer no special services on the assets side and capital structures do not affect any lending/borrowing activity, while on the liability side of their balance sheet the banking system creates money by issuing demand deposits. A monetary contraction, thus, in a two asset model (money and bonds) limits deposit selling ability of banks with depositors prompted to adjust their portfolio to holding more bonds and, in absence of instantaneous price adjustment, driving the real money balances down and pushing up the real interest rates on bonds. The resultant increase in the user cost of capital reduces the interest-sensitive spending and real economic activity. On the other hand, the 'credit view', arguing the existence of imperfect capital markets and information asymmetries between borrowers and lenders, relaxes the assumption of perfect substitutability of bank lending and bonds and holds that the bank lending is key in reducing the premium especially in information intensive loans for bank-dependent borrowers. The 'bank lending channel', thus, holds that a contractionary monetary policy decreases bank reserves, which cannot be offset by the banks (say, by issuing certificates of deposits) thereby reducing the bank lending, investment demand and output. The credit view also proposes a 'balance sheet channel' of monetary transmission arguing the additional possibility of monetary shocks affecting the net worth of firms thereby affecting lending activity of banks and other financial institutions. Thus, a contractionary monetary policy leaves less money in the hands of public which spills over as a lower demand for equity driving the net worth of firms down through lower equity prices thereby prompting the banks to check lending and inhibiting investment demand. The initial monetary policy shocks as per the traditional 'interest rate channel' of the money view tend to be magnified in its impact on real economic activity through the 'financial accelerator'.
The 'credit view' model, in a simplified sense, introduces a third asset besides money and bonds in the form of loans by dropping the assumption of perfect substitutability between bonds and credit. In a simplified framework, the loan demand is treated as a function of lending rate, interest rate on bonds and GDP (representing the transactions demand for credit arising from working capital and liquidity considerations). Assuming that banks’ desired portfolio proportions depend on rates of return on the available assets, the loan supply is treated as a function of lending rate (positive), interest rate on bonds (negative) and the required reserve ratio (negative). The introduction of the third asset necessitates a replacement of the traditional goods market equilibrium locus in the form of IS curve in the standard macroeconomic model with a commodities credit (CC) curve which would also be negatively sloped but would be susceptible to changes in monetary policy or the bank reserves as well as credit market shocks unlike the usual IS curve. Here, the monetary policy variations affects real economic activity by not only impacting the money market equilibrium locus, i.e., LM curve but also the CC curve. The excess demand in the credit market on account of a decline in bank loans can be removed either through the market clearing rises in the premium on bank loans (Bernanke-Blinder, op cit) or through rationing of loans (Stiglitz and Weiss, 1987). Amidst the existence of credit market imperfections with problems of asymmetric information in a situation of excess demand, the credit rationing cannot be done by increasing interest rates as the latter prompts the borrowers to choose riskier projects (moral hazard) or weeds out relatively safe investments due to low profitability (adverse selection) but by augmenting rate of interest with non-rate terms. The asymmetric information leads to imperfections in financial markets and because of imperfect monitoring, raises the cost of external funds in relation to internal funds making the two imperfect substitutes for firms. Thus, even in equilibrium, the loan market may be characterised by rationing.
References
- Bernanke, B., M. Gertler and S. Gilchrist (1999), 'The Financial Accelerator in a Quantitative Framework' in J.B. Taylor and M. Woodford (eds.) Handbook of Macroeconomics.
- Bernanke, B. and A. Blinder, (1988), 'Credit, Money and Aggregate demand ', American Economic Review, 73, (May).
- Modigliani, F. and M. Miller (1958), 'The Cost of Capital, Corporation Finance, and the Theory of Investment', American Economic Review, 48, (June).
- Stiglitz, J. E and A. Weiss (1987), 'Macroeconomic Equilibrium and Credit Rationing', National Bureau of Economic Research Working Paper, No. 2164.
5.53 Empirical examination of the credit view associates the severity of Great Depression of the early 1930s in part with financial distress associated with the deflation experienced during that period (Bernanke, 1983). Interest in the credit channel has revived in the early 1990s with the growth record in Asia and Latin America being associated with a bank credit boom and narrowing of intermediation spreads. The large devaluations and interest rate shocks of end-1994/early 1995 in Latin America and at the end of 1997-98 in Asia are attributed with having eroded the deposit base and created large non-performing loans, leading to a credit squeeze which prolonged the recession beyond the period warranted by the initial monetary tightening. As bank loans form a crucial input for provision of working capital as well as households' spending decisions in a typical emerging market economy, the bank credit squeeze led to a drop in the real GDP concentrated in non-tradeable sectors (Catao and Rodriguez, 2000). Some evidence of credit view is also found in Finland for the period 1980-1996 (Anari et al, 1999). Recent empirical work on the co-behaviour of limits on borrowing and the 'buffer stock' have established the effects of credit market imperfections on consumption demand (Deaton, 1991) as well as investment demand via the impact of the balance sheet (Hubbard et al, 1995). The cross-country experience in developed economies as well as the developing economies suggests that given the existence of credit market imperfections as well as bank dominated credit markets, bank credit acts as a 'financial accelerator' amplifying both the economic downturns as well as upswings by a far greater degree than warranted by initial monetary shocks.
The Credit View in India
5.54 As mentioned earlier, the credit view dominated monetary economics in India. The experience of the 1970s resulted in a certain disenchantment with the credit view that was regarded as the 'ruling orthodoxy'. The restriction on operational freedom for the banks in the form of statutory pre-emptions for food procurement, exports, agriculture, small scale sector, vulnerable sections, core industries and sick industries implied that the channel of credit allocation to few pockets of the commercial sector could transmit very limited influence on the real economic variables (Vasudevan, 1978). Nevertheless, even with the advocacy for monetary targeting, full credence was given to the 'credit view' as the creation of money was viewed as simultaneously the creation of credit (RBI, 1985). While monetary expansion leads to an increase in prices, credit expansion facilitates an increase in investment and expansion in output. The issue before the policy maker is to balance the output gains of credit creation with the inflationary consequences of money creation. In the context of a macroeconomic model, it was shown that the price effect of a given expansion in money supply is higher than the output effect (Rangarajan, 1997).
5.55 Studies conducted in the early 1990s have raised a number of interesting features of the Indian credit market. First, there appears to be a switch from a regime of credit rationing to a situation of demand constraint in the loan market in 1993-94. Second, the presence of excess liquidity in the system had failed to stimulate production. Third, the increase in commercial bank credit to the government had been far in excess of the requirement under the SLR (Rakshit, 1994). In the context of credit-supply constrained firms in the Indian industry, three major findings have been reported. First, bank credit does influence inventory accumulations. Second, the size of external finance premium depends on the financial conditions of firms and third, bank dependent small industries suffer most during the period of quantitative credit control (Mukhopadhyaya, 1998).
Stylised Facts in India
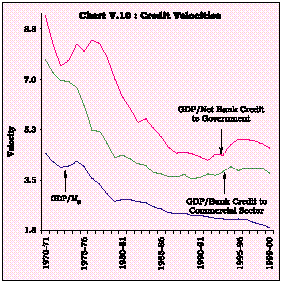
5.56 An analysis of macroeconomics of credit holds the key to an understanding of the role of monetary policy in the context of the possibilities of revitalising growth in the Indian economy for four reasons. First, the credit velocities have progressively become more stable than money velocities over the recent years. The ratio of GDP to bank credit to commercial sector, after having declined from 7.7 in 1970-71 to 3.8 in 1984-85, has remained stable thereafter around that value. The ratio of GDP to net bank credit to government decreased from 9.2 in 1970-71 to 4.6 in 1986-87 but stabilised thereafter around that value. The money (M3) income velocity has declined from 4.4 in 1970-71 to 1.9 in 1999-2000 (Chart V.10).
|
5.57 Secondly, the point estimates of elasticity of income with respect to commercial sector bank credit, which were generally lower than the elasticity of inflation with respect to broad money during the 1970s, have more or less converged during the post-reform period (Chart V.11).
|
5.58 Thirdly, there has been growing importance of the assets side of the balance sheet of the banking system in India thereby necessitating a relaxation of the typical assumption made in the 'money view' of perfect substitutability of assets of the banking system. For instance, with the progressive reduction in the statutory earmarking of resources from the banking sector for Government, there has been growing importance of allocation of resources for the commercial sector. There has also been increasing accretion to foreign assets in the banking system in the 1990s (Chart V.12). Fourthly, the Indian economy, like many other developed and developing economies, has experienced marked cycles in credit markets along with cyclical fluctuations in output (Chart V.13).
|
|
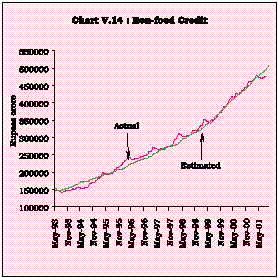
Macroeconomics of Credit: An Empirical Investigation
5.59 An empirical investigation of the non-food credit market is undertaken for the post-reform period using monthly data from May 1993 to September 2001 based on the framework of Bernanke-Blinder (op cit). The demand for non-food credit from the banks is largely for working capital finance. Credit demand depends on output, represented here by the index of industrial production (IIP). The dependence on output essentially tends to capture the transactions demand for credit which might arise from working capital or liquidity considerations. Generally, it is expected that a higher output would lead to an increase in the off-take in non-food credit. The other factor which normally determines the demand for non-food credit is the interest rate charged on the bank loans. It is expected that the demand for credit would be negatively related to the lending rate.
5.60 Supply of non-food bank credit is postulated to depend on the lendable resources that banks have after meeting cash reserve requirements. It is also expected to be influenced by the secondary pre-emptions by the government through the SLR. Logically, the lower the statutory pre-emptions, the higher would be the resources available for augmenting credit supply. Credit supply is also posited to be responsive to a host of financial prices, specifically the lending rate of banks, an alternate risk-free interest rate of holding government paper, say Treasury Bills6 and equity prices. While government bonds are a substitute for bank lending, equity prices impart balance sheet effects and work in the same direction as the lending rate on credit supply. The equity price is an important variable as the spread between the cost of external and internal finance varies inversely with the borrower's net worth - internal funds and collateralisable resources - relative to the amount required. Furthermore, an adverse shock to a borrower's net worth increases the cost of external finance and decreases the ability of the borrower to implement investment, employment, and production plans.
5.61 The empirical investigation is undertaken through a system of simultaneous credit demand and credit supply equations to avoid the 'simultaneity bias' with controls for seasonality. The results7 showed that the demand for non-food credit is predominantly influenced by economic activity embodied in the IIP not only contemporaneously but also by 1-month and 2-month lagged output. Credit demand is found to be inversely related to the bank lending rate with interest elasticity of 0.22, indicating a key role for interest rate policy in supplementing the credit channel in the context of revitalising growth. Output elasticities (both current as well as lagged) of credit demand are higher, in absolute terms, than the interest elasticity of credit demand. This explains the dominant influence of the current slowdown on credit demand and the tendency of the output effects to outweigh the beneficial effect of the declining interest rate conditions (Chart V.14).
|
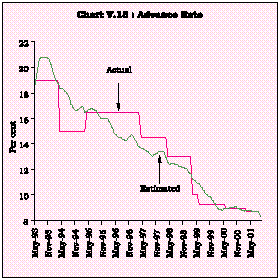
5.62 On the supply side, a positive effect of the lending rate of banks on the supply of credit was obtained (a 1 per cent increase in the supply of non-food credit leads to a 0.4 per cent rise in the lending rate). The lending rate of the banks is explained very significantly by its own lagged behaviour, suggesting an inertia in lending rate movements reflecting certain structural rigidities which impart downward flexibility in the interest rate structure in India. Equity prices measured by the BSE National Index have a positive and significant relationship with the supply of non- food credit. This indicates that push factors driving up equity markets and bank lending are similar. In the contrary situation, both the markets are adversely affected, which seems to explain the current slump in equity as well as credit markets (Chart V.15).
|
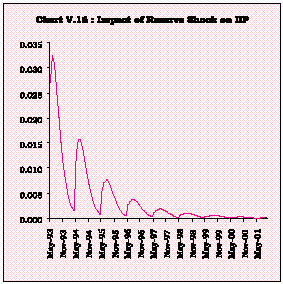
5.63 An analysis of the shock effects over the full-sample time span is conducted by examining difference between estimated and simulated series. In order to assess and quantify the impact of shocks on each endogeneous variable, positive shocks of 1 per cent each on credit demand, interest rate on advances and index of industrial production are given (Table 5.4). Besides, the shock to the cash reserve ratio is analysed through a positive shock (increase) of 1 per cent in bank’s lendable resources.
(Per cent) | ||||
Variables | Credit | Advance | Index of | |
Demand | Rate | Industrial | ||
production | ||||
1 | 2 | 3 | 4 | |
Credit Demand | * | 0.70 | 0.23 | |
Advance Rate | -1.58 | * | -0.68 | |
Index of Industrial Production | 0.97 | 1.29 | * | |
Banks’ Lendable Resources (*) | 0.80 | -0.55 | 0.34 | |
* : One percentage point positive shock to the variable at the commencement of the period. Sample Period is May1993 to September 2001 | ||||
5.64 These results show that the direction of the changes are on expected lines. For instance, a positive shock (increase) in interest rate on advances appeared to drive down the credit demand which in turn leads to some fall in industrial production. The fall in output (being a secondary effect) is found to be of a lower order than the fall in the credit demand. A positive shock (increase) to the banks’ lendable resources works out to be lower on both the demand for credit (0.80) as well as the IIP (0.34) than their impact from the interest rate shocks. The effect of the shocks is concentrated in the first three years and tapers off thereafter (Charts V.16 and Chart V.17).
|
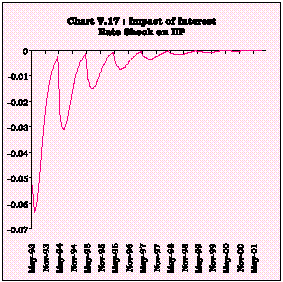
|

5.65 With the progressive relaxation of the interest rate regime and the removal of structural rigidities during the post-reform period, the bank lending rate appears to be emerging as an important channel of monetary transmission. The current policy stance of easing of interest rate environment is a necessary though not a sufficient condition to revitalise the growth prospects of the economy. Thus, the credit channel in India supplements and reinforces the interest rate channel rather than supplanting the latter.
IV. THE CONSTRAINTS ON GROWTH-ORIENTED MONETARY POLICY
5.66 The preference for extracting output gains suggests an inflationary bias in monetary policy and, therefore, the existence of a dynamic inconsistency. The 'bias' for economic expansion can arise from a number of factors such as knowledge of the changing characteristics of the economy, the need to produce a consistent state-contingent policy response, political pressure on monetary policy, seigniorage revenue and the incentives provided to the monetary authority to be publicly credible.
5.67 It is increasingly recognised that when the announced inflation target is fully incorporated in the public's expectations regarding future inflation, an incentive for generating surprise inflation and, therefore, a little more output expansion opens up once inflation expectations are stabilised. Discretionary conduct of monetary policy allows the monetary authority to alter its instrument setting in favour of inflating the economy at a higher rate than announced (or what is socially desirable). Thus, announced policy objectives are not regarded as time consistent by the public which starts building in policy surprises into its expectation formation and this, in turn, renders monetary policy action sterile. Therefore, rather than discretion in monetary policy, simple and understandable policy rules have been favoured in the theoretical literature.
Proximate Solutions to Time Inconsistency
5.68 Following the seminal work on the theme (Kydland and Prescott, 1977), there has been a considerable attention in the literature on the issue of time-inconsistency of monetary policy and proximate solutions to the problem (Barro and Gordon, 1983; Rogoff, 1985; Persson and Tabellini, 1993; Nowaihi and Levine, 1994; Walsh, 1995). The resolution of the time inconsistency problem essentially involves raising the marginal cost of inflation as perceived by the central bank.
5.69 The solutions highlight the reputational constraints on central banks. Succumbing to the temptation to inflate today worsens the central bank's credibility in delivering low inflation in the future. Pursuing current expansionary monetary policy will be punished by higher inflation expectations in the future -'by punishing the central bank, the loss of reputation raises the marginal cost of inflation' (Walsh, op.cit.). The important issue is that the central bank must believe that it will be punished if it 'cheats', i.e., the credibility of trigger strategies becomes important (Friedman, 1977). If by punishing the central bank, the private sector also punishes itself, the threat to punish may not be credible. Furthermore, if the central bank has private information about the working of the economy or if the public is unsure about the central bank's true preferences, reputational constraints in the sense of chisel-proof credibility (Nowaihi and Levine, op cit) are difficult to enforce.
5.70 An alternative approach to solving the time inconsistency problem has been to focus on the preferences of the central bank. Delegating the conduct of monetary policy to a 'conservative central banker' (Rogoff, 1985), i.e., one with a low time preference and a higher preference for price stability relative to output considerations has formed the basis of a wider search for independence of the central bank as the solution to time inconsistency. If the central bank is independent and more conservative than society as a whole, caring less about output relative to inflation, then the public could treat its preferences as different from the elected governments. In a multi-sector economy, however, the process of appointing the conservative central banker can be subject to partisan influences (Waller, 1992). Moreover, if supply shocks to the economy are large, the government can override the central bank. The knowledge of overrides or escape clauses can affect the central bank's response (Lohmann, 1992). The unification of East and West Germany showed that even central banks do not operate in a political vacuum. Thus, the appointment of a conservative central banker -if one can be found at all - can reduce the inflation bias but only at the cost of distorting stabilisation policy. The experience of countries with independent central banks invested with inflation objectives suggests that central bank independence is negatively correlated with inflation (Cukierman, 1992), but central bank independence does not appear to be correlated with output variance (Alesina and Summers, 1993). Therefore, it is possible that central banks with higher weights on inflation may achieve lower inflation, but they could also experience greater output variance (Table 5.5).
5.71 Another solution to the time inconsistency problem focuses on the incentives faced by the central bank. These incentives are shaped by the institutional structure in which monetary policy operates. In the tradition of Walsh (1995), these institutional arrangements can be represented by a contract between the central banker (the agent) and the Government (the principal). The central banker's tenure in office is conditional upon his performance of achieving low inflation, failure of which would lead to the repudiation of the contract of tenure. Drawing up a contract loaded with incentives for conservative behaviour can achieve the dual objective of eliminating the inflationary bias while ensuring the optimal stabilisation response from the monetary authority. If inflation itself is time varying, the contract can no longer be optimal although it can support optimal commitment by the central bank. Obviously, transparency and accountability have a critical role to play. New Zealand is characterised as having adopted the optimal contract approach. Such a solution is also preferred from the point of view of public choice theory: unless there are constitutional or institutional constraints to the contrary, a democracy contains a bias towards deficit finance; politicians do not necessarily pursue public interest but are more concerned with their personal or political agenda; central bank independence provides a solution which will ensure not only low inflation but also act as an effective institutional constraint8. On the other hand, it is argued that an independent central bank lacks democratic legitimacy - money is too important an issue to be left to the whims of central bankers.
Secondly, independence may lead to frictions between the fiscal and the monetary authorities and the resulting costs of these frictions between monetary and fiscal policy may be somewhat costly for society, thus inhibiting the development process. Thirdly, there may be significant divergence in the preference pattern of independent central banks and the society at large. A strong central bank may impose its outlook on society resulting in a sub-optimal state in terms of economic welfare. Recent literature has stressed the difference between goal independence and instrument independence.
5.72 While the contracting approach allows complete flexibility in the operational conduct of monetary policy, an alternative approach focuses on restricting policy flexibility. A wide variety of rules have been proposed and analysed. Inflation targeting is currently the most discussed form of target rules. Strict targeting rules may not be desirable as they eliminate any stabilisation role for monetary policy and the real economy has to adjust to shocks. Flexible target rules bring back the trade-off between credibility and discretion.
5.73 A large body of literature has focused on the institutional design of co-ordination between monetary and fiscal policies as another set of solutions to the time inconsistency problem. The institutional setting and operational arrangements for the co-ordination of monetary and fiscal policies differ widely among countries. A host of factors play a role in shaping the framework of co-ordination like the country's history, socio-political considerations, nature of financial market development and the broad objectives set for macroeconomic policies. Country experiences show how fundamentally these factors have shaped the co-ordination arrangements as well as legal and administrative infrastructure to produce a wide diversity of second best solutions. Within the overarching responsibility for macroeconomic stability, the monetary and fiscal policies differ in terms of their transmission channels, the lags with which they operate, their instruments, the authorities which wield them and the specific targets assigned to them. The form and content of policy co-ordination has undergone significant changes over the years. Countries have been intensively working towards establishing multilateral and consensus rules for monetary fiscal co-ordination. The Maastricht treaty of the European Union is the first major initiative in this direction, under which automatic access to central bank credit by the government is formally prohibited and indirect credit is discretionary. The IMF’s Code of Good Practices on the Monetary and Financial Transparency and Codes on Fiscal Transparency are recent important efforts in this area. The codes propose guidelines for clarity of roles, responsibilities and objectives of monetary and fiscal policies, open processes of policy formulation, accountability and integration and public availability of information.
Threat of Deflation
5.74 The recent Japanese experience has underscored the lower bound of monetary policy effectiveness and has brought the potential threat of deflation into focus. The monetary policy efforts to revitalise the economy have taken real interest rates in various countries to levels below their real growth rates, producing what has been termed as the deflationary gap. A situation of persistent deflation can set off a spiral of decline in activity, deflationary expectations, zero interest rates and an ineffectiveness of monetary policy - what has been termed as the 'liquidity trap'. In such a scenario, deflation prompts consumers to postpone their current spending in expectations of fall in prices in future leading to decline in demand and further fall in prices thus generating the deflation cycle. Low or zero inflation imparts inflexibility to wages, as workers' unwillingness to accept a cut in nominal wages increases the real wage burden to the entrepreneurs, prompting them to prune the size of their work force and deepening the recession. It also makes interest rates and other financial prices rigid making the relative price signals ineffective as interest rates cannot fall below zero (negative) and hence real interest rates remain high. Moreover, deflation increases the real debt burden causing bankruptcies and bank failures.
5.75 Monetary policy authorities and the academia tend to agree that a liquidity trap is likely to bring considerable instability and real output losses. It is in this context that they advocate strategies to avoid and escape liquidity traps. It is crucial to prevent inflation and inflation expectations from falling to deflationary levels. Advance contingency plans, emergency liquidity facilities, coordinated monetary and fiscal intervention, credible and transparent inflation targets are suggested in the literature as part of the strategy to fight the deflation.
5.76 In recent years, particularly in the 1990s, there has been an upsurge of interest in the operational framework of monetary policy. With the growing perception that the explanatory power of intermediate target regimes is getting eroded under the impact of globalisation and financial innovations, attention has shifted to the development of simple and flexible rules whereby monetary policy can directly achieve its objectives. Under these conditions, monetary policy operates with constrained discretion. The performance of a small, operational model for monetary policy in India suggests that under constrained discretion, monetary policy can be directed towards revitalising output growth in the short-run. The long-run inflationary consequences of current monetary policy action, however, need to be taken into account. Threshold inflation, i.e., growth-maximising inflation rate is estimated at 5 per cent. There are potential output losses involved in further disinflation. Sacrifice ratio estimates suggest that, in a low inflation environment, a one percentage point reduction in inflation leads to a decline in output by 2 percentage points below its potential. The interest rate channel is rapidly emerging as the dominant transmission mechanism, supported and reinforced by the credit channel. At this juncture, more evidence needs to be accumulated and fundamental analytical issues resolved before the new analytical framework for monetary policy can be validated.
5.77 Several landmark initiatives have been recently announced to correct for the known time inconsistency in the conduct of monetary policy. The decision to divest ownership functions in commercial banking, development of finance and securities trading entities, separation of supervisory functions in regard to co-operative banks, separation of public debt management function from monetary policy, changes in the operational conduct of monetary and fiscal policies suggested by Advisory Group on Transparency in Monetary and Financial Policies (Chairman: Shri M. Narasimham) and the tabling of the Fiscal Responsibility and Budget Management Legislation mark a new phase in the evolution of monetary policy in India in the new millennium.
5.78 The conduct of the monetary policy in India would continue to involve the constant rebalancing of objectives in terms of the relative importance assigned, the selection of instruments and operating frameworks, and a search for an improved understanding of the working of the economy and the channels through which the monetary policy operates.
YGAP = 4.71 - 0.24 RLINT -0.22 DOIL - 2.57 DUMAGRI + 0.52 YGAP(-1) | ||||
(-3.5) | (-4.0) | (-3.8) | (3.3) |
R2 = 0.60. Durbin’s h = -0.1 |
Where, YGAP, RLINT, DOIL and DUMAGRI denote output gap, real bank lending rate, fuel inflation index | ||||
and a dummy for agricultural output (=1 when agricultural output growth is negative), respectively. | ||||
DINFLX = 0.74 YGAP(-1) + 0.44 DDWPFOOD - 0.22 DINFLX(-2) - 0.27 DINFLX(-4) | ||||
(1.9) | (4.7) | (-1.6) | (-2.1) |
R2 = 0.70 Durbin’s h = -0.4 |
Where, DINFLX, YGAP and DDWPFOOD denote change in inflation rate, output gap and change in | ||||
foodgrains inflation rate, respectively. | ||||
EQBNK = -1.17 + 0.09 YGAP(-1) +0.05 TINFLX(-1) + 0.24 FDGDP(-1) + 0.83 EQBNK(-1) | ||||
(1.5) | (2.2) | (2.5) | (6.7) |
R2 = 0.85 Durbin’s h = -1.1 | ||||
Where EQBNK is Bank Rate, TINFLX is inflation rate less threshold inflation, FDGDP is public sector saving- | ||||
investment deficit (as a proportion of GDP). | ||||
DSBIADV = 3.50 DUM80 + 0.94 DBNKRTE(-1) | ||||
(3.0) | (3.4) |
R2 = 0.44, DW = 2.3, |
Where DSBIADV, DUM80, DBNKRTE denote change in SBI Advance Rate, a dummy for 1979-80 and change | ||||
in Bank Rate, respectively. | ||||
5 The sacrifice ratio is calculated as the ratio of (1-coefficients of lagged inflation)/coefficient of output gap.
6 The proxy of the Government bond rate could not be used due to absence of continuous data for full length of the time period of investigation. | ||||||
Demand for Credit | ||||||
Ln (NFCd) = 3.0092 - 0.2216Lnrl+0.3764 LnIIP + 0.3418 LnIIP (-1) + 0.2784 LnIIP (-2) + 0.4201Ln NFC (-12) |
(-5.85*) | (3.93*) | (3.32*) | (3.06*) | (7.87*) | |||||||
R2 = 0.99 DW = 0.33 | |||||||||||
Supply of credit: | |||||||||||
Ln rl = 3.9213 + 0.4143 LnNFC -0.07872 LnSLR(Dep)-0.0917LnBSEnat -0.5077 Ln[Dep(1-crr)] -0.0021 LnTB91 + 0.6804 Lnrl (-1) | ||||||
(1.73*) | (-0.70) | (-2.45*) | (-2.03*) | (-0.56) | (5.49*) | ||||||
R2 = 0.98 DW = 1.69 | ||||||
Index of Industrial Production: | ||||||
Ln IIP = - 0.2563 + 0.2338Ln NFC + 0.4556LnIIP(-1) | ||||||
(5.58*) | (4.90*) |
R2 = 0.95 DW = 2.1 | ||||||
where NFCd: non-food credit demand; rl: bank lending rate; IIP: index of industrial production; TB91: 91-day Treasury Bill yield; BSEnat: Bombay Stock Exchange National Index; Dep: bank deposits; crr: cash reserve ratio; SLR: statutury liquidity ratio. Bracketed figures represent t-statistics and * indicates significance at least at 10 per cent level. | ||||||
8 These issues were covered in detail in the Second Foundation Day Lecture on 'Autonomy of the Central Bank: Changing Customs in India' by Dr. Y.V. Reddy at the Indian Institute of Management at Indore on October 3, 2001.

شارك هذه الصفحة:


بھارت موبائل ایپلی کیشن کے ریزرو بینک کو انسٹال کریں اور تازہ ترین خبروں تک فوری رسائی حاصل کریں!
ہماری ایپ انسٹال کرنے کے لیے QR کوڈ اسکین کریں۔


صفحے پر آخری اپ ڈیٹ:


