 IST,
IST,


VI External Sector and The Growth Process
Foreign Capital Versus Export-Led Growth
The Debate on The Role Of Foreign Capital
Cross-Country Experience on Capital Flows and Growth
Capital Flows and Growth in India : The Recent Experience
An Empirical Appraisal
Concluding Observations
Introduction
6.1 Identifying the growth-augmenting role of external trade and foreign capital flows has assumed critical importance in India in recent years. The overall shift in the policy stance in India from export pessimism and foreign exchange conservation to one that assigns an important role to export of goods and services in the growth process has primarily been guided by the perception that an open trade regime could offer a dynamic vehicle for attaining higher economic growth. The absence of any strong and unanimous empirical evidence justifying the universal relevance of an export-led growth strategy (Giles and Williams, 2000; Rodriguez and Rodrik, 1999) as also the continued reliance on targets for sustainable current accounts has motivated greater focus on the growth augmenting capacity of foreign capital in the 1990s.
6.2 Structural reforms and external financial liberalisation measures introduced in the 1990s in India brought in their wake surges in capital flows as well as episodes of volatility associated with the capital account dictating the balance of payments outcome. Large capital inflows enabled an easing of resource constraints and an acceleration of growth in the mid-1990s. In the second half, the foreign exchange market developments as well as the rapid transmission of international sell-offs facilitated by cross border integration of equity markets via capital flows have provoked a reassessment of the benefits and costs of employing capital flows as a lever of growth. Throughout the 1990s, the role assigned to foreign capital in India has been guided by the considerations of financing a level of current account deficit that is sustainable and consistent with the absorptive capacity of the economy (Rangarajan, 1993; Tarapore, 1995; Reddy, 2000). In the aftermath of South-East Asian crisis, however, the need for further strengthening the capacity to withstand vulnerabilities has necessitated a shift in policy that assigns greater weightage to stability (Reddy, 2000). In view of the growing importance of capital flows in relation to trade flows in influencing the course of the exchange rate and the potentially large volatility and self-fulfilling expectations that often characterise capital flows, reserve adequacy has also emerged as an additional requirement for ensuring stable growth in the context of capital flows (Jalan, 2001). Given the trade-off between growth and instability associated with capital flows, the emphasis of the debate relating to capital flows in India has centered around sustainability, a country-specific approach to liberalisation of the capital account, a desirable composition and maturity profile of capital flows, and appropriate reserve management and exchange rate policies in the context of capital flows, with only occasional reference to the growth enhancing role of foreign capital in India.
6.3 The experience of developing countries with harnessing capital flows for growth over the last two decades has been mixed. The actual impact of capital flows on economic growth varies widely across countries, depending on country-specific conditions and the nature of policies for external capital. Accordingly, it becomes necessary to empirically evaluate each country's experience in terms of the specific role assigned to foreign capital in the process of development. This includes an assessment, however subjective, of the negative externalities associated with capital flows. Negative externalities could emanate both during periods of surges and sudden reversals. Besides real appreciation of the exchange rate, surges in capital flows could facilitate imprudent lending and overheating associated with excessive capacity addition, which may give rise to banking crises. Sudden reversals of capital flows, particularly in cases of short-term banking flows and portfolio flows, could trigger sudden collapse of asset prices and exchange rate and thereby adversely affect growth. This Chapter undertakes an empirical assessment of the contribution of foreign capital to the growth process in India. Macro-economic analysis weighing the role of foreign capital visa-vis exports (of goods and services) as a growth accelerator in a developing country context is presented in Section I. Section II encapsulates the important features of the role of foreign capital by drawing on the theoretical and empirical literature on the subject. Different viewpoints on the role of alternative forms of foreign capital and the changing importance of each form of capital over time are also discussed. Cross-country experiences, primarily based on review of the specific contributions to the relevant literature are documented in Section III. A brief overview of the Indian policy framework for attracting foreign capital during the period of planned development is set out in Section IV, with specific empirical findings presented in the context of the shifts in the policy regime. Section V undertakes an empirical evaluation of the salient testable hypotheses to identify the 'growth-augmenting' versus 'growth driven' characteristics of foreign capital, the degree of complementarity between foreign capital and domestic investment, and the relative importance of alternative determinants of foreign capital to obtain an assessment of the desired level of foreign capital consistent with policy objectives in the external sector. This is followed by concluding observations.
I. FOREIGN CAPITAL VERSUS EXPORT-LED GROWTH
6.4 The standard analysis of growth accounting in an open economy encounters an apparent contradiction between 'export led growth' on the one hand, and 'capital-flow induced growth' on the other, even though in reality both strategies could be operationalised simultaneously to strengthen the growth process. The apparent contradiction arises from the macro-economic identity [Y = C + I + G + (X - M)] which suggests that while a surplus in the external goods and services account - reflecting the result of an export-led growth strategy - could increase GDP, that would tantamount to no role for net external financing as the country must necessarily save more than it can invest, leading to net capital outflows. The underlying assumption behind this assessment is that an export-led growth strategy can stimulate growth only by generating a surplus in the external goods and services account. The actual external resource transfer process and the stages over which the importance of each form of transfer changes can explain how a developing country could simultaneously benefit from both export-led and capital-flow-induced growth strategies (Kregel, 2000).
6.5 In a developing country, the consumption level lags behind the consumption standards of advanced economies and the marginal productivity of investment is higher. A deficit in the goods and services account and the associated net capital inflows can not only enable the economy to bridge its consumption gap but also help in achieving output convergence with the advanced economies. An export-led growth strategy could enhance the ability of a developing country to achieve this goal faster by allowing higher levels of sustainable imports. Sustainable capital inflows to finance the gap so created would be growth enhancing. In small open economies, a surplus generated in the trade (for goods and services) account could raise GDP. Residents would increase their external financial assets, acquired in exchange of real resources through the trade surplus. Financial assets, in turn, represent command over future goods and services. An open capital account in such economies helps in allowing freedom of portfolio adjustment and consumption smoothing to each resident. Small open economies, however, depend largely on external demand conditions for sustaining the export-led growth. A slowdown in external demand conditions can give rise to a large scale deceleration in domestic GDP growth in such economies. For example, Singapore's external current account exhibited large surplus in recent years (in excess of 20 per cent of GDP) indicating the role of net exports in growth. However, given its high degree of openness and sensitivity of GDP growth to global demand conditions, its GDP growth is expected to decelerate sharply from 9.9 per cent in 2000 to (-) 0.2 per cent in 2001 (IMF, 2001).
6.6 Of the three possible types of resource transfers in the external account, viz., 'real against real', 'financial against real' and 'financial against financial', priority is generally assigned to 'real against real' form of resource transfers in the initial years of development. As a result, exports are regarded essentially as the means to pay for imports. Since the demand for certain critical real resources may exceed what could be made available domestically or what could be financed through export earnings, a bridging role emerges for financial transfers in the form of capital flows. With modest and gradually increasing recourse to 'real against financial' form of transfer, a role for foreign capital is envisaged. Only over time, 'financial against financial' form of transfers - representing an open capital account - can occur. Even though country-specific approaches to timing and sequencing often widely differ, three phases for debt related capital flows could be conceived (Chart VI.1). In the first phase, the country operates with a resource gap that is financed by inflows of debt capital. During this phase, debt grows faster than debt servicing. In the second phase, the country generates a positive resource balance (in the goods and services account) in the current account, but the debt servicing exceeds the positive resource balance, giving rise to further addition to debt stock. In phase three, the positive resource balance position becomes more than sufficient to finance the debt servicing obligations. As a result, residents accumulate external assets and the need for debt flows to finance the resource gap disappears (Simonsen, 1985).
|
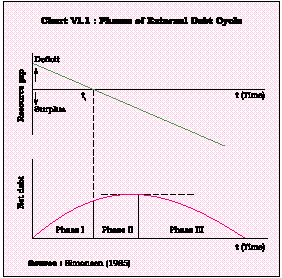
6.7 India could conceptualy be placed at present in phase-1 of this cycle. An export-led growth strategy - that ensures export growth to continuously exceed the interest rate on debt -would enable India to raise its per capita GDP to the threshold level beyond which generation of a surplus balance in the current account could enable the residents to accumulate foreign assets. A possible threshold level of per capita GDP for the developing countries in general could be about US $ 1,000 (Lane and Ferretti, 2001). As regards the developed country sample, for a 10 per cent improvement in a country's output per capita, net foreign assets to GDP ratio seemed to increase by 9 percentage points. In the sample for developing countries, however, the relationship was found to be negative, or at best modestly positive. This seems to explain why a number of developing countries which are operating at below the possible threshold level of per capita GDP tend to use higher external liabilities resulting from net capital inflows as a vehicle to raise their per capita income levels. Effective use of trade as an engine of growth could help India in achieving a faster transition to the next phase of the cycle while at the same time internalising the benefits of growth impulses associated with a more open trade regime (Box VI.1). Several countries have undertaken service-oriented trade strategies to take advantage of the underlying shift in the pattern of international trade as well as the gains associated with the new engine of growth (Box VI.2).
Foreign Trade and Growth - The Indian Experience
Perceptions on the role of foreign trade in growth have changed dramatically in the last five decades. During the 1950s and the 1960s import substitution-based industrialisation represented the dominant growth strategy pursued by several developing countries. In the 1970s, the growth experiences of individual countries led to scepticism regarding the virtues of import substitution. The resultant shift in policy stance in favour of outward-oriented trade strategies that started towards late 1970s gathered momentum in the subsequent years as a large number of cross-country studies validated the positive relationship between export growth and output growth. Some evidence demonstrating the superior growth performance of countries with export-oriented trade strategies is also available.
The theoretical arguments supporting an export-led growth strategy underscore that trade restrictions can reduce economic growth by distorting the pattern of resource allocation and by limiting the scope for innovation, technical progress and x-efficiency. Trade liberalisation, in turn, could contribute to economic growth by facilitating technology transmission, international integration of production and the associated possibility for reaping scale economies, reduction in price distortions and increase in efficiency. In imperfectly competitive markets, increased competition through trade could bring about welfare gains by reducing the deadweight losses stemming from monopolies and oligopolies. Trade liberalisation could be highly conducive to growth as import substitution inflicts static costs on the economy by way of resource misallocation as also dynamic costs by raising the incremental capital-output ratios and by depriving access to new technology.
In a number of studies, cross-country comparisons suggest a high degree of co-movement between export-growth and output-growth even though in empirical findings there is as yet no consensus. A positive export-GDP relation in several semi-industrialised countries is attributable to the contribution of export earnings in releasing the import constraint to growth. Standard methods of Granger causality tests may give misleading results if the role of imports is not duly recognised in the analysis of the relationship between export and growth. Controlling for the growth in imports and using the measure of conditional linear feedback, a causal relationship running from export growth is obtained in about 30 countries in a sample of 126 countries.
The Indian Experience
India pursued a restrictive import control regime up to the 1970s. Several studies indicate that the major drawbacks of the excessively inward looking trade regime was that it led to an inefficient and high cost industrial structure, which also adversely affected the prospects for export growth. Selective import liberalisation measures were introduced during the late 1970s. Trade policy measures undertaken during the 1980s sought to enhance the access of domestic manufacturers to imported capital goods and raw materials that were otherwise not available indigenously. Furthermore, the domestic industry was exposed to a limited degree of competition by placing selected items of imports under the open general licensing system. These policy measures were aimed at making the domestic industry cost efficient while simultaneously improving their international competitiveness. The tariff structure continued to remain somewhat complex with relatively higher tariff rates constraining growth by raising the cost of essential growth sensitive imports. Trade policy reforms undertaken during the 1990s included sharp reduction in customs tariffs, phasing out of the quantitative and other types of trade restrictions and alignment of trade policy with the international commitments. With a clear shift in emphasis from import substitution to export promotion, direct subsidies were replaced by indirect promotional measures, and reach of export incentives was widened to cover a number of non-traditional commodities. Reflecting the liberalisation of the trade regime, both exports and imports as percentage of GDP rose during the 1990s. The average export-import ratio (an indicator of the import financing capacity of exports) improved significantly from 64 per cent in the 1980s to around 85 per cent in the 1990s (Table 6.1). Empirical studies generally find some evidence for employing trade as an engine of growth in India. Comparative static effects of trade policy reforms using a Computable General Equilibrium (CGE) Model indicate that trade policy reforms in India could lead to efficiency-enhancing inter-sectoral factor movements and also scale economies in the manufacturing sectors. Trade reforms during the 1990s placed greater emphasis on improving external competitiveness and efficiency in resource allocation. Trade liberalisation is seen to have led to increased competition, reflected in the drop in the price-marginal cost mark-ups. The corporate response has been in terms of increased mergers and acquisitions, resort to foreign technology, efforts to improve manufacturing capability by building alliances as well as through in-house initiatives, product differentiation, increased advertising expenses and adoption of export-oriented growth strategies. Evidence on improvement of productivity of the Indian industry resulting partly from trade policy reforms is also found. Although the empirical debate on the growth effects of trade policy reforms remains unsettled, strong co-movement between exports and output growth in a liberalised trade environment appears to be the general case which lends support to the need for persisting with an open trade regime.
References
- Baldwin, Robert E (2000), 'Trade and Growth : Still Disagreement About the Relationship', OECD, Economics Department Working Papers, No. 264.
- Esfahani, H. S. (1991), 'Exports and Imports and Economic Growth in Semi-industrialised Countries', Journal of Developing Economies, 35 (1).
- Giles, J. A. and Cara L. Williams (2000), 'Export-led Growth: A Survey of the Empirical Literature and Some Non-causality Results', Econometrics Working Paper, EWP0001, University of Victoria, January.
- Krueger, Anne O. (1998), 'Why Trade Liberalisation is Good for Growth?' The Economic Journal, September.
- Rodriguez, Francisco and Dani Rodrik (1999), 'Trade Policy and Economic Growth: A Sceptic's Guide to the Cross-National Evidence', National Bureau of Economic Research Working Paper, No. 7081.
Trade in Services: An Engine of Growth
Since the 1980s, an important development in international trade has been the growing trade in services. This reflects partly the increasing importance of tertiary activities the world over. A far more important factor underlying the increased importance of services in international trade has been the revolution in information technology in the 1990s which has reduced the time as well as cost of transport and communication. As a result, services, hitherto considered as non-tradable, have entered the arena of tradability. The rapid rise in the share of the services sector in the structure of national economics as well as in world trade has been particularly beneficial for the developing economies given the labour-intensive nature of most services. The 1990s have, therefore, broadened the scope for diversification in favour of trade in services. Another factor providing an impetus to internationalisation of services has been the changing character of capital flows, particularly the shift towards private capital flows in the form of foreign direct investment flows. Service activities like banking and insurance have attracted increasing FDI investment worldwide. Reflecting the IT revolution, the share of IT goods in world trade has increased from 7.5 per cent in 1990 to 11 per cent in 1999. At the same time, the rapid growth of IT production and the use of IT-related services around the world have raised concerns about cross-border propagation of business cycles.
The orderly development of international trade in services was expected to be enhanced by the adoption of the General Agreement on Trade in Services (GATS) in 1993. The barriers to international trade in services, however, remain high and opaque. These barriers emerge from the fact that a large part of the services trade involves movement of labour and capital across borders, both of which continue to confront restrictions on movement. IMF estimates indicate that gains from liberalisation of services trade would be about US $ 1,181 billion, almost double the gains that would emanate from liberalisation of merchandise goods (US $ 677 billion), highlighting the welfare-enhancing potential of liberal trade in services (Table 6.2).
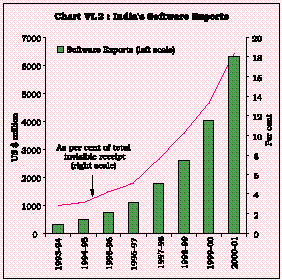
The general paradigm shift in services trade in the 1990s also helped in the emergence of new sources of forex earnings in the services account in India’s balance of payments, providing a significant source of comfort. While the period up to the 1980s was dominated by tourism earnings, the second half of the 1990s witnessed an unprecedented jump in India's earnings from newer activities like software service exports and other IT-related skill-intensive exports. Earnings from software exports have increased from negligible levels in early 1990s to US $ 6.3 billion in 2000-01, accounting for almost one-fifth of India's gross invisible earnings (Chart VI.2).
|
At the same time, remittances - the single most important source of India's invisible earnings - have continued to remain strong, growing more than 6-fold from US $ 2 billion at the start of 1990s to almost US $ 13 billion by 2000-01, forming 2.7 per cent of GDP (Chart VI.3).
|
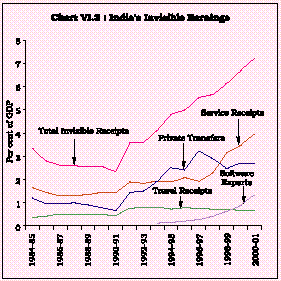
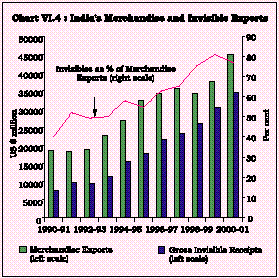
The increase in software and other technology earnings and private remittances has been able to more than offset outgoes on account of debt servicing and other services payments. The growth in gross invisible earnings has outpaced growth in merchandise exports during the 1990s, with the ratio of invisible earnings to merchandise increasing from 40 per cent in 1990-91 to almost 75 per cent in the recent years reflecting the shifting comparative advantage of India in favour of services (Chart VI.4). As a result, despite significant liberalisation of current account transactions, net invisible surplus has continued to improve during the 1990s. As against a deficit of US $ 0.2 billion in 1990-91 that partly exacerbated the external payments imbalances during that year, the net invisible surplus has grown over time to around US $ 12-13 billion in the recent period, imparting resilience and sustainability to current account deficits and overall balance of payments during the 1990s.
|
References
- Braga, Carlos A.P. (1996), 'The Impact of Liberalisation of Services on Developing Countries', Finance and Development, Volume 33, No. 1 (March).
- International Monetary Fund (2001), World Economic Outlook, October.
- Suave, Pierre and Robert M. Stern (ed.), 'GATS 2000: New Directions in Services Trade Liberalisation' Brookings Institution, Washington D.C.
II. THE DEBATE ON THE ROLE OF FOREIGN CAPITAL
6.8 Theoretical and empirical research on the role of foreign capital in the growth process have generally yielded conflicting results. Conventionally, the two-gap approach justifies the role of foreign capital for relaxing the two major constraints to growth (Chenery and Bruno, 1962; McKinnon, 1964). In the neo-classical framework, however, capital neither explains differences in the levels and rates of growth across countries nor can large capital flows make any significant difference to the growth rate that a country could achieve (Krugman, 1993). In the subsequent resurrection of the two-gap approach, the emphasis was generally laid on the preconditions that could make foreign capital more productive in developing countries. The important preconditions comprised presence of surplus labour and excess productive demand for foreign exchange. With the growing influence of the new growth theories in the second half of the 1980s that recognised the effects of positive externalities associated with capital accumulation on growth, the role of foreign capital in the growth process assumed renewed importance. In the endogenous growth framework, the sources of growth attributed to capital flows comprise the spillovers associated with foreign capital in the form of technology, skills, and introduction of new products as well as the positive externalities in terms of higher efficiency of domestic financial markets, improved resource allocation and efficient financial intermediation by domestic financial institutions (de Mello and Thea, 1995; Bailliu, 2000). Since the spillovers and externalities associated with different forms of foreign capital could vary, a pecking order approach to the composition of capital flows is often pursued which helps in prioritising the capital flows based on the growth enhancing role of each form of capital (Reisen, 2001; Razin, Sadka and Yuen, 1998).
6.9 The dominant view on what drives cross-border capital flows is that marginal productivity of capital is higher in a country where capital is scarce. If marginal productivity of capital widely differed across countries, then in the presence of capital flows shortfalls in domestic saving should not constrain investment. The seminal finding that domestic saving and investment rates are highly correlated, however, indicated that the degree of capital mobility across countries may not be high (Feldstein and Horioka, 1980). The marginal productivity of capital in India was 58 times that of the United States as obtained through the standard estimation of Cobb-Douglas production functions (Lucas, 1990; Taylor, 1994). India, however, could never attract enough foreign capital to take advantage of the productivity differentials. Unlike the wide differences in estimated productivity of capital, however, real interest rates - a measure of real return received by the investors - turned out to be much less divergent across countries in reality. Capital markets could be imperfect, preventing capital flows from being driven by productivity differentials. Incremental investment would be more productive in countries with skilled workforce and well developed physical infrastructure. Thus, the presence of internal growth supportive factors appear important, not only for attracting higher private foreign capital but also for enhancing the growth inducing effects of such foreign capital (Lucas, op cit). The importance of internal growth supportive factors is amply demonstrated by the extremely lopsided pattern of private capital flows to the emerging markets. About 12 emerging markets account for more than 80 per cent of the total private flows to all emerging markets (Box VI.3).
Pattern of Capital Flows to Emerging Markets
Capital flows to emerging markets over the last century have followed a boom-bust pattern, notwithstanding the large regional and compositional variations. The major boom in capital flows that started around 1870s continued till the outbreak of the First World War. This was the period of laissez faire, marked by significant international flows of goods, labour and capital across nations, mainly directed towards infrastructure, especially utilities and railroads. Most of the foreign investment during this period was long-term with about two-thirds in the form of portfolio flows and the remaining being in the form of direct investment. The weak communication infrastructure and information base led investors to prefer debt instruments. This is in sharp contrast to the late 20th century scenario when direct investment became extremely important, accounting for more than 50 per cent of the private capital flows in the 1990s. The boom ended with the onset of World War I. The ensuing years (1920-1931) saw a modest revival of capital flows, mostly to emerging market economies to meet their developmental goals.
The period from 1945 to 1972 was marked by large capital flows among different industrialised countries, with capital flowing to emerging markets only at the margin. The period since 1973, however, witnessed different phases: (1) 1973-82: boom in capital flows to developing countries averaging at about $163 billion per annum, (2) 1983-89: stagnation in capital flows at about $103 billion per annum, (3) 1990-97: dramatic surge in capital flows, with the peak of $ 344 billion in 1997, (4) 1997-1999: sharp deceleration in the aftermath of South East Asian crisis and (5) 2000-01: moderate recovery in 2000 but heightened uncertainty amidst global recessionary conditions and tendency for flight to safety.
1973-82 was the period of first two oil price shocks and the surge in capital flows during this phase was associated with the recycling of oil revenues. Bank loans to developing country governments, firms and banks were the main form of capital flows accounting for almost 57 per cent of total flows. Asia and Latin America received the maximum share. However, the worsening macroeconomic performance in the developing countries along with sluggishness of activity in mature markets turned the terms of trade against emerging markets. The emergence of debt servicing difficulties changed the scenario for the rest of the 1980s.
Between 1983 and 1989, capital flows to developing economies almost stagnated at around $105-110 billion, with private sector accounting for hardly one-third of these flows. While inappropriate economic policies kept the private investors away from developing countries, the developed financial markets of the industrialised countries acted as a powerful attraction for private capital. By the end of the decade, aggregate direct investment flows into developing countries were one-eighth of the flows into developed countries ($ 18.1 billion as against $ 161.2 billion). Portfolio flows were rather limited (practically zero), given the underdeveloped and non-existent nature of developing country equity markets. The disadvantages of contractual foreign capital as opposed to FDI became clearly evident during the external debt crisis of the 1980s. The earlier aversion to FDI - reflected in restrictive national FDI policies stipulating ownership norms, operational restrictions viz., positive, negative and restricted lists, performance requirements viz., export obligation - declined over time. In the competition to attract FDI, a combination of preconditions and incentive package assumed increasing importance in the liberalisation of FDI policy.
With better economic performance and relatively open capital accounts, the 1990s saw a return of capital flows to emerging markets to the pre-1914 levels. Net capital flows to developing economies surged from $ 80.5 billion in the late 1980s to $ 344 billion in 1997. The composition of flows, however, altered significantly over time. In 1991-92, for the first time since 1982, private flows exceeded official finance with their share rising from 42.6 per cent in 1990 to a peak of 90.1 per cent in 1996, before dropping to 82.1 per cent in 1999 (Chart VI.5). Also, equity flows (direct and portfolio) replaced the bonds of the gold standard era and the syndicated bank loans of the 1970s (Chart VI.6), reflecting growing securitisation and increasing role of institutional investors, trade liberalisation, financial deregulation, financial innovation and the technological revolution. This also reflected a growing preference on the part of developing countries for non-debt flows. Although portfolio inflows remained important, it is foreign direct investment (FDI) that showed a six-fold jump from about $ 35 billion in 1991 to $185 billion in 1999. The share of FDI in developing country's GDP rose from around 0.8 per cent to 2.5 per cent over the same period (Chart VI.7). Other private flows remained volatile. Official flows fluctuated around $ 50 billion with a significant fall in 1996 and 1997. On the recipient side, the share of private borrowers has increased dramatically from the last two decades. The private sector receives more than 65 percent of the total flows (a trend similar to the 1870-1913 period), unlike the other two period of surges (1920s and 1970s) when the share of the private sector had fallen to around 20 per cent. Asia and Latin America accounted for around 70 per cent of the total flows to emerging markets with Middle East and Sub Saharan Africa getting a minimal share (Chart VI.8). FDI occupied the dominant position for Asia while portfolio flows were more significant in Latin America.
|
|
|
It is generally believed that the boom in capital flows of the late 20th century can no way match the degree of integration that prevailed during the gold standard era. The current account surplus of the major creditor nations in the 20th century never exceeded 3-4 per cent of GDP, while during 1870-1913, Britain, the major lender, ran an average current account surplus of above 5 per cent of GDP. On the receiving side, the current account deficit of the borrowing countries during the late 19th century averaged 3.8 per cent, while it was around 2.3 per cent for the period 1993-97. As a percentage of the world total, foreign investment in developing economies was 45 per cent in 1914 as against only 22 per cent in 1992. Many other indicators also point towards deeper integration in the late 19th century as compared with the late 20th century (Eichengreen, 1998).
|
Following the financial crisis of 1997, private capital flows to emerging markets declined from a peak of $ 344 billion in 1997 to $ 280 billion in 1998 and further to $ 219 billion in 1999. The fall was particularly sharp for market-based flows (bank loans, bonds and equity) owing to uncertainty and risk aversion of investors following the South East Asian crisis. FDI continued its rising trend in absolute terms, though as a share in global FDI, it fell by almost half from 36.5 per cent in 1997 to 18.9 percent in 1999 and further to 15.9 per cent in 2000 (Chart VI.7). Concessional flows rose in 1997 reflecting increase in Japanese aid in response to the East Asian crisis.
Private capital flows to developing countries saw a modest recovery in 2000 to $ 257 billion; however, it still remains about 15 per cent below the peak 1997 level. For the first time in over a decade, FDI showed a decline though it still continues to be the dominant component of private capital in all regions. The slowdown in FDI was maximum in Asia and Western Hemisphere reflecting slowdown in mergers and acquisitions activity in Asia and completion of large-scale privatisation projects in Latin America. In 2000, there was a modest recovery in bond financing and bank lending commitments, though concerns over credit risks in developing countries remained high, as reflected in the rise in spreads and shortening of debt maturities since the crisis. Unlike FDI, portfolio flows have shown a rising trend for the past two years reaching $ 48 billion in 2000. However, with the growing linkages between emerging market and US market stock prices, equity flows are guided apparently less by diversification motives and remain concentrated in few countries - particularly Brazil, China, Mexico and Turkey - that received more than 80 per cent of the flows. The future scenario remains uncertain with the absence of any counter cyclical trend in capital flows to emerging markets as in the past.
References
- Bordo, M D., Barry Eichengreen, and Jongwoo Kim (1998), 'Was There Really an Earlier Period of International Financial Integration Comparable to Today?', NBER Working Paper, No. 6738.
- Chen Zhaohui and M.H. Khan (1997) 'Pattern of Capital Flows to Emerging Markets: A theoretical perspective', IMF Working Paper, No. 13, January.
- Nayyar Deepak (1995), ' Globalisation: The Past in Our Present', Presidential Address, 78th Annual Conference, Indian Economic Association, December.
- The World Bank, 'Global Development Finance', Several issues.
- United Nations Conference on Trade and Development (2001), 'Trade and Development Report'.
6.10 The role of relative prices and profitability of investment has been offered as an alternative explanation to the Feldstein and Horioka puzzle (Lal, 1991; Higgins, 1993; Taylor, 1994). The presence of factors such as technology and human capital can induce growth and attract capital flows to strengthen a virtuous cycle and show deviations from the Feldstein and Horioka findings. Corrected for relative prices (i.e., at domestic price of capital instead of at international price), the dispersion of the marginal product of capital across countries could be small. Disincentives to capital formation in the form of high prices of capital goods could also lower growth. Cross-country experience shows that high-income countries are generally more open to capital flows and more open economies benefit from capital flows if the internal sources of growth are strong and their past growth record is satisfactory.
6.11 In the recent period, studying the growth augmenting role of various forms of foreign capital has gained prominence over the general analysis. The findings of these studies can be conveniently grouped under the classification adopted in the analysis of the balance of payments in India. This would also reflect the current ordering of capital flows by type from the point of view of the policy stance (Reddy, 1998).
Foreign Direct Investment
6.12 Capital flows in the form of FDI have been widely believed to be an important source of growth in recent years. Since the 1970s, imperfections in goods and factor markets, presence of scale economies and government restrictions on output, trade and entry have come to be recognised as creating market structures where foreign capital in the form of FDI contributes to growth (Kindleberger, 1969; Hymer, 1976). It is eminently plausible that FDI flows might not have existed but for the presence of these imperfections. The theories of international resource allocation based upon the spatial distribution of factor endowments suggest the importance of 'locational advantages' as a key driver of FDI flows while the theories of organisation point to the role of 'ownership advantage' and the advantage of 'internalising intangible assets (like technology, brand name and marketing skills)'. Competitive policies of nations to attract FDI often work towards reducing the cost of production in a host country. Favourable tax treatment, protected domestic market and low labour costs represent the primary pull factors for FDI. Sound policies, strong and resilient financial systems and liberal exchange control norms also help in creating the congenial environment for augmented inflows under FDI.
6.13 Growth impulses originating from FDI are primarily ascribed to superior technology and greater competition that generally accompany FDI. Local firms of many developing host countries also do not invest enough on R&D to offer and sustain competition with Transnational Corporations (TNCs). Investment on R&D by TNCs in foreign affiliates is, however, found to be low, accounting for as little as 1 per cent of the total R&D investment even though TNCs are generally viewed as R&D intensive (UNCTAD, 1999). Despite the usual concerns that inappropriate technology is generally transferred to the foreign affiliates, empirical assessments suggest that technology - both public and private - that accompany FDI are complementary and inter-firm collaboration helps in augmenting growth. The public knowledge component of technology, representing blueprints and designs that can be codified in manuals and handbooks, can be transferred to the host country depending on the speed at which it is imitated and adapted by other local firms for development of local skills. The private part of the technology that is internalised by the parent, represents a key source of productivity differential across firms. In such cases also FDI may augment growth in a country if its initial technology gap is higher and openness to FDI is significant.
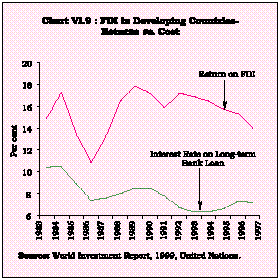
6.14 Whether FDI promotes competition or facilitates development of oligopolistic structures depends upon whether FDI crowds-out or crowds-in domestic investment. FDI can potentially displace domestic producers by preempting their investment opportunities. It is possible, however, that the adverse growth effect emanating from crowding-out could be more than offset by the increase in productivity resulting from advanced technology that often accompanies FDI. Whenever the technology is externalised, it may be transferred at a higher cost since it involves unbundling the package that FDI represents. FDI policies generally take into consideration the conditions that could crowd-in domestic investment. It is the attractiveness of the package that has expanded the appeal of FDI despite the fact that it could be one of the costliest forms of capital for a developing country (Chart VI.9).
|
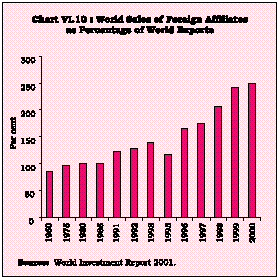
6.15 Since trade is an important vehicle for growth, FDI could also contribute to growth by promoting exports. For sustaining an export-led growth strategy, it becomes important to attain dynamic shifts in comparative advantage and FDI can play a major role in imparting the desired dynamism on account of its global marketing network. When capturing the host's market to reap scale advantage becomes the principal objective of TNCs, the expected contribution to dynamic comparative advantage of the host country may not materialise. The very fact that annual sales of foreign affiliates have outpaced total volume of global annual merchandise exports in the 1990s shows the growing importance of market access through FDI in relation to exports (Chart VI.10).
|
Portfolio Capital
6.16 Portfolio capital has emerged as the key channel for integrating capital markets worldwide. For developing countries, the growth process in the initial phase is often characterised by self financed capital investment, which is replaced gradually by bank-intermediated debt finance and supplemented over time by both debt and equity from the capital market. Portfolio capital flows can ease the constraint on growth imposed by illiquid and small sized capital markets in the early and intermediate stages of the growth process. Countries that reduced barriers to portfolio flows exhibit significant improvements in the functioning of their stock markets (Levine and Zervos, 1995). Greater liquidity in the capital market makes it possible to take up investment projects in developing countries that require lumpy and long-term capital. Equity, unlike debt, allows a permanent access to capital (Kunt and Levine, 1995).
6.17 Surges in portfolio flows can, however, adversely affect growth. Greater liquidity and opportunities for risk diversification may reduce household saving and excess volatility in the stock market may hinder investment. The problem of market imperfection and asymmetric information amplifies the volatility resulting from sudden shifts in the pattern of portfolio flows. Portfolio flows can hinder export promotion by exerting upward pressures on the exchange rate and also sustain an import-cum investment boom to overheat the economy. Unlike FDI, for the portfolio flows there is no one-to-one relationship with real investment. When portfolio activities are entirely concentrated in the secondary market, there is no direct link with real investment in the economy. At the macro level, portfolio flows finance the current account gap when alternative forms of foreign capital prove inadequate. Otherwise, it is only by enhancing the efficiency and liquidity of capital markets that portfolio flows can propel growth.
6.18 Despite the ambiguous effect of portfolio flows on growth, large portfolio flows have occurred in the 1990s. Institutionalisation of saving in the advanced economies - giving rise to preference for pooled funds held by pension funds, insurance companies, mutual funds and investment trusts - and the opportunity to diversify idiosyncratic risks in a global market for financial assets contributed to the increased cross-border flow of portfolio capital. Low correlation with equity returns on emerging market stocks during normal conditions and the associated prospect to maximise the benefit from diversification facilitated a shift in the pattern of capital flows to the emerging markets in favour of portfolio flows.
External Aid
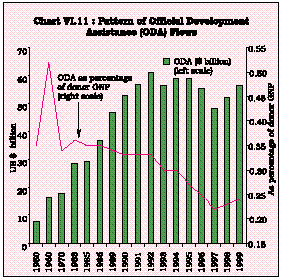
6.19 The role of external aid in enhancing growth has waned in recent years. In several developing countries, including India, public and publicly guaranteed capital flows have been supplanted by a growing recourse to private capital flows. In some countries, the problem of negative resource transfer associated with aid has emerged as an additional balance of payments/ growth constraint. Except for the poorest countries and those with very limited access to commercial capital, a general sense of aid fatigue has set in. Donors have also gradually deemphasised the role of aid in international economic relations resulting in a significant decline in aid flows as percentage of GDP of the donors since the 1960s (Chart VI.11).
|
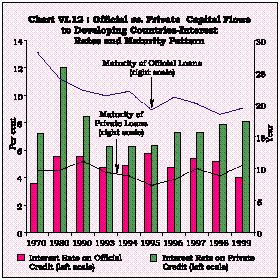
6.20 External aid was initially equated with the need for resource transfer to ease the financing constraint to growth. The major contradiction that surfaced soon was that while the poorest countries had the greatest need for external aid, their capacity to absorb foreign aid was highly unsatisfactory. In the 1980s, structural reforms were seen as the key to promote growth and the earlier project-linked aid strategy was supplemented by non-project linked structural adjustment lending as an additional instrument to augment growth. Structural conditionality then emerged as a contentious issue which created scope for weakened country ownership of programmes. Despite the element of high concessionality (zero rate of interest and repayment over fifty years for certain IDA assistance), the real cost of aid appeared to be high due to conditionality and the tied nature of aid. Aid has often been employed as an instrument of foreign policy. Past experience relating to possible debt forgiveness by donors has also accentuated the problem of moral hazard on the part of recipient countries. Some empirical evidence suggests that aid can crowd- out public expenditure in certain sectors and thereby adversely affect growth. Sustained aid dependence could, in fact, weaken the internal forces of growth (Potiowski and Qayum, 1992). Lack of sound policy environment in the aid receiving countries has operated as a major factor in eroding aid effectiveness (World Bank, 1998). Despite the general dissatisfaction with aid effectiveness, factors such as lower cost and higher maturity of aid in relation to commercial loans has encouraged many developing countries to maintain their access to aid flows (Chart VI.12).
|
6.21 An orderly transition from aid dependence to market access for foreign capital is being pursued by several developing countries. A number of countries have successfully accessed international markets and raised adequate levels of private capital to meet the financing gap. It is also being increasingly highlighted that 'more aid' policy should give way to 'more trade', requiring a change in the policy stance of the donors to liberalise their extant restrictions on exports from aid-receivers so as to allow them to reap the benefits of their true competitive advantage and in that process to reduce their dependence on aid.
Commercial Debt Capital
6.22 Commercial debt capital includes a whole range of sources of foreign capital where the overriding consideration is commercial, i.e. risk adjusted rate of return. External commercial loans could include bank loans, buyer's credit, supplier's credit, securitised instruments such as Floating Rate Notes and Fixed Rate Bonds, and commercial borrowings from the private sector window of multilateral financial institutions. The oil crisis of 1973 dramatically altered both the demand and supply conditions for commercial capital. The Organisation of Petroleum Exporting Countries (OPEC) experienced a 10 fold increase in their current account surplus in 1974 and their surplus positions remained large for the subsequent years. Oil-importing developing countries, in turn, experienced widening financing gaps. The surplus petro-dollars were recycled by the banks of the developed countries to the developing countries. Financing gaps of the oil-importing countries created and sustained the demand for the surplus international banking funds. The external debt crisis of 1982 brought about an interruption in banking capital flows to the developing world. The inadequate recognition of the vulnerabilities arising from interest rate and exchange rate risk exposures associated with foreign debt capital emerged as the key areas of concern. In the first half of the 1980s when the US dollar appreciated and international interest rates hardened significantly, debt servicing problems turned unsustainable. Many emerging economies, however, had to increase their dependence on commercial capital in the 1980s in the quest for higher growth, particularly in terms of access to critical imported capital goods and other inputs.
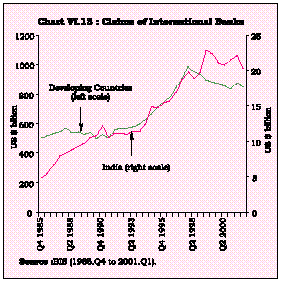
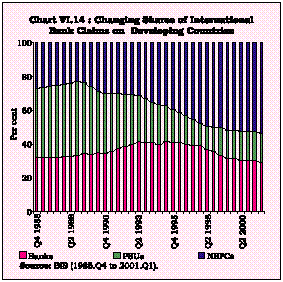
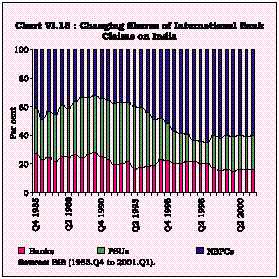
Cross-border bank lending - a major element of commercial borrowing - registered modest increase during the 1980s, gathering momentum in the 1990s (Chart VI.13). Structural changes were visible in the pattern of these flows reflecting the need for raising the productivity of banking capital flows by directing them to emerging markets. The most important change was in the form of large scale contraction in bank lending to public sector enterprises and a perceptible shift in favour of non-bank private corporates (NBPCs) (Charts VI.14 and VI.15).
|
|
|
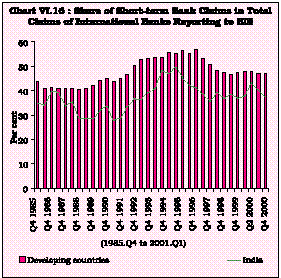
6.23 Commercial lending by banks in the past was given for general purposes under central government guarantees. Government guarantees had reduced the role for monitoring and there was a perception that 'governments cannot go bankrupt'(Aerni and Junge, 1998). In the aftermath of the debt crisis of 1982 when about 70 per cent of the private capital flows to developing countries was in the form of banking capital, it became important to address the problem of information asymmetry and the fear of non-performance of the debt contract within the legal jurisdiction of another country. Information asymmetry could be partly addressed by lending to the corporate sector through domestic banks and financial institutions. Local banks and institutions could monitor the individual borrowers better and also service small and medium clients for whom direct access to international lending could be limited and costly. Furthermore, non-performance of contracts by individual borrowers could shift the costs of opportunistic behaviour to the government and this would be reflected in reduced access to international capital for the country as a whole. These concerns underscored the relevance of monitoring of private debt by the national authorities. The fear of improper monitoring and the difficulties in collateralising cross-border loans have, however, resulted in a strong shift in the preference of lending banks for short-term loans (Chart VI.16)
|
6.24 In the aftermath of the East Asian crisis, it was recognised that even when banking capital to the private sector is used for raising domestic investment - not consumption - the growth enhancing capacity may be constrained by unproductive investment, addition of excess capacity and investment in sensitive sectors like real estate and stocks. Weak domestic banking systems and the nexus between banks and various influential interest groups can not only overheat the economy but also expose the economy to a large-scale loss of output and employment during a crisis. It became evident that even if banking capital does not directly flow to the public sector, credit allocation decisions of banks and financial institutions could be influenced to direct the flow of credit to favoured firms and industries at subsidised rates.
6.25 It is generally believed that the potential of banking capital in augmenting growth would be largely realised in a strong and resilient domestic financial system with effective supervision and regulation. Despite the diversification in the 1990s in favour of commercial borrowings from the market, loans from banks continue to dominate the commercial debt segment for the developing countries. At the end of March 2001, while the outstanding claims of international banks on developing countries was about US $ 856 billion, outstanding volume of capital raised through money market instruments and bonds and notes amounted to US $ 7.7 billion and US $ 450.7 billion, respectively. The advantage of raising longer-term debt capital to finance projects with large gestation period, particularly in the infrastructure sector has mainly driven the shift to market. Tighter entry norms, such as meeting internationally acceptable accounting/ auditing standards, disclosure of information and formal rating requirement, however, may not encourage many small and medium firms to access international bond markets despite having identified projects with growth opportunities. At the end of March 2001, the share of government and state enterprises in the total volume of capital raised through issuance of securities in both money and capital market was about 54 per cent as against the corporate sector's share of 32 per cent and financial institution's share of 14 per cent. This indicates that the shift in the composition of bank loans away from state enterprises has been partly offset by the market in the bond segment. The objective of linking commercial debt capital to direct production/trade activities that prompted the shift in the pattern of bank loans has, therefore, not been entirely achieved.
III. CROSS-COUNTRY EXPERIENCE ON CAPITAL FLOWS AND GROWTH
6.26 Empirical assessments of the causal relationship between capital flows and growth recognise the role of several factors. The extent to which the growth augmenting potential of foreign capital could be actually realised depends on the domestic business and policy environment of the receiving country. Lessons from the cross-country experiences have particularly been viewed as important due to the lack of any clear consensus on what could be the right approach to capital flows and also the absence of sufficient empirical research to establish the net positive impact of a liberalised capital account on growth. Growth regressions with various measures of international financial openness as determinants suggest either no statistically significant relationship between the two (Kraay, 1998; Rodrik, 1998) or that such results are obtained only for countries with higher income (Edwards, 2000), better-educated labour force ( Borensztein, et al., 1998), and well developed banking system (Bailliu,2000; Soto, 2000).
6.27 Simple correlation coefficients suggest that the association between capital flows and growth has strengthened in the last three decades, which in fact coincided with the growing influence of private capital flows as the principal vehicle of global integration (World Bank, 2001). The correlation coefficients rose from 0.09 in the 1970s to 0.13 in the 1980s and further to 0.28 in the 1990s. Correlation between capital flows and growth, however, reflects the effects of both capital deepening and capital productivity. The investment augmenting capacity of capital flows seems to have weakened with increasing cross-border integration of trade and finance. The earlier one-to-one association between private capital flows and domestic real investment has changed over time which is reflected in a lower order of increase in domestic real investment for every unit increase in capital flows. In view of the perceived weakening in the investment deepening effect of capital flows in the face of increasing correlation, it is possible to infer that productivity gains associated with foreign capital must have gone up in the 1990s.
6.28 A disaggregated assessment across different forms of foreign capital and across countries at different levels of development would have greater explanatory power in respect of global patterns. Empirical findings indicate that capital flows in the form of FDI and bank lending had significant and strong effects on domestic investment during 1979-95 (Bosworth and Collins, 1999). The impact of portfolio flows, however, turned out to be statistically insignificant, though positive. For the period 1972-98, the incremental impact in terms of raising both domestic investment and current account deficit was almost one-to-one in case of total capital flows. While long-term capital inflows exhibited a similar pattern, the impact of short-term flows was extremely weak. FDI flows exhibited close to one-to-one relationship, banking flows tended to raise domestic investment more than proportionately and current account deficits tended to deteriorate by more than the extent of inflows. The impact of portfolio flows on domestic investment was found to be modest and the current account position, in fact, improved. Sub-Saharan African region showed the strongest association between capital flows and investment, even more than the East Asian and the Pacific region. The association appeared to be marginal in case of Latin American and the Carribean countries (Table 6.3).
6.29 Portfolio flows and bank lending seem to perform better in countries with sound and deep financial markets. Greater exposure to portfolio capital flows is, however, associated with heightened volatility which may negate the growth enhancing effects of foreign capital. Controlling for the volatility effects, it is estimated that an increase in capital flows by 1 percentage point of GDP could give rise to an increase in per capita growth of 0.25 to 0.5 per cent. Countries with higher absorptive capacity benefit from foreign capital by raising investment and productivity. Human capital and infrastructure raise the absorptive capacity of a country which, in turn, helps in raising the productivity of foreign capital (World Bank , 2001).
6.30 In view of the direct one-to-one relationship between FDI and domestic investment, much of the empirical literature focuses on the growth-enhancing role of FDI. Causality tests have been employed to identify the 'growth induced' versus 'growth enhancing' aspects of FDI. On the other hand, studies on determinants of FDI help in ascertaining the importance of various determinants in attracting FDI. Other studies examine complementarities between FDI and domestic investment. Over the period 1970-96, evidence of significant crowding-in effects of FDI on domestic investment have been found for Asia and modest crowding-out effects for Latin America (Agosin and Mayer, 2000). For Africa, the link between FDI and domestic investment turns out to be one-to-one. For every incremental unit of FDI in Asia, domestic investment rose by 2.71 times that of the initial incremental FDI. Contribution of different forms of foreign capital have been evaluated using cross-section panel regressions so as to segregate best forms of foreign capital from the second best (Soto, 2000; Bailliu, 2000). In countries with better capitalised domestic banks, foreign banking capital may turn out to be growth enhancing.
6.31 Testing for the relevance of push and pull factors as determinants of capital flows using panel regressions yield results contrary to earlier findings (Hernandez et al, 2001). International interest rate movements may not play a major role in pushing capital to emerging markets. The pool of foreign capital available to the emerging markets as a whole appears to be one of the important determinants, implying that the prospect of getting foreign capital for an individual country could brighten when the size of the pool itself increases. Among the set of domestic determinants, investment rate and debt-service ratio turn out to be significant. There is also a shift in the significance of some of the determinants over time; as opposed to the real appreciation in the 1970s and early 1980s, growth in domestic bank credit appears to have emerged as the more dominant internal risk factor in the 1990s. The public sector deficit did not exhibit the generally expected negative association with capital flows, being financed by sovereign issues. The more revealing finding is that capital flows may not be constrained by restrictions on capital flows (interpreted as restrictions on payments for transactions and surrender/repatriation requirement on export proceeds). Capital controls are effective in changing the composition of flows but not the volume of total capital flows. Selective use of controls to alter the composition of inflows in favour of more stable and growth supportive forms of capital could raise the overall growth of the economy.
6.32 Interest rate differential is conventionally viewed as one of the key determinants of private capital flows. As national financial systems integrate, the effect of capital flows gets reflected in convergence of asset prices. While capital flows reflect the arbitrage process, asset prices reflect the outcome of arbitrage. A study on the determinants of debt and equity flows from the US to nine Latin American and nine Asian countries suggests that country-specific factors, particularly credit rating and black market exchange rate premium, appear to significantly influence the pattern of capital flows. The US interest rate turns out to be the single most important determinant for short-term debt flows (Taylor and Sarno, 1997). Global factors seem to dominate the importance of country-specific factors in respect of debt flows whereas country specific factors were seen to be more important in attracting equity flows.
IV. CAPITAL FLOWS AND GROWTH IN INDIA : THE RECENT EXPERIENCE
6.33 Capital flows into India have been predominantly influenced by the policy environment. Recognising the availability constraint and reflecting the emphasis on self-reliance, planned levels of dependence on foreign capital in successive Plans were deliberately held at modest levels (Table 6.4). Economy in the recourse to foreign capital was achieved through import-substitution industrialisation in the initial years of planned development. The possibility of exports replacing foreign capital was generally not explored until the 1980s. It is only in the 1990s that elements of an export-led growth strategy became clearly evident alongside compositional shifts in the capital flows in favour of commercial debt capital in the 1980s and in favour of non-debt flows in the 1990s. The approach to liberalisation of restrictions on specific capital account transactions, however, has all along been against any 'big-bang' (Box VI.4).
Role of Capital Controls in Stabilising the Growth Process
The debate centering around the perceived benefits of an open capital account, on the one hand, and the observed advantages of selective capital controls in stabilising the growth process, on the other, has prompted national authorities to undertake capital account liberalisation at varied pace and sequencing, depending on country-specific circumstances. A review of country experiences suggests that countries impose capital controls for a variety of reasons, i.e., to (a) protect infant industries - a second best solution whereby the authority introduces an off-setting distortion to correct some other pre-existing distortions that cannot be corrected otherwise; (b) increase the effectiveness of monetary policy; (c) limit exposure to risks (such as transfer risk, sovereign risk, and country risk); (d) avoid the costs of sterilisation; (e) limit the potentially destabilising effects of volatile capital flows; (f) enable monetary authorities to pursue managed exchange rate regimes; (g) reduce domestic financial system vulnerability by substituting for (absent or underdeveloped) prudential standards; (h) provide breathing space for entrenching the preconditions for an open capital account; and (i) restructure capital flows in favour of non-debt and longer maturity flows.
Capital controls, however, have certain negative implications. They may lead to inefficient allocation of resources with implications for productivity. Capital controls limit the substitutability between domestic and foreign assets and introduce a systematic wedge between domestic and foreign interest rates. Controls on outflows may depress domestic interest rates with adverse implications for domestic saving. Differential reserve requirements on banks' domestic vis-a-vis foreign currency liabilities are discriminatory, impairing the efficiency of monetary policy. By limiting adjustment to the quantity variable, the burden of adjustment of a shock on the investor's portfolio allocation results in increased volatility of the exchange rate/equity prices. Capital controls entail administrative costs, and render accessibility to desirable forms of foreign capital difficult and costly. Many countries have also resorted to capital controls as a soft option, preferring it to the implementation of difficult measures of financial sector reforms that would have otherwise proved beneficial in the long run. In significant measure, the resort to capital controls also reflects the gaps in the international financial architecture, which have made the resolution of capital account crises costly, inequitable and contagious.
Prior to the Asian crisis, the IMF generally discouraged imposition of capital controls. An implicit assumption in the exercise of its responsibility for international monetary and financial stability was that private sector capital markets usually do not 'get it wrong' in deciding the right amount and right composition of capital flows to a country. Accordingly, the IMF had recommended further improvements in market discipline to promote private capital flows (Goldstein and Mussa, 1993). Even as late as in October 1997, the Fund's World Economic Outlook had recommended further liberalisation of the capital account noting the linkage between 'rapid growth and large capital inflows'. Although developing countries may experience increased volatility, this should be managed without imposing capital controls with greater exchange rate flexibility to deal with such flows (IMF, October 1997). In the post South-East Asian crisis period, the IMF recognised the role of capital controls. The Fund's initial criticism of Malaysia's re-imposition of exchange and capital controls in September 1998 as an 'important set-back not only to that country's recovery and potentially to its future development, but also to other emerging market economies that have suffered from heightened investor fears of similar actions elsewhere' (IMF, October 1998) has undergone a progressive transformation with an acknowledgement that 'controls appear to have provided some breathing space in which to implement more fundamental reforms' (IMF, October 2001). Capital controls on short-term capital inflows by Chile to increase the potency of monetary policy also found favour with the IMF. It acknowledged the existence of 'important preconditions for an orderly liberalisation of capital movements' and also recognised the inability of the market participants to appropriately assess the risks of investing in emerging markets leading to excessive volatility in capital flows (IMF, 1998; Mussa, 2000). The IMF's current view on capital account liberalisation resembles the Indian approach. For countries with comparatively weak financial systems, maintenance of some restrictions on private capital flows (at least for some period of time) has been recognised as a desirable option.
Empirical studies find a weak positive relationship between international capital account liberalisation and growth. Potential benefits of liberalisation in the form of higher investment, technological spillovers and deeper financial markets may get offset by financial crises resulting in temporary, but large losses in output. These financial crises, associated with volatility in net capital flows, have increased during the 1990s, particularly for countries that experienced more rapid capital account liberalisation. Some evidence is available to support the view that stronger institutions increase the benefits from capital inflows; thus adequate financial regulation and supervision, by ensuring that domestic lending agencies do not undertake excessive risks, can prevent crises and output losses.
Capital controls cannot, however, be a permanent solution, nor a substitute for reforms. Further, effectiveness of controls also depends on the administrative capacity and the level of financial market development. Evidence as regards ability of capital controls to limit volatility and loss of growth is also mixed; unlike Malaysia which undertook structural reforms to strengthen the financial system, controls imposed by Russia, in the absence of adequate structural reforms, proved less effective. The IMF treats emerging market countries that have already significant involvement in international capital markets differently from both developing countries that are only partially involved in global capital markets and the poorest developing countries. The IMF, in general, recommends 'a slow and gradual approach to opening the capital account' if the preconditions of effective liberalisation are not in place. It underscores the importance of the creation of conditions and institutions that can encourage foreign capital.
The Indian Approach
India considers liberalisation of capital account as a process and not as a single event. While relaxing capital controls, India makes a clear distinction between inflows and outflows with asymmetrical treatment between inflows (less restricted), outflows associated with inflows (free) and other outflows (more restricted). Differential restrictions are also applied to residents vis-à-vis non-residents and to individuals vis-à-vis corporates and financial institutions. A combination of direct and market-based instruments of control is used, meeting the requirements of a prudent approach to management of the capital account. The control regime also aims at ensuring a well diversified capital account including portfolio investments and at changing the composition of capital flows in favour of non-debt liabilities and a higher share of long-term debt in total debt liabilities. Thus, quantitative annual ceilings on external commercial borrowings (ECB) along with maturity and end use restrictions broadly shape the ECB policy. Foreign direct investment (FDI) is encouraged through a progressively expanding automatic route and a shrinking case-by-case route. Portfolio investments are restricted to select players, particularly approved institutional investors and the NRIs. Short-term capital gains are taxed at a higher rate than longer-term capital gains. Indian companies are also permitted to access international markets through GDRs/ADRs, subject to specified guidelines. Capital outflows (FDI) in the form of Indian joint ventures abroad are also permitted through both automatic and case-by-case routes. The Committee on Capital Account Convertibility (Chairman: Shri S.S. Tarapore) which submitted its Report in 1997 highlighted the benefits of a more open capital account but at the same time cautioned that capital account convertibility (CAC) could cause tremendous pressures on the financial system. To ensure a more stable transition to CAC, the Report recommended certain signposts and preconditions of which the three crucial ones relate to fiscal consolidation, mandated inflation target and strengthened financial system. International developments, particularly the initiatives to strengthen the international architecture for dealing with the problems arising in the capital account of a country's balance of payments, would also influence the timing and sequencing of CAC in India.
References
- Edison, Hali J. and C.R. Reinhart (2000), ‘‘Capital Controls during Financial Crises: The Case of Malaysia and Thailand', Board of Governors of the Federal Reserve System, International Finance Discussion Papers No.662, December.
- International Monetary Fund, 'World Economic Outlook', various issues (October 1997, May 1998, October 1998, October 1999 and October 2001).
- Johnston, R.B. and N.T.Tamirisa (1998), 'Why do Countries Use Capital Controls?', IMF Working Paper No.181.
- Kaplan, Ethan and Dani Rodrik, (2000), 'Did the Malaysian Capital Controls Work?', Paper prepared for an NBER Conference on Currency Crises, December.
- Mussa, Michael and Morris Goldstein, (1993), 'The Integration of World Capital Markets,' in Changing Capital Markets: Implications for Monetary Policy, Federal Reserve Bank of Kansas City, Kansas City, Missouri.
- Mussa, Michael, (2000), 'Factors Driving Global Capital Market Integration', in Federal Reserve Bank of Kansas City, Kansas City, Missouri.
- Neeley, Christopher J. (1999), 'An Introduction to Capital Controls', in Federal Reserve Bank of St. Louis Review, St. Louis, November/December.
- Reddy, Y.V. (2000), 'Managing Capital Flows', in Monetary and Financial Sector Reforms in India: A Central Banker's Perspective, UBSPD, New Delhi.
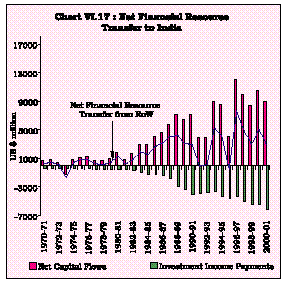
6.34 A large part of the net capital flows to India in the capital account is being offset by the debt servicing burden. As a consequence, net resource transfers have fluctuated quite significantly in the 1990s, turning negative in 1995-96 (Chart VI.17).
|
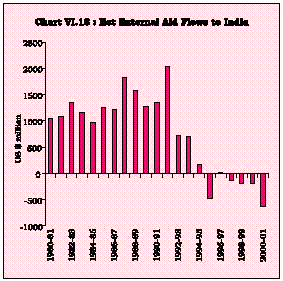
6.35 Till the early 1980s, the capital account of the balance of payments had essentially a financing function (Rangarajan, 1996). Nearly 80 per cent of the financing requirement was met through external assistance. Aid financed imports were both largely ineffectual in increasing the rate of growth and were responsible for bloating the inefficient public sector (Kamath, 1992). Due to the tied nature of bilateral aid, India had to pay 20 to 30 per cent higher prices in relation to what it could have got through international bidding (Riddell, 1987). The real resource transfer associated with aid to India, therefore, was much lower. There were occasions 'when India accepted bilateral aid almost reluctantly and without enthusiasm because of the combination of low priority of the project and the inflated price of the goods' (Lipton and Toye, 1989; Jha and Swaroop,2000). The environment for enhancing aid effectiveness has been highlighted as one of the key factors in the assessments of aid by donors, i.e., 'open trade, secured private property rights, the absence of corruption, respect for the rule of law, social safety nets, and sound macroeconomic and financial policies' (World Bank, 1980). The Report of the High Level Committee on Balance of Payments (1993) identified a number of factors constraining effective aid utilisation in India and underscored the need to initiate urgent action on both reducing the overhang of unutilised aid and according priority to externally aided projects in terms of plan allocations and budgetary provisions. Net resource transfer under aid to India, however, turned negative in the second half of the 1990s. (Chart VI.18).
|
6.36 In the 1980s, India increased its reliance on commercial loans as external assistance increasingly fell short of the growing financing needs. The significant pressures on the balance of payments as the international oil prices more than doubled in 1979-80 and the world trade volume growth decelerated sharply during 1980-82, triggered an expansion in India's portfolio of capital inflows to include IMF facilities, greater reliance on the two deposit schemes for non-resident Indians - the Non-Resident External Rupee Accounts (NRERA) (that started in 1970) and Foreign Currency Non-Resident Account (FCNRA) (that started in 1975) - and commercial borrowings on a modest scale. A few select banks, all-India financial institutions, leading public sector undertakings and certain private corporates were allowed to raise commercial capital from the international market in the form of loans, bonds and Euronotes. Indian borrowers received finer terms in the 1980s. Spreads over LIBOR for loans to India improved gradually from about 100 basis points in the early 1980s to about 25 basis points for PSUs (50 basis points for private entities) towards end of 1980s (Joshi, 1997). Maturities were elongated from seven years to ten years during this period. Debt sustainability indicators, particularly debt/GDP ratio and debt service ratio, however, deteriorated significantly during this period (Chart VI.19).
|

6.37 The policy approach to ECB has undergone fundamental shifts since then with the institution of reforms and external sector consolidation in the 1990s. Ceilings are operated on commitment of ECB with sub-ceilings for short-term debt. The ceiling on annual approvals has been raised gradually. The focus of ECB policy continues to place emphasis on low borrowing cost (by specifying the spread on LIBOR or US TB rates), lengthened maturity profile (liberal norms for above 8 years of maturity), and end-use restrictions.
6.38 Given the projected need for financing infrastructure projects, 15 per cent of the total infrastructure financing may have to come from foreign sources. Since the ratio of infrastructure investment to GDP is projected to increase from 5.5 per cent in 1995-96 to about 8 per cent by 2006, with a foreign financing of about 15 per cent, foreign capital of about 1.2 per cent of GDP has to be earmarked only for the infrastructure sector to achieve a GDP growth rate of about 8 per cent (Table 6.5).
6.39 NRI deposits represent an important avenue to access foreign capital. The policy framework for NRI deposits during 1990s has offered increased options to the NRIs through different deposit schemes and by modulation of rate of return, maturities and the application of Cash Reserve Ratio (CRR). In the 1990s, FCNR(B) deposit rates have been linked to LIBOR and short-term deposits are discouraged. For NRERA, the interest rates are determined by banks themselves. The Non-Resident (Non-Repatriable) Rupee Deposit [NR(NR)RD] introduced in June 1992 is non-repatriable, although interest earned is fully repatriable under the obligation of current account convertibility subscribed to in 1994. In the 1990s, NRI deposits remained an important source of foreign capital with the outstanding balances under various schemes taken together rising from about US $ 10 billion at the close of 1980s to US $ 23 billion at the close of 2001. Capital flows from NRIs have occasionally taken the form of large investments in specific bonds, i.e., the India Development Bond (IDB) in 1991, the Resurgent India Bond (RIB) in 1998 and India Millennium Deposits (IMD) in 2000.
1994-95 | 2000-01 | 2000-95 | 2005-06 | ||
Actual | Projected | Actual | Projected | ||
1 | 2 | 3 | 4 | 5 | |
1. | Gross Domestic | 25.2 | 29.4 | 23.3* | 31.5 |
Investment | |||||
(% of GNP) | |||||
2. | Current Account | 1 | 2.4 | 0.5 | 3 |
Deficit (% of GNP) | |||||
3. | Current Account | 3014 | 10586 | 2579 | 19814 |
Deficit (US $ million) | |||||
4. | Net Capital Account Surplus (US $ | ||||
million) | 7771 | 18760 | 9023 | 27311 | |
5. | Reserve Level | 20233 | 47660 | 42281 | 87259 |
(US $ million) | |||||
Source: India Infrastructure Report- Policy Imperatives for Growth and Welfare, GoI, 1996. | |||||
* | : 1999-2000 (QE) | ||||
6.40 The need for supplementing debt capital with non-debt capital with a clear prioritisation in favour of the latter has characterised the government policy framework for capital flows in the 1990s. The High-Level Committee on Balance of Payments recommended the need for achieving this compositional shift. A major shift in the policy stance occurred in 1991-92 with the liberalisation of norms for foreign direct and portfolio investment in India (Suma and Kapur, 2001).
6.41 The liberalisation process started with automatic approval up to 51 per cent for investment in select areas. Subsequently, the areas covered under the automatic route and the limits of investment were raised gradually culminating in permission for 100 per cent participation in certain areas (particularly oil refining, telecommunications, and manufacturing activities in Special Economic Zones). The requirement of balancing the dividend payments with export earnings which was earlier limited to a short list of 22 consumer goods items was completely withdrawn. Limit for FDI in projects relating to electricity generation, transmission and distribution has been removed. FDI in non-bank financial activities and insurance is also permitted. Restrictions on portfolio investment through purchase of both traded primary and secondary market Indian securities are also liberalised. As opposed to the earlier restriction permitting Non-Resident Indians (NRIs)/Overseas Corporate Bodies (OCBs) to acquire up to 1 per cent (individually) and up to 5 per cent (taken together) of paid-up capital of Indian companies, the overall ceiling was initially raised to 24 per cent for Foreign Institutional Investors (FIIs)/NRIs/OCBs while allowing investment by FIIs in September 1992. Subsequently, the aggregate limit was raised gradually and presently FII investment is permitted up to the sectoral cap/statutory ceiling as prescribed for FDI investment in different sectors, provided the general body of the respective firms takes a decision to that effect. Portfolio investment in Global Depository Receits(GDRs)/ American Depository Receits (ADRs)/ Foreign Currency Convertible Bonds (FCCBs) floated by Indian companies in international markets is also permitted.
6.42 Foreign investment responded favourably to the liberalised policy environment and the generalised improvement in macro-economic conditions. By 1993-94, FDI and portfolio flows taken together emerged as the most important source of external finance and non-debt flows exceeded net debt flows in the form of NRI deposits, external commercial borrowings and external assistance. Since then, foreign investment has remained as the most important form of external financing for India (Chart VI.20).
|
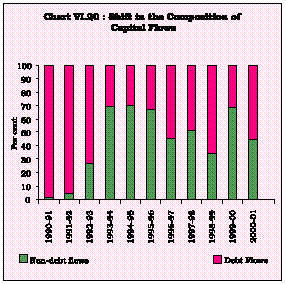
6.43 It is difficult to assess the direct contribution of these flows, particularly FDI, to the growth process. Anecdotal evidence suggests that foreign-controlled firms often use third-party exports to meet their export obligations (Athreye and Kapur, 2001). Another factor that contributes to widening the technology gap in FDI in India is the inappropriate Intellectual Property (IP) regime of India. Survey results for 100 US multinationals indicate that about 44 per cent of the firms highlighted the weak IP protection in India as a constraining factor for transfer of new technology to Indian subsidiaries. For investment in sectors like chemicals and pharmaceuticals, almost 80 per cent of the firms viewed Indian IP regime as the key constraining factor for technology transfer (Lee and Mansfield, 1996). Information collected from annual surveys of select Foreign Controlled Rupee Companies (FCRCs)/FDI companies on the export intensity of FCRC/FDI firms during the 1980s and the 1990s shows that these firms export only about 10 per cent of their domestic sales and the export-intensity has increased only modestly in the 1990s. It appears that the lure of the large size of the domestic market continues to be one of the primary factors causing FDI flows into India (Chart VI.21).
|
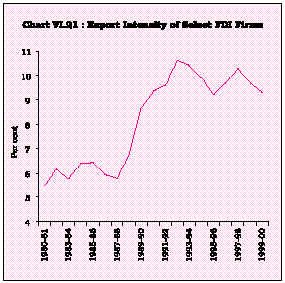
6.44 Spillover of positive externalities associated with FDI in the form of transfer of technology is also highlighted as another factor that could contribute to growth. The relationship between technology imports (comprising import of capital goods and payments for royalty and technical know-how fees) and domestic technology efforts in terms of R&D expenditure does not exhibit any complementarity (Chart VI.22). Foreign exchange spent on technology import as percentage of domestic expenses on R&D rather increased significantly in the 1990s in relation to 1980s, suggesting the use of transfer pricing mechanism to create a gap between the visible and invisible patterns of resource transfer. The share of imported raw materials in total raw materials used by FDI/ FCRC firms has, more or less, hovered around only 20 per cent (Chart VI.23). FDI firms, however, outperformed the overall growth in industrial production in the 1990s (Chart VI.24).
|
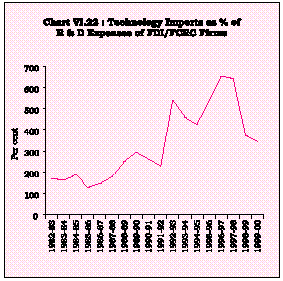
|
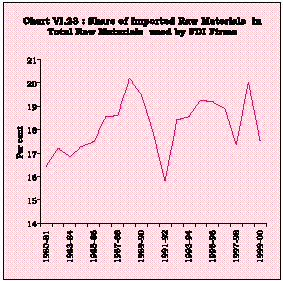
|
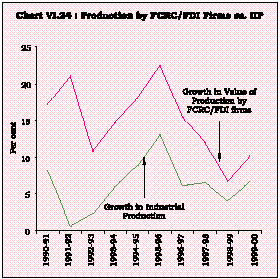
6.45 Testing for whether capital flows are 'growth driven' or 'growth augmenting' typically involves the identification of the direction of causality. Without reference to the possible existence of any structural relationship between capital flows and growth, Granger causality procedure helps in indicating as to whether the behaviour of one variable could be explained by the past behaviour of another variable. In that sense, the predictive potential of variables could be examined through such causality tests without any reference to the degree of causation or the channels through which this causation could materialise. Granger causality tests were conducted for the Indian economy for 'net capital flows' (NCF), 'net non-debt capital flows' (NDCF) and 'net debt creating capital flows' (DCF), all expressed as ratios of GDP and real GDP growth (GDPG), over 1970-2000. The results suggest that net capital flows 'Granger-cause' growth in GDP but the reverse causality does not hold statistically, implying that net capital flows may not be 'growth-driven' in India. Of the two major forms of foreign capital, it is only the non-debt creating flows that seem to Granger-cause GDP growth in India (Table 6.6).
6.46 The results of the causality tests can be verified against tests of 'complementarity' between foreign capital and domestic investment as also by estimating the determinants of capital flows in India. Estimates using the test suggested by Agosin and Mayer (2000) and the World Investment Report (1999) show evidence of 'crowding-in' effect of capital flows on domestic investment in India. Every dollar of capital inflow - whether in debt or non-debt form - raises domestic investment by more than one dollar, implying the presence of 'crowding-in' and the resultant increase in growth (Table 6.7 and Chart VI.25).
|
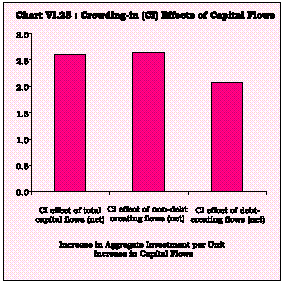
6.47 In the empirical assessment of the determinants of capital flows, both push and pull factors are generally used. Push factors such as international interest rates, world GDP growth, total availability of capital flows to all emerging markets, etc. are beyond the control of national authorities. Therefore, identifying the pull factors assume importance. Pull factors explaining the behaviour of capital flows broadly comprise strength, vulnerability and openness variables. Real GDP growth (GDPG) can be taken as a summary measure of the strength variable while gross fiscal deficit (GFD) can represent the vulnerability variable, and trade (export and import of goods) to GDP ratio as the openness indicator (OPENNESS). Estimates of capital flows to India obtained from this formulation reasonably track the actuals and results corroborate the findings of the causality tests. Real GDP growth turns out to be statistically insignificant as a determinant of capital flows to India. Both openness and fiscal deficit are significant. The positive relationship between fiscal deficit and net capital flows suggests that level of fiscal deficit has not discouraged capital flows into India. While external aid has traditionally been a source to finance the fiscal deficit, other debt creating flows improve the resource availability in the economy, facilitating financing of the deficit through domestic market borrowing. The positive relationship, therefore, essentially reflects the financing role of foreign capital. Trade openness seems to be a major determinant of capital flows as it reflects both the requirement to finance imports and the capacity of the country to service external liabilities through export earnings1.
6.48 The importance of openness and GFD as determinants of capital flows differs drastically for debt and non-debt creating flows. In case of non-debt creating flows, fiscal deficit seems to discourage inflows while it encourages greater recourse to external debt flows. Given the limited financing gap in the external current account, debt creating flows in excess of the financing gap improve the availability of resources domestically, facilitating recourse to greater internal borrowing by the government to finance the fiscal deficit. Thus, while in case of non-debt inflows the fiscal deficit could be a sign of vulnerability, in case of debt-creating flows the fiscal deficit could reflect the improved availability of resources brought about by the inflows from abroad. Expectedly, greater openness appears to be congenial for attracting non-debt flows. Debt flows, however, do not exhibit any statistically significant relationship with trade openness.
6.49 The literature suggests that among the determinants of debt and non-debt capital flows, the debt-service ratio (DSR) could be an important determinant. The debt service ratio shows a positive relationship with DCF, i.e., more debt flows are required to meet the higher debt servicing. The policy preference for attracting greater non-debt flows due to rising debt servicing burden explains the positive relationship with NDCF. Debt creating flows have also been regulated, particularly during periods of surges in non-debt flows, and therefore, DCF shows a negative relationship with NDCF of previous periods, indicating that debt flows are discouraged when excessive non-debt flows are received. DCF exhibits the expected positive co-movement with import-to GDP ratio, reflective of the import financing role of external debt capital. A dummy variable (DUM) capturing the three years in the last three decades when India had to approach IMF also turns out to be significant for DCF. Annual increase in foreign exchange reserves (DFOREXR) seems to have positively impacted upon NDCFs whereas nominal depreciation during the previous years (DEPR(-1)) seems to have discouraged NDCFs2.
6.50 With a view to examining the direct impact of capital flows on growth, the relationship between per capita GDP and foreign capital was estimated following the specification adopted in Soto (2000) and Bailliu (2000). Estimated coefficients indicate that log of per capita GDP (LPCGDP) exhibits positive and significant relationship with both gross domestic saving (GDS) rate and net capital flows (as percentage of GDP). Non-debt creating flows exhibit the strongest positive influence on per-capita GDP and even the impact of debt-creating flows appears to be higher than domestic saving. This suggests that domestic saving cannot relax the constraint to growth arising from non-availability of certain inputs and technology. Capital flows help in softening this constraint and while complementing domestic investment financed by domestic saving also enable realisation of higher growth that would have been difficult to achieve with domestic saving only3.
6.51 The empirical tests conducted in this section indicate that capital flows seem to have contributed to raising the economic growth in India even though the role of higher growth as a pull factor remains ambiguous and needs further verification. The 'growth augmenting' effects of capital flows also tend to weaken over time. Several countries have experienced one-step jumps in output growth in the aftermath of the initial surge in capital flows in many countries. In the subsequent period, capital inflows may continue to be large, but in relation to the peak growth achieved in the immediate post-surge period, their growth remains somewhat lower. In India, the surge in capital flows that started in 1993-94 was followed by a three-year period of above seven per cent real GDP growth. In the subsequent years, the average GDP growth was almost one percentage point lower even though the capital account remained in significant surplus in all these years. An event-study analysis depicted in Chart VI.26 shows that similar growth pattern was observed in a number of emerging market economies. With ‘t’ corresponding to the period of surge in the respective countries, GDP growth improved generally in the immediate post-surge period (t+1 to t+3) but fell subsequently.
|
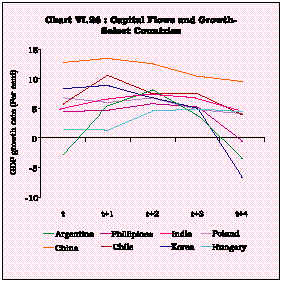
6.52 In the context of the evidences supporting the growth-augmenting role of foreign capital and the planned current account gap of 2.8 per cent of GDP during 2002-07 (CSO, 2001), an assessment of the disguised problem of scarcity of foreign capital for India in the 1990s assumes relevance. During the last decade (1992-2001), India's current account deficit as percentage of GDP averaged at about 1 per cent. Given a net capital inflow of about US $ 79 billion during this entire period and current account financing gap of only about US $ 36.5 billion, there was an accretion to foreign exchange reserves of about US $ 42.5 billion (excluding valuation effects). With a CAD to GDP ratio of about 2 per cent that is viewed as sustainable, the financing gap would have been close to US $ 75 billion. This implies that accretion to foreign exchange reserves could have been quite modest - only about US $ 4 billion instead of the actual of US $ 42.5 billion. In essence, there was a hidden shortfall of about US $ 38-40 billion during this period which did not exert any pressure due to the low absorptive capacity of the economy (as reflected in a current account gap of only about 1 per cent of GDP). In other words, in the eventuality of actual gap coming close to the sustainable level, fifty per cent more foreign capital than what actually came to India would have been required to reach the present level of foreign exchange reserves.
6.53 Financing of an average CAD of about 2.8 per cent of GDP as projected in the Approach Paper to the Tenth Five-Year Plan would require a minimum of a two-fold increase in the size of annual capital flows from the present level. Assuming that CAD of 2.8 per cent of GDP is attained in each of the five years and that reserves are maintained at about the 1990s average of at least six month cover for imports, the capital inflow requirement would have to rise from the present level of about US $ 10 billion to US $ 19 billion in the initial year of the Tenth Plan and further to about US $ 26 billion by the terminal year. The underlying assumptions driving these estimates are that GDP would actually grow at the projected 8 per cent with imports also growing at least at the same rate. If the average CAD/GDP of 2.8 per cent is attained gradually over the five year period (i.e. at 2.2, 2.4, 2.8, 3.2 and 3.4 per cent in the five years, respectively), then the capital inflow requirement would increase to about US $ 15 billion in the initial year of the Tenth Plan and further to about US $ 31 billion in the terminal year. Depending on the composition of capital flows and the possibility of an average import growth in excess of 8 per cent, reserve adequacy requirement could also raise the net capital inflow requirement even further. Besides the problem of availability of foreign capital, low absorptive capacity of the economy may pose another challenge during the Tenth Plan period. If both higher capital inflows and improved absorption are attained as planned, the sustainability of the growth process would critically hinge upon the export performance during the Plan period.
6.54 Capital flows have begun to play a significant role in India's growth dynamics. Evidence of strong complementarity with domestic investment suggests that capital flows brighten the overall investment climate and stimulate domestic investment even when a part of the capital flows actually gets absorbed in the form of accretion to reserves. Growth-augmenting role of foreign capital, however, seems to have been constrained by the low levels of actual and planned absorption of foreign capital in India.
6.55 External payments imbalances of the past have largely resulted from overshooting the sustainable level of current account deficit. A successful export-led growth strategy alone can raise the sustainable limit of external resource gap for India. Hence, despite the presence of strong evidence of complementarity with domestic investment, the extent of dependence on external financing cannot be raised significantly without endangering the risk of payments difficulties. The conservative approach to sustainable level of CAD needs to be reassessed in the light of the changes brought about in the 1990s in the composition of capital flows in favour of non-debt creating liabilities. While supplementing domestic saving with foreign capital, a somewhat higher level of sustainable level of CAD may appear feasible only if it is concurrently possible to augment the absorptive capacity and export performance of the economy. Against the backdrop of the problem of disguised scarcity of capital flows to India in the 1990s, achieving a minimum of two fold increase in net capital flows from its present level would be essential to meet the Tenth Plan growth projections.
NCF | = | -1.39 + 0.02 GDPG | + 0.10 OPENNESS | + 0.26 GFD | |||||
(0.54) | (3.08)* | (3.17)* | R2 = 0.52, DW = 1.70 | ||||||
DCF | = | -0.62 + 0.02 GDPG | - 0.02 OPENNESS | + 0.33 GFD | |||||
(0.47) | (-0.54) | (4.71)* | R2 = 0.43, DW = 1.73 | ||||||
NDCF= | -0.80 + 0.006 GDPG | + 0.11 OPENNESS | - 0.08 GFD | ||||||
(0.33) | (7.62)* | (-2.09) ** | R2 = 0.69, DW = 1.15 | ||||||
DCF | = | -1.11 + 0.05 DSR (-1)- 1.31 DUM + | 0.20 MGDP(1)-1.02 NDCF(-1) | ||||||||||
(4.55)* | (-4.77)* | (3.81)* | (-4.26)* | R2 = 0.69, DW = 2.23 | |||||||||
NDCF = | -1.05 + 0.12 OPENNESS - 0.12 GFD + 0.006 DFOREXR + 0.02 DSR - 0.07 DEPR (-1) | ||||||||||||
(7.78)* | (-2.48)* | (2.83)* | (1.82)*** | (-2.19)** | R2 = 0.80, DW = 0.85 | ||||||||
LPCGDP | = 7.65 + 0.05 GDS + 0.09 NCF | ||||||||||||
(5.79)* | (3.13)* | R2 = 0.77, DW = 0.55 | |||||||||||
LPCGDP= 7.85 + 0.04 GDS + 0.18 NDCF + 0.07 DCF | |||||||||||||
(4.43)* | (3.61)* | (2.41)* | R2 = 0.80, DW = 0.74 | ||||||||||
*, **, *** imply significance at 1%, 5% and 10% level, respectively | |||||||||||||

شارك هذه الصفحة:


بھارت موبائل ایپلی کیشن کے ریزرو بینک کو انسٹال کریں اور تازہ ترین خبروں تک فوری رسائی حاصل کریں!
ہماری ایپ انسٹال کرنے کے لیے QR کوڈ اسکین کریں۔


صفحے پر آخری اپ ڈیٹ:


