India’s balance of payments position during the first quarter of 2008-09 (April-June) reflected a widening of the current account deficit and moderation in capital flows. Merchandise trade deficit recorded a sharp increase during April-August 2008 on account of sustained increase in demand for oil imports. Net surplus under invisibles remained buoyant, led by increase in software exports and private transfers. The large increase in merchandise trade deficit led to a significant increase in the current account deficit over its level during April-June 2007. Net capital inflows have remained volatile during 2008-09 so far. While foreign direct investment into India increased during April-August 2008, portfolio investments showed an outflow during April-October 2008 (up to October 10, 2008). During 2008-09 so far (up to October 10, 2008), foreign exchange reserves declined by US $ 35.7 billion over end-March 2008.
International Developments
The global economy, which expanded by 5.0 per cent in 2007 (5.1 per cent in 2006), has been under significant stress during 2008 so far on account of sustained financial crisis that erupted in August 2007 and a surge in energy and other commodity prices. After four years of continuous strong expansion, global activity is slowing down significantly. Many advanced economies are experiencing recessionary conditions while growth in emerging market economies is also weakening. The financial crisis that first erupted with the collapse of the US subprime mortgage has deepened further during the last six months and entered a new turbulent phase in September 2008, which has severely affected confidence in global financial institutions and markets. According to the projections released by the International Monetary Fund (IMF) in October 2008, global economic activity is estimated to soften further in the second half of 2008 and early 2009 before gradual recovery takes place later in 2009. Slowdown has been witnessed in both advanced as well as emerging market economies in the second quarter of 2008. All major advanced economies like Euro area, Japan, Korea, the UK, the US and OECD countries registered decelerated growth rates in the second quarter of 2008 as compared to those during the first quarter of 2008 (Table 51). The deceleration in growth was also exhibited by emerging and developing economies like Argentina, China, India, Malaysia and Thailand during the second quarter of 2008.
The IMF has projected the US economy to grow by 1.6 per cent in 2008 (2.0 per cent in 2007). The US economy has been severely impacted by the direct effects of the financial crisis that originated in its subprime mortgage market, though aggressive policy easing by the Federal Reserve, a timely fiscal stimulus package, and a strong export performance on the back of a weakening US dollar have helped to cushion the impact of the financial crisis in the second quarter of 2008. According to the IMF, the US economy may contract during the final quarter of 2008 and the first quarter of 2009, as support from fiscal stimulus ebbs, export momentum moderates and tight financial conditions lead to more problems. The IMF expects the US economy to stabilise in the second quarter of 2009 and then recover gradually. The key factors that will determine short-term outlook include effectiveness of recent government initiatives to stabilise financial market conditions, the behaviour of US households in the face of rising stress, the depth of housing cycle and the extent to which inflation concerns constrain monetary policy. The IMF projections envisage a significant slowdown in growth in the Euro area to 1.3 per cent in 2008 from 2.6 per cent in 2007 mainly on account of higher oil prices, tightening credit conditions, housing downturns in several economies and the US slowdown. A very gradual recovery is expected only during the second half of 2009. The growth momentum in Japan is projected to decelerate to 0.7 per cent in 2008 (2.1 per cent in 2007) on account of slowing exports, expected further weakening of domestic demand and slowing down of private investment.
Table 51: Growth Rates - Global Scenario |
(Per cent) |
Region/Country |
2006 |
2007 |
2008P |
2009P |
2007 |
2008 |
|
|
|
|
|
Q1 |
Q2 |
Q3 |
Q4 |
Q1 |
Q2 |
1 |
2 |
3 |
4 |
5 |
6 |
7 |
8 |
9 |
10 |
11 |
Advanced Economies |
|
|
|
|
|
|
|
|
|
|
Euro area |
2.8 |
2.6 |
1.3 |
0.2 |
3.2 |
2.6 |
2.6 |
2.1 |
2.1 |
1.4 |
Japan |
2.4 |
2.1 |
0.7 |
0.5 |
3.2 |
1.8 |
1.7 |
1.6 |
1.2 |
0.7 |
Korea |
5.1 |
5.0 |
4.1 |
3.5 |
4.0 |
4.9 |
5.1 |
5.7 |
5.8 |
4.8 |
UK |
2.8 |
3.0 |
1.0 |
-0.1 |
2.9 |
3.0 |
3.3 |
2.9 |
2.4 |
1.5 |
US |
2.8 |
2.0 |
1.6 |
0.1 |
1.3 |
1.8 |
2.8 |
2.3 |
2.5 |
2.1 |
OECD Countries |
2.9 |
2.5 |
1.8 |
1.7 |
2.7 |
2.5 |
2.9 |
2.6 |
2.5 |
1.9 |
Emerging Economies |
|
|
|
|
|
|
|
|
|
|
Argentina |
8.5 |
8.7 |
6.5 |
3.6 |
8.0 |
8.7 |
8.8 |
9.1 |
8.3 |
7.5 |
Brazil |
3.8 |
5.4 |
5.2 |
3.5 |
4.4 |
5.4 |
5.6 |
6.2 |
5.9 |
6.1 |
China |
11.6 |
11.9 |
9.7 |
9.3 |
11.1 |
11.9 |
11.5 |
11.2 |
10.6 |
10.1 |
India |
9.6 |
9.0 |
7.9 |
6.9 |
9.7 |
9.2 |
9.3 |
8.8 |
8.8 |
7.9 |
Indonesia |
5.5 |
6.3 |
6.1 |
5.5 |
6.1 |
6.4 |
6.5 |
6.3 |
6.3 |
6.5 |
Malaysia |
5.8 |
6.3 |
5.8 |
4.8 |
5.5 |
5.7 |
6.7 |
7.3 |
7.1 |
6.3 |
Thailand |
5.1 |
4.8 |
4.7 |
4.5 |
4.2 |
4.3 |
4.8 |
5.7 |
6.1 |
5.3 |
P : IMF Projections.
Note : Data for India in columns 2 and 3 refer to fiscal years 2006-07 and 2007-08, respectively.
Source : International Monetary Fund; The Economist; and the OECD. |
The emerging and developing economies have not decoupled from this downturn. Growth projection for developing Asia by the IMF is placed at 8.4 per cent for 2008 as against 10.0 per cent in 2007 as domestic demand, particularly investment and net exports have moderated (Table 52). Though commodity-exporting countries have gained from the still-high export prices, countries with strong trade links with the US and Europe are slowing down markedly. Also, countries relying on bank-related or portfolio flows to finance large current account deficits have been adversely affected by strong risk aversion, deleveraging and the consequent shrinkage in external financing. Nevertheless, growth in emerging Asia during the second quarter of 2008 was led by China and India. GDP in China eased to 10.1 per cent in the second quarter of 2008 from 11.9 per cent during the corresponding period of the preceding year partly due to slowing of exports. The IMF has projected that growth in China would moderate to 9.7 per cent in 2008 (11.9 per cent in 2007). In India, growth during the second quarter came down to 7.9 per cent upon weakening of investment though private consumption and exports have performed well so far. According to IMF, India’s GDP would grow by 7.9 per cent during 2008.
Table 52 : Select Economic Indicators - World |
Item |
2002 |
2003 |
2004 |
2005 |
2006 |
2007 |
2008P |
2009P |
1 |
2 |
3 |
4 |
5 |
6 |
7 |
8 |
9 |
I. |
World Output
(Per cent change) # |
2.8 |
3.6 |
4.9 |
4.4 |
5.1 |
5.0 |
3.9 |
3.0 |
|
|
|
(1.9) |
(2.7) |
(4.0) |
(3.4) |
(3.9) |
(3.7) |
(2.7) |
(1.9) |
|
i) |
Advanced Economies |
1.6 |
1.9 |
3.2 |
2.6 |
3.0 |
2.6 |
1.5 |
0.5 |
|
ii) |
Other Emerging Market and |
|
|
|
|
|
|
|
|
|
|
Developing Countries |
4.8 |
6.3 |
7.5 |
7.1 |
7.9 |
8.0 |
6.9 |
6.1 |
|
|
of which: Developing Asia |
6.9 |
8.2 |
8.6 |
9.0 |
9.9 |
10.0 |
8.4 |
7.7 |
II. |
Consumer Price Inflation
(Per cent) |
|
|
|
|
|
|
|
|
|
i) |
Advanced Economies |
1.5 |
1.8 |
2.0 |
2.3 |
2.4 |
2.2 |
3.6 |
2.0 |
|
ii) |
Other Emerging Market and |
|
|
|
|
|
|
|
|
|
|
Developing Countries |
6.8 |
6.6 |
5.9 |
5.7 |
5.4 |
6.4 |
9.4 |
7.8 |
|
|
of which: Developing Asia |
2.1 |
2.6 |
4.1 |
3.8 |
4.2 |
5.4 |
7.8 |
6.2 |
|
|
|
|
|
|
|
|
|
|
|
III. Net Capital Flows* (US $ billion) |
|
|
|
|
|
|
|
|
|
i) |
Net Private Capital Flows (a+b+c)** |
77.1 |
162.5 |
236.5 |
248.7 |
223.0 |
632.8 |
528.6 |
286.6 |
|
|
a) Net Private Direct Investment |
156.6 |
166.2 |
189.0 |
261.8 |
246.0 |
379.0 |
443.6 |
414.6 |
|
|
b) Net Private Portfolio Investment |
-91.9 |
-13.0 |
12.7 |
-20.4 |
-107.3 |
54.5 |
-6.6 |
-89.1 |
|
|
c) Net Other Private
Capital Flows |
12.4 |
9.2 |
34.8 |
7.3 |
84.4 |
199.5 |
91.8 |
-38.7 |
|
ii) |
Net Official Flows |
-1.0 |
-50.5 |
-71.1 |
-109.9 |
-158.0 |
-140.7 |
-158.6 |
-135.4 |
IV. World Trade @ |
|
|
|
|
|
|
|
|
|
i) |
Volume |
3.5 |
5.4 |
10.7 |
7.6 |
9.3 |
7.2 |
4.9 |
4.1 |
|
ii) |
Price Deflator |
1.2 |
10.4 |
9.7 |
5.6 |
5.0 |
8.1 |
15.3 |
0.2 |
V. |
Current Account Balance
(Per cent to GDP) |
|
|
|
|
|
|
|
|
|
i) |
US |
-4.4 |
-4.8 |
-5.3 |
-5.9 |
-6.0 |
-5.3 |
-4.6 |
-3.3 |
|
ii) |
China |
2.4 |
2.8 |
3.6 |
7.2 |
9.4 |
11.3 |
9.5 |
9.2 |
|
iii) |
Middle East |
4.7 |
8.3 |
11.7 |
20.0 |
21.1 |
18.4 |
22.9 |
17.1 |
P : IMF Projections.
# : Growth rates are based on exchange rates at purchasing power parities.
Figures in parentheses are growth rates at market exchange rates.
* : Net capital flows to emerging market and developing countries.
** : On account of data limitations, flows listed under ‘Net private capital flows’
may include some official flows.
@ : Average of annual percentage change for world exports and imports of goods and services.
Source : World Economic Outlook (October 2008), International Monetary Fund. |
Going forward, financial conditions are likely to remain fragile, constraining global growth prospects. The IMF has projected global growth to moderate to 3.9 per cent in 2008 from 5.0 per cent in 2007. A gradual recovery is expected to take hold later in 2009. Financial markets are expected to remain under stress throughout 2008 and 2009. There are substantial downside risks to the global growth outlook, which relate to two concerns, viz., financial stress could remain very high and credit constraints from deleveraging could be deeper and more protracted than envisaged. Additionally, US housing market deterioration could be deeper and more prolonged than forecast, and European housing markets could weaken more broadly. Factors that would help in reviving the global economy in 2009 include expected stabilisation in commodity prices, a turnaround in the US housing sector after finally reaching the bottom and support from continued robust demand in many emerging economies despite some cooling of their momentum. Policy makers face the major challenge of stabilising global financial markets, while nursing their economies through a period of slower growth and keeping inflation under control.
According to projections made by the IMF, growth in world trade is expected to moderate to 4.9 per cent in volume terms in 2008 from 7.2 per cent in 2007 (see Table 52). Exports of emerging and developing economies are projected to grow by 6.3 per cent in 2008 (9.5 per cent a year ago), while those of advanced countries are expected to grow by 4.3 per cent (5.9 per cent a year ago).
According to the IMF’s International Financial Statistics, world merchandise exports, in US dollar terms, during the first five months of 2008 (January-May) increased by 23.4 per cent from 14.0 per cent during the corresponding period a year ago. Exports from emerging and developing economies recorded a growth of 25.8 per cent (15.3 per cent during January-May 2007), while that of industrial countries grew at an accelerated rate of 21.5 per cent from 13.0 per cent during January-May 2007 (Table 53).
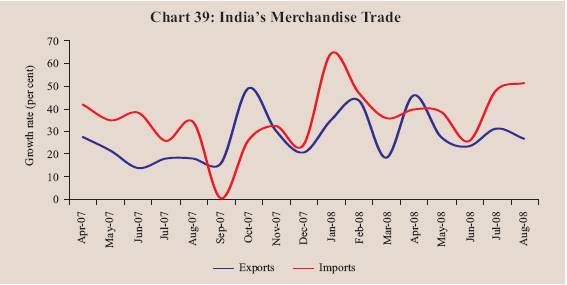
Merchandise Trade
According to the provisional data released by the Directorate General of Commercial Intelligence and Statistics (DGCI&S), India’s merchandise exports recorded a growth of 35.3 per cent during April-August 2008, which was higher than that of 19.3 per cent during April-August 2007 (Chart 39). Imports during April-August 2008 grew by 38.0 per cent, higher than the growth of 34.2 per cent recorded a year ago. Petroleum, oil and lubricants (POL) imports grew significantly by 60.0 per cent during April-August 2008 as against 17.9 per cent during April-August 2007, largely due to the escalation in international crude oil prices. Non-oil imports at US $ 84.5 billion showed moderation in growth to 28.3 per cent from 42.7 per cent a year ago (see Table 57).
Table 53: Growth in Exports - Global Scenario |
(Per cent) |
Region/Country |
2006 |
2007 |
2007 |
2008 |
|
|
|
|
January-May |
1 |
2 |
3 |
4 |
5 |
World |
15.3 |
15.0 |
14.0 |
23.4 |
Industrial Countries |
12.4 |
13.6 |
13.0 |
21.5 |
Emerging and Developing Economies |
19.1 |
16.8 |
15.3 |
25.8 |
China |
27.2 |
25.6 |
27.8 |
22.9 |
France |
9.9 |
12.0 |
10.7 |
21.6 |
Germany |
14.7 |
18.5 |
20.7 |
22.6 |
India |
21.4 |
20.3 |
18.7 |
33.4 |
Indonesia |
18.3 |
16.8 |
15.7 |
27.1 |
Japan |
9.2 |
9.2 |
5.6 |
25.2 |
Korea |
14.4 |
14.2 |
14.3 |
21.2 |
Malaysia |
14.0 |
9.6 |
8.0 |
24.0 |
Singapore |
18.4 |
10.1 |
9.5 |
23.7 |
Thailand |
18.5 |
16.8 |
16.8 |
22.1 |
US |
14.7 |
12.2 |
11.0 |
17.7 |
Source :
International Financial Statistics, International Monetary Fund; DGCI&S for India. |
Commodity-wise data available for April-May 2008 show that there was an across-the-board acceleration in the exports of major commodity groups with the exception of petroleum products and gems and jewellery. Exports of primary products recorded an accelerated growth of 69.8 per cent in April-May 2008 (10.9 per cent in April-May 2007) on account of substantial increase in the export of agricultural and allied products such as raw cotton, oil meal and sugar and molasses (Table 54). Among manufactured goods, engineering goods exports increased by 50.7 per cent (29.8 per cent a year ago) and exports of chemicals and related products grew by 26.0 per cent (16.7 per cent). Exports of textiles and textile products witnessed a significant turnaround in April-May 2008, recording a growth of 20.1 per cent as against a decline in exports in April-May 2007 (-0.5 per cent).
Destination-wise, the UAE emerged as the single largest export market for Indian products during April-May 2008 with a share of 10.4 per cent, marginally ahead of the US (10.3 per cent), which has generally been the single largest export destination for India for several years. The other major export markets were Singapore (6.2 per cent), China (6.0 per cent) and the UK (4.2 per cent). Exports to EU, North America, OPEC and Asian developing countries exhibited accelerated growth, while exports to African developing countries decelerated during April-May 2008 (Table 55).
Table 54: Exports of Principal Commodities |
Commodity Group |
US $ billion |
Variation
(per cent) |
|
2007-08 |
2007-08R |
2008-09P |
2007-08 |
2007-08 |
2008-09 |
|
|
April-May |
|
April-May |
1 |
2 |
3 |
4 |
5 |
6 |
7 |
1. Primary Products |
27.1 |
3.2 |
5.5 |
37.5 |
10.9 |
69.8 |
of which: |
|
|
|
|
|
|
|
a) |
Agriculture and Allied Products |
18.1 |
2.0 |
3.8 |
42.4 |
7.2 |
89.2 |
|
b) |
Ores and Minerals |
9.0 |
1.2 |
1.7 |
28.6 |
17.3 |
38.2 |
2. |
Manufactured Goods |
101.1 |
14.8 |
19.2 |
19.1 |
17.6 |
29.9 |
|
of which: |
|
|
|
|
|
|
|
a) |
Chemicals and Related Products |
20.5 |
3.0 |
3.7 |
18.0 |
16.7 |
26.0 |
|
b) |
Engineering Goods |
36.7 |
5.3 |
8.0 |
24.2 |
29.8 |
50.7 |
|
c) |
Textiles and Textile Products |
19.0 |
2.8 |
3.4 |
9.5 |
-0.5 |
20.1 |
|
d) |
Gems and Jewellery |
19.7 |
2.9 |
3.2 |
23.0 |
18.7 |
8.6 |
3. |
Petroleum Products |
24.9 |
4.3 |
5.5 |
33.1 |
79.2 |
26.7 |
4. |
Total Exports |
159.0 |
23.1 |
31.7 |
25.8 |
24.2 |
36.7 |
Memo: |
|
|
|
|
|
|
|
Non-oil Exports |
134.1 |
18.8 |
26.2 |
24.6 |
16.0 |
39.0 |
R : Revised. P : Provisional. Source : DGCI&S. |
Table 55: Direction of India’s Exports |
|
US $ billion |
Variation (per cent) |
Group/Country |
2007-08 |
2007-08R |
2008-09P |
2007-08 |
2007-08 |
2008-09 |
|
|
April-May |
|
April-May |
1 |
|
2 |
3 |
4 |
5 |
6 |
7 |
1. |
OECD Countries |
61.7 |
9.1 |
12.1 |
18.6 |
16.3 |
33.9 |
|
of which: |
|
|
|
|
|
|
|
a) EU |
32.2 |
4.8 |
7.3 |
24.9 |
21.0 |
52.5 |
|
b) North America |
22.0 |
3.2 |
3.5 |
10.0 |
6.1 |
7.8 |
|
US |
20.7 |
3.0 |
3.3 |
9.7 |
6.2 |
7.4 |
2. |
OPEC |
26.2 |
4.0 |
5.7 |
26.4 |
32.4 |
41.8 |
|
of which: |
|
|
|
|
|
|
|
UAE |
15.4 |
2.4 |
3.3 |
27.7 |
36.8 |
38.0 |
3. |
Developing Countries |
67.2 |
9.7 |
13.2 |
32.4 |
28.4 |
35.5 |
|
of which: |
|
|
|
|
|
|
|
Asia |
50.1 |
7.0 |
9.8 |
33.2 |
17.6 |
39.9 |
|
People’s Republic of China |
10.8 |
1.3 |
1.9 |
30.0 |
10.0 |
45.4 |
|
Singapore |
6.9 |
1.2 |
2.0 |
12.9 |
-5.3 |
65.8 |
4. |
Total Exports |
159.0 |
23.1 |
31.7 |
25.8 |
24.2 |
36.7 |
R : Revised. P : Provisional. Source : DGCI&S. |
Commodity-wise data on imports available for April-May 2008 show that petroleum, oil and lubricants (POL) and capital goods were the major drivers, together accounting for 78 per cent of the import growth. POL imports recorded an accelerated growth of 74.8 per cent during April-May 2008 as compared with 25.7 per cent during April-May 2007. Imports of capital goods grew by 39.7 per cent, accounting for 50.2 per cent of the non-oil imports. Non-oil imports net of gold and silver, moderated at 34.5 per cent, while imports of mainly industrial inputs decelerated to 31.0 per cent from a growth of 37.7 per cent in April-May 2007 (Table 56).
Source-wise, China was the major source of imports in April-May 2008, accounting for 11.1 per cent of total imports, followed by Saudi Arabia (7.1 per cent), the UAE (6.6 per cent), Switzerland (5.8 per cent) and the US (4.3 per cent).
Merchandise trade deficit during April-August 2008 widened to US $ 49.3 billion from US $ 34.6 billion during April-August 2007. Trade deficit on the oil account during April-May 2008 widened to US $ 13.9 billion from US $ 6.8 billion a year ago, while non-oil trade deficit declined to US $ 6.4 billion from US $ 7.2 billion (Table 57).
Table 56: Imports of Principal Commodities |
Commodity Group |
US $ billion |
Variation (per cent) |
|
2007-08 |
2007-08R |
2008-09P |
2007-08 |
2007-08 |
2008-09 |
|
|
April-May |
|
April-May |
1 |
2 |
3 |
4 |
5 |
6 |
7 |
Petroleum, Petroleum Products |
|
|
|
|
|
|
and Related Material |
79.6 |
11.1 |
19.4 |
39.4 |
25.7 |
74.8 |
Edible Oil |
2.6 |
0.3 |
0.3 |
21.3 |
-4.7 |
0.6 |
Iron and Steel |
8.7 |
1.5 |
1.6 |
35.2 |
69.1 |
4.2 |
Capital Goods |
58.4 |
8.3 |
11.6 |
24.1 |
32.7 |
39.7 |
Pearls, Precious and Semi-Precious Stones |
8.0 |
1.5 |
0.8 |
6.5 |
23.1 |
-49.3 |
Chemicals |
9.9 |
1.5 |
2.4 |
26.2 |
32.4 |
59.5 |
Gold and Silver |
17.8 |
4.8 |
4.0 |
21.8 |
88.4 |
-15.7 |
Total Imports |
239.7 |
37.1 |
52.0 |
29.0 |
38.0 |
40.1 |
Memo: |
|
|
|
|
|
|
Non-oil Imports |
160.0 |
26.0 |
32.6 |
24.4 |
44.0 |
25.3 |
Non-oil Imports excluding Gold and
Silver |
142.2 |
21.2 |
28.6 |
24.7 |
36.8 |
34.5 |
Mainly Industrial Inputs* |
130.0 |
20.0 |
26.2 |
24.2 |
37.7 |
31.0 |
R : Revised.
P : Provisional.
* : Non-oil imports net of gold and silver, bulk consumption goods, manufactured fertilisers and professional instruments.
Source : DGCI&S. |
Current Account
Net surplus under invisibles (services, transfers and income taken together) was at US $ 20.9 billion in April-June 2008 (US $ 14.4 billion in April-June 2007), reflecting mainly the rise in remittances from overseas Indians, large receipts from software exports, higher interest income on reserves and relatively moderate rise in payments of business and professional services (Table 58). Growth in invisible receipts at 29.7 per cent during April-June 2008 was substantially higher than 16.7 per cent in the corresponding period of 2006-07, mainly due to the momentum maintained in the growth of software services exports, travel and transportation, along with the steady inflow of remittances from overseas Indians. Invisible payments grew by 14.8 per cent during the first quarter of April-June 2008 (22.6 per cent during April-June 2007), reflecting the payments on account of travel, transportation, business and management consultancy, engineering and other technical services, dividend, profit and interest payments.
Table 57: India’s Merchandise Trade |
(US $ billion) |
Item |
2006-07 |
2007-08 |
2007-08R |
2008-09P |
|
|
|
|
April-August |
1 |
2 |
3 |
4 |
5 |
Exports |
126.4 |
159.0 |
60.1 |
81.3 |
Imports |
185.7 |
239.7 |
94.6 |
130.5 |
Oil |
57.1 |
79.6 |
28.8 |
46.1 |
Non-oil |
128.6 |
160.0 |
65.8 |
84.5 |
Trade Balance |
-59.4 |
-80.6 |
-34.6 |
-49.3 |
Non-Oil Trade Balance |
-20.9 |
-25.9 |
-16.4 |
.. |
|
|
|
|
Variation (per cent) |
Exports |
22.6 |
25.8 |
19.3 |
35.3 |
Imports |
24.5 |
29.0 |
34.2 |
38.0 |
Oil |
30.0 |
39.4 |
17.9 |
60.0 |
Non-oil |
22.2 |
24.4 |
42.7 |
28.3 |
R : Revised. P : Provisional. .. : Not Available. |
Source : DGCI&S. |
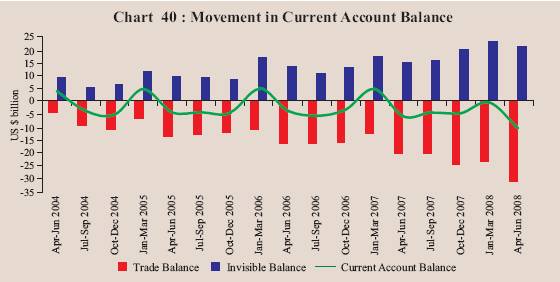
During April-June 2008, the sharp rise in trade deficit, mainly due to higher imports, particularly oil imports, resulted in a widening of the current account deficit to US $ 10.7 billion from US $ 6.3 billion during April-June 2007, notwithstanding an increase in net surplus in the invisibles account (Table 59 and Chart 40). The net invisible surplus offset 66.0 per cent of the trade deficit in April-June 2008 as compared with 69.6 per cent in April-June 2007. Net of remittances, the current account deficit was US $ 22.2 billion during April-June 2008 (US $ 13.8 billion in April-June 2007).
Capital Flows
During 2008-09 so far capital flows have remained volatile. Net capital flows during 2008-09 so far were lower than those in the corresponding period of 2007-08, mainly on account of outflows by foreign institutional investors (US $ 7.3 billion) during 2008-09 (up to October 10, 2008) in contrast to net FII inflows (US $ 18.9 billion) during the corresponding period of 2007-08. On the other hand, net FDI flows into India were placed higher at US $ 16.7 billion during April-August 2008 as compared with US $ 8.5 billion during April-August 2007. The funds raised through issuances of ADRs/GDRs abroad were at US $ 1.1 billion during April-August 2008 (US $ 2.8 billion in April-August 2007). NRI deposits recorded a net inflow of US $ 273 million during April-August 2008 mainly due to inflows under the rupee deposit accounts as against a net outflow (US $ 168 million) during April-August 2007 (Table 60).
Table 58: Invisibles Account (Net) |
(US $ million) |
Item |
2007-08 P |
2007-08 |
2008-09 |
|
April- |
April- |
July- |
Oct.- |
Jan.- |
April- |
|
March |
June PR |
Sept. PR |
Dec. PR |
March P |
June P |
1 |
2 |
3 |
4 |
5 |
6 |
7 |
Services |
37,550 |
8,729 |
7,608 |
10,430 |
10,783 |
10,461 |
Travel |
2,118 |
207 |
145 |
905 |
861 |
345 |
Transportation |
-2,107 |
-587 |
-649 |
-293 |
-578 |
-881 |
Insurance |
543 |
185 |
36 |
191 |
131 |
114 |
Government not included elsewhere |
-51 |
-16 |
-62 |
16 |
11 |
19 |
Software |
37,051 |
8,040 |
7,667 |
9,257 |
12,087 |
9,799 |
Other Services |
-4 |
900 |
471 |
354 |
-1,729 |
1,065 |
Transfers |
41,017 |
7,518 |
9,265 |
10,866 |
13,368 |
11,522 |
Investment Income |
-5,239 |
-1,719 |
-1,142 |
-1,161 |
-1,217 |
-958 |
Compensation of Employees |
-671 |
-128 |
-201 |
-160 |
-182 |
-175 |
Total |
72,657 |
14,400 |
15,530 |
19,975 |
22,752 |
20,850 |
PR : Partially Revised. P : Preliminary. |
Table 59: India’s Balance of Payments |
(US $ million) |
Item |
2007-08P |
2007-08 |
2008-09 |
|
April- |
April- |
July- |
Oct.- |
Jan.- |
April- |
|
March |
June PR |
Sept. PR |
Dec. PR |
March P |
June P |
1 |
2 |
3 |
4 |
5 |
6 |
7 |
Exports |
158,461 |
35,752 |
37,595 |
42,284 |
42,830 |
43,703 |
Import |
248,521 |
56,453 |
58,069 |
67,376 |
66,623 |
75,277 |
Trade Balance |
-90,060 |
-20,701 |
-20,474 |
-25,092 |
-23,793 |
-31,574 |
|
(-7.7) |
|
|
|
|
|
Invisible Receipts |
145,257 |
29,100 |
32,322 |
38,764 |
45,071 |
37,730 |
Invisible Payments |
72,600 |
14,700 |
16,792 |
18,789 |
22,319 |
16,880 |
Invisibles, net |
72,657 |
14,400 |
15,530 |
19,975 |
22,752 |
20,850 |
|
(6.2) |
|
|
|
|
|
Current Account |
-17,403 |
-6,301 |
-4,944 |
-5,117 |
-1,041 |
-10,724 |
|
(-1.5) |
|
|
|
|
|
Capital Account (net )* |
109,567 |
17,501 |
34,180 |
31,855 |
26,031 |
12,959 |
of which: |
|
|
|
|
|
|
Foreign Direct Investment |
15,545 |
2,658 |
2,808 |
3,729 |
6,350 |
10,117 |
Portfolio Investment |
29,261 |
7,458 |
10,876 |
14,662 |
-3,735 |
-4,208 |
External Commercial Borrowings + |
22,165 |
6,990 |
4,136 |
6,212 |
4,827 |
1,559 |
Short Term Trade Credit |
17,683 |
1,804 |
4,886 |
4,691 |
6,302 |
2,173 |
External Assistance |
2,114 |
241 |
468 |
565 |
840 |
351 |
NRI Deposits |
179 |
-447 |
369 |
-853 |
1,110 |
813 |
Change in Reserves # |
-92,164 |
-11,200 |
-29,236 |
-26,738 |
-24,990 |
-2,235 |
Memo: |
|
|
|
|
|
|
Current Account net of Private Transfers |
-58,181 |
-13,832 |
-14,162 |
-15,909 |
-14,278 |
-22,216 |
|
(-5.0) |
|
|
|
|
|
PR : Partially Revised. P : Preliminary
* : Includes errors and omissions. + : Medium and long-term borrowings.
# : On a balance of payments basis (excluding valuation); (-) indicates increase.
Note : Figures in parentheses are percentages to GDP |
With net capital flows being higher than the current account deficit, the overall balance of payments recorded a surplus of US $ 2.2 billion during the first quarter of 2008-09 (US $ 11.2 billion in the first quarter of 2007-08).
Foreign Exchange Reserves
India’s foreign exchange reserves were US $ 274.0 billion as on October 10, 2008, showing a decline of US $ 35.7 billion over end-March 2008. The decline in the foreign exchange reserves was due to decline in almost all the components of reserves. While foreign currency assets declined from US $ 299.2 billion as at end-March 2008 to US $ 265.0 billion as on October 10, 2008, gold declined from US $ 10.0 billion to US $ 8.6 billion on account of decline in the value of gold; SDRs declined from US $ 18.0 million in March 2008 to 4.0 million (Table 61).
India holds the third largest stock of reserves among the emerging market economies as at end-September 2008. The overall approach to the management of India’s foreign exchange reserves in recent years reflects the changing composition of the balance of payments and the ‘liquidity risks’ associated with different types of flows and other requirements. Taking these factors into account, India’s foreign exchange reserves continued to be at a comfortable level and consistent with the rate of growth, the size of external sector in the economy and the size of risk-adjusted capital flows.
Table 60: Capital Flows |
(US $ million) |
Item |
Period |
2007-08 |
2008-09 |
1 |
2 |
3 |
4 |
Foreign Direct Investment into India |
April-August |
8,536 |
16,733 |
Foreign Direct Investment abroad |
April-June |
-4,321 |
-2,019 |
FIIs (net) |
April-October * |
18,948 |
-7,321 |
ADRs/GDRs |
April-August |
2,792 |
1,135 |
External Assistance (net) |
April-June |
241 |
351 |
External Commercial
Borrowings (net) |
|
|
|
(Medium and long-term) |
April-June |
6,990 |
1,559 |
Short-term Trade Credit (net) |
April-June |
1,804 |
2,173 |
Non-NRI Banking Capital (net) |
April-June |
-472 |
1,922 |
NRI Deposits (net) |
April-August |
-168 |
273 |
Other Capital |
April-June |
-843 |
518 |
* : Up to October 10, 2008. |
|
|
|
Note : Data on FIIs presented in this table represent net inflows into the country. They may differ from data relating to net investment in stock exchanges by FIIs in Chapter V. |
Table 61: Foreign Exchange Reserves |
(US $ million) |
Memo : |
Month |
Gold |
SDR |
Foreign
Currency
Assets |
Reserve
Position
in the IMF |
Total
(2+3+4+5) |
Outstanding Net
Forward Sales (-) /
Purchase (+) of US
dollar by the Reserve
Bank at the end
of the month |
1 |
2 |
3 |
4 |
5 |
6 |
7 |
March 2000 |
2,974 |
4 |
35,058 |
658 |
38,694 |
(-) 675 |
March 2005 |
4,500 |
5 |
135,571 |
1,438 |
141,514 |
- |
March 2006 |
5,755 |
3 |
145,108 |
756 |
151,622 |
- |
March 2007 |
6,784 |
2 |
191,924 |
469 |
199,179 |
- |
March 2008 |
10,039 |
18 |
299,230 |
436 |
309,723 |
(+) 14,735 |
April 2008 |
9,427 |
18 |
304,225 |
485 |
314,155 |
(+) 17,095 |
May 2008 |
9,202 |
11 |
304,875 |
526 |
314,614 |
(+) 15,470 |
June 2008 |
9,208 |
11 |
302,340 |
528 |
312,087 |
(+) 13,700 |
July 2008 |
9,735 |
11 |
295,918 |
512 |
306,176 |
(+) 11,910 |
August 2008 |
8,692 |
4 |
286,117 |
496 |
295,309 |
(+) 9,925 |
September 2008 |
8,565 |
4 |
277,300 |
467 |
286,336 |
.. |
October 2008* |
8,565 |
4 |
264,977 |
458 |
274,004 |
.. |
* : As on October 10, 2008. |
External Debt
India’s total external debt was placed at US $ 221.3 billion at end-June 2008, recording an increase of US $ 0.6 billion (0.3 per cent) over end-March 2008 (Table 62). The rise in external debt stock was essentially due to increase in short-term debt which rose by US $ 2.2 billion during the quarter. Long-term debt, however, declined as outstanding NRI deposits (despite net inflows) recorded a decline during the first quarter of 2008-09, mainly on account of valuation effect. The appreciation of the US dollar against other major international currencies and Indian rupee resulted in a decline in overall external debt by US $ 4.5 billion. Excluding the valuation effects, the stock of external debt as at end-June 2008 increased by US $ 5.1 billion over the end-March 2008 level. The US dollar remained the leading currency in which India’s external debt was denominated, accounting for about 52.3 per cent of total debt.
Table 62: India’s External Debt |
(US $ million) |
Item |
End- |
End- |
End- |
End- |
End- |
|
March |
March |
March |
March |
June |
|
2005 |
2006 |
2007 |
2008 |
2008 |
1 |
2 |
3 |
4 |
5 |
6 |
1. Multilateral |
31,744 |
32,620 |
35,337 |
39,312 |
39,662 |
2. Bilateral |
17,034 |
15,761 |
16,061 |
19,613 |
18,683 |
3. International Monetary Fund |
0 |
0 |
0 |
0 |
0 |
4. Trade Credit (above 1 year) |
5,022 |
5,420 |
7,051 |
10,267 |
11,004 |
5. External Commercial Borrowings |
26,405 |
26,452 |
41,657 |
62,019 |
61,458 |
6. NRI Deposit |
32,743 |
36,282 |
41,240 |
43,672 |
42,612 |
7. Rupee Debt |
2,302 |
2,059 |
1,947 |
2,016 |
1,866 |
8. Long-term (1 to 7) |
115,250 |
118,594 |
143,293 |
176,899 |
175,285 |
9. Short-term |
17,723 |
19,539 |
26,376 |
43,820 |
46,018 |
Total (8+9) |
132,973 |
138,133 |
169,669 |
220,719 |
221,303 |
Memo: |
|
|
|
|
(per cent) |
Total debt/GDP |
18.5 |
17.2 |
17.8 |
18.7 |
.. |
Short-term/Total debt |
13.3 |
14.1 |
15.5 |
19.9 |
20.8 |
Short-term debt/Reserves |
12.5 |
12.9 |
13.2 |
14.1 |
14.7 |
Concessional debt/Total debt |
30.9 |
28.6 |
23.3 |
19.9 |
19.3 |
Reserves/Total debt |
106.4 |
109.8 |
117.4 |
140.3 |
141.0 |
Debt Service Ratio |
5.9 |
10.1 |
4.8 |
5.4 |
3.9 |
.. : Not available. |
Debt sustainability indicators remained at comfortable levels at end-June 2008. The debt service ratio was placed at 3.9 per cent during the first quarter of 2008-09 as against 5.4 per cent during 2007-08. The ratio of short-term to total debt and short-term debt to reserves increased to 20.8 per cent and 14.7 per cent, respectively, from 19.9 per cent and 14.1 per cent, respectively, at end-March 2008. India’s foreign exchange reserves exceeded the external debt by US $ 90.8 billion providing a cover of 141.0 per cent to the external debt stock at the end of June 2008.
International Investment Position
India’s net international liabilities declined by US $ 9.0 billion between end-March 2007 and end-March 2008, as the increase in international assets (US $ 135.4 billion) exceeded the increase in international liabilities (US $ 126.4 billion) (Table 63). The increase in international assets was mainly on account of increase in the reserve assets (US $110.5 billion), increase in the Indian investment abroad (US $ 16.8 billion) and increase in other investment, in particular, loan extended to non-residents by the banking sector. On the other hand, the increase in international liabilities was on account of the increase in portfolio investment (equity securities) and direct investment amounting to US $ 39.9 billion and US $ 39.2 billion, respectively. Loans and trade credit components of other investment liabilities increased by US $ 25.5 billion and US $ 18.0 billion, respectively.
Table 63: International Investment Position of India |
(US $ billion) |
Item |
March |
March |
March |
March |
|
2005 |
2006 R |
2007 PR |
2008 P |
1 |
2 |
3 |
4 |
5 |
A. |
Assets |
165.7 |
184.2 |
246.0 |
381.4 |
|
|
|
|
(23.0) |
(22.9) |
(25.9) |
(32.4) |
|
1. |
Direct Investment |
10.0 |
15.9 |
29.4 |
46.2 |
|
2. |
Portfolio Investment |
0.5 |
1.2 |
0.9 |
0.7 |
|
|
2.1 |
Equity Securities |
0.3 |
0.8 |
0.5 |
0.6 |
|
|
2.2 |
Debt securities |
0.2 |
0.5 |
0.4 |
0.1 |
|
3. |
Other Investment |
13.7 |
15.5 |
16.5 |
24.8 |
|
|
3.1 |
Trade Credits |
1.1 |
-0.3 |
0.6 |
0.9 |
|
|
3.2 |
Loans |
1.9 |
2.5 |
3.2 |
10.5 |
|
|
3.3 |
Currency and Deposits |
7.3 |
9.8 |
8.5 |
8.2 |
|
|
3.4 |
Other Assets |
3.4 |
3.5 |
4.2 |
5.2 |
|
4. |
Reserve Assets |
141.5 |
151.6 |
199.2 |
309.7 |
|
|
|
|
(19.7) |
(18.9) |
(20.9) |
(26.3) |
B. |
Liabilities |
219.6 |
244.2 |
308.0 |
434.4 |
|
|
|
|
(30.5) |
(30.4) |
(32.4) |
(36.8) |
|
1. |
Direct Investment |
44.5 |
52.4 |
76.3 |
115.5 |
|
|
|
|
(6.2) |
(6.5) |
(8.0) |
(9.8) |
|
2. |
Portfolio Investment |
56.0 |
64.3 |
79.5 |
119.4 |
|
|
|
|
(7.8) |
(8.0) |
(8.4) |
(10.1) |
|
|
2.1 |
Equity Securities |
43.2 |
54.7 |
63.3 |
98.2 |
|
|
2.2 |
Debt securities |
12.8 |
9.5 |
16.2 |
21.2 |
|
3. |
Other Investment |
119.1 |
127.5 |
152.2 |
199.5 |
|
|
|
|
(16.6) |
(15.9) |
(16.0) |
(16.9) |
|
|
3.1 |
Trade Credits |
18.3 |
21.2 |
27.7 |
45.7 |
|
|
3.2 |
Loans |
66.0 |
68.0 |
80.9 |
106.4 |
|
|
3.3 |
Currency and Deposits |
33.6 |
37.3 |
42.3 |
44.8 |
|
|
3.4 |
Other Liabilities |
1.2 |
1.0 |
1.3 |
2.6 |
C. |
Net Position (A-B) |
-53.9 |
-60.0 |
-62.0 |
-53.0 |
|
|
|
|
(-7.5) |
(-7.5) |
(-6.5) |
(-4.4) |
R : Revised. PR : Partially Revised. P : Provisional.
Note: Figures in parentheses are percentages to GDP. |
|
 IST,
IST,


