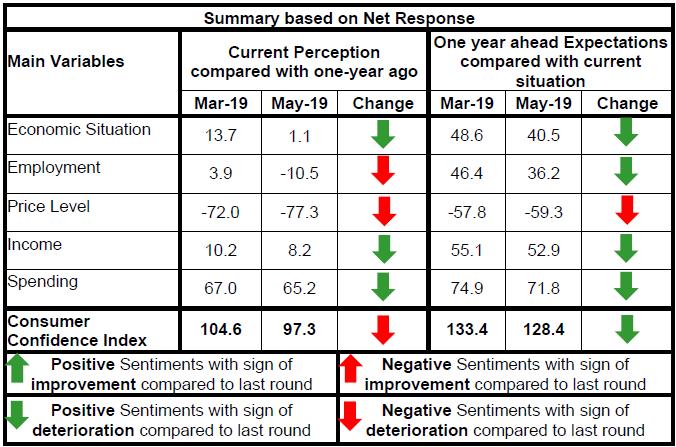
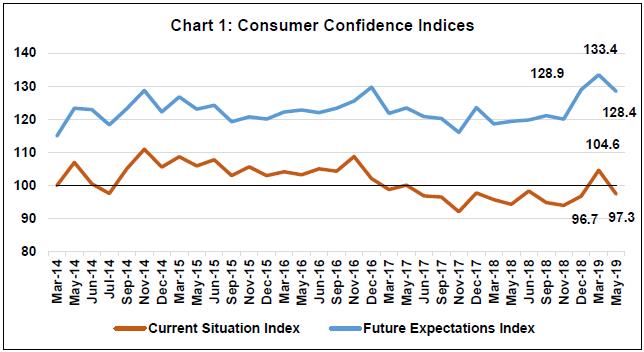
Today, the Reserve Bank released the results of the May 2019 round of its Consumer Confidence Survey (CCS)1. The survey was conducted in 13 major cities – Ahmedabad; Bengaluru; Bhopal; Chennai; Delhi; Guwahati; Hyderabad; Jaipur; Kolkata; Lucknow; Mumbai; Patna; and Thiruvananthapuram - and obtained 5,245 responses on households’ perceptions and expectations on the general economic situation, the employment scenario, the overall price situation and their own income and spending. Highlights: I. After a sharp upsurge in the March 2019 round, consumer confidence fell in the May 2019 round. II. The current situation index (CSI)2, which had entered optimistic territory after a gap of two years in the March 2019 round, returned to pessimism; the future expectations index (FEI) slipped from its all-time high in the March 2019 round (Chart 1). III. Weakening confidence is primarily attributable to the deterioration in sentiments on the economic situation and employment. Note: Please see the excel file for time series data IV. Consumers’ perception of the general economic situation remained in optimistic territory, despite a sharp lowering of sentiments in the current round; while the one year ahead outlook also turned out to be less optimistic, more than 60 per cent of respondents expect improvement in the general economic situation in the year ahead (Table 1). V. Sentiments on the current employment scenario returned to pessimistic territory, and there was lowering of optimism in the outlook (Table 2). VI. Respondents perceived a rise in price level over the last one year, and they expect further deterioration in the price situation for the year ahead (Tables 3 and 4). VII. Half the respondents continued to report stagnant income over the last one year, but a majority still expect their incomes to rise in the coming year (Table 5). VIII. Despite a marginal increase in spending on essential items, a sharp fall in the discretionary spending led to lower overall spending by households and a somewhat less optimistic outlook for the year ahead (Table 6, 7 and 8). | Table 1: Perceptions and Expectations on the General Economic Situation | | (Percentage responses) | | Survey Round | Current Perception | One year ahead Expectation | | Improved | Remained Same | Worsened | Net Response | Will Improve | Will Remain Same | Will Worsen | Net Response | | May-18 | 32.5 | 19.6 | 47.9 | -15.4 | 50.6 | 22.1 | 27.4 | 23.2 | | Jun-18 | 36.4 | 21.9 | 41.8 | -5.4 | 50.4 | 23.0 | 26.6 | 23.8 | | Sep-18 | 33.7 | 22.1 | 44.3 | -10.6 | 53.2 | 16.7 | 30.2 | 23.0 | | Nov-18 | 33.2 | 21.6 | 45.2 | -12.0 | 53.6 | 15.3 | 31.2 | 22.4 | | Dec-18 | 36.7 | 20.2 | 43.1 | -6.4 | 59.9 | 15.8 | 24.3 | 35.6 | | Mar-19 | 46.2 | 21.3 | 32.5 | 13.7 | 66.4 | 15.8 | 17.8 | 48.6 | | May-19 | 38.8 | 23.6 | 37.7 | 1.1 | 61.4 | 17.7 | 20.9 | 40.5 |
| Table 2: Perceptions and Expectations on Employment | | (Percentage responses) | | Survey Round | Current Perception | One year ahead Expectation | | Improved | Remained Same | Worsened | Net Response | Will Improve | Will Remain Same | Will Worsen | Net Response | | May-18 | 32.1 | 24.0 | 43.9 | -11.8 | 51.0 | 24.4 | 24.6 | 26.5 | | Jun-18 | 34.7 | 26.4 | 38.9 | -4.1 | 50.9 | 25.8 | 23.4 | 27.5 | | Sep-18 | 35.2 | 19.3 | 45.5 | -10.3 | 54.1 | 17.0 | 29.0 | 25.1 | | Nov-18 | 33.9 | 18.9 | 47.2 | -13.3 | 53.5 | 16.1 | 30.4 | 23.1 | | Dec-18 | 35.6 | 20.1 | 44.3 | -8.7 | 60.3 | 17.1 | 22.7 | 37.6 | | Mar-19 | 41.1 | 21.7 | 37.2 | 3.9 | 65.3 | 15.9 | 18.9 | 46.4 | | May-19 | 33.7 | 22.1 | 44.2 | -10.5 | 59.3 | 17.6 | 23.1 | 36.2 |
| Table 3: Perceptions and Expectations on Price Level | | (Percentage responses) | | Survey Round | Current Perception | One year ahead Expectation | | Increased | Remained Same | Decreased | Net Response | Will Increase | Will Remain Same | Will Decrease | Net Response | | May-18 | 87.9 | 8.7 | 3.3 | -84.6 | 82.7 | 11.0 | 6.4 | -76.3 | | Jun-18 | 89.1 | 7.9 | 3.0 | -86.0 | 82.8 | 11.8 | 5.4 | -77.4 | | Sep-18 | 88.3 | 8.5 | 3.2 | -85.1 | 80.1 | 12.0 | 7.9 | -72.2 | | Nov-18 | 88.3 | 7.8 | 3.8 | -84.5 | 80.2 | 11.6 | 8.2 | -72.0 | | Dec-18 | 84.3 | 10.9 | 4.8 | -79.5 | 71.6 | 15.9 | 12.5 | -59.1 | | Mar-19 | 77.8 | 16.4 | 5.8 | -72.0 | 68.7 | 20.5 | 10.9 | -57.8 | | May-19 | 81.6 | 14.1 | 4.3 | -77.3 | 70.3 | 18.7 | 11.0 | -59.3 |
| Table 4: Perceptions and Expectations on Rate of Change in Price Level (Inflation)* | | (Percentage responses) | | Survey Round | Current Perception | One year ahead Expectation | | Increased | Remained Same | Decreased | Net Response | Will Increase | Will Remain Same | Will Decrease | Net Response | | May-18 | 80.4 | 12.7 | 6.9 | -73.5 | 79.2 | 15.4 | 5.5 | -73.7 | | Jun-18 | 81.8 | 10.5 | 7.7 | -74.2 | 79.4 | 13.7 | 6.9 | -72.5 | | Sep-18 | 80.8 | 13.2 | 6.1 | -74.7 | 79.8 | 14.2 | 6.1 | -73.7 | | Nov-18 | 80.0 | 13.9 | 6.1 | -73.9 | 75.9 | 18.0 | 6.1 | -69.8 | | Dec-18 | 77.9 | 15.2 | 6.9 | -71.0 | 76.3 | 17.3 | 6.4 | -69.9 | | Mar-19 | 72.5 | 20.0 | 7.6 | -64.9 | 72.9 | 20.8 | 6.3 | -66.6 | | May-19 | 74.4 | 20.8 | 4.8 | -69.6 | 76.7 | 18.5 | 4.8 | -71.9 | | *Applicable only for those respondents who felt price has increased/price will increase. |
| Table 5: Perceptions and Expectations on Income | | (Percentage responses) | | Survey Round | Current Perception | One year ahead Expectation | | Increased | Remained Same | Decreased | Net Response | Will Increase | Will Remain Same | Will Decrease | Net Response | | May-18 | 27.6 | 47.8 | 24.6 | 3.0 | 51.4 | 38.2 | 10.4 | 41.0 | | Jun-18 | 27.1 | 50.8 | 22.1 | 5.0 | 51.3 | 38.0 | 10.7 | 40.5 | | Sep-18 | 28.3 | 48.3 | 23.4 | 4.9 | 59.1 | 33.1 | 7.8 | 51.3 | | Nov-18 | 29.9 | 49.5 | 20.5 | 9.4 | 59.0 | 34.3 | 6.7 | 52.3 | | Dec-18 | 29.8 | 48.2 | 22.0 | 7.8 | 63.5 | 30.4 | 6.2 | 57.3 | | Mar-19 | 30.1 | 50.0 | 19.9 | 10.2 | 60.8 | 33.4 | 5.7 | 55.1 | | May-19 | 29.0 | 50.2 | 20.8 | 8.2 | 58.9 | 35.1 | 6.0 | 52.9 |
| Table 6: Perceptions and Expectations on Spending | | (Percentage responses) | | Survey Round | Current Perception | One year ahead Expectation | | Increased | Remained Same | Decreased | Net Response | Will Increase | Will Remain Same | Will Decrease | Net Response | | May-18 | 82.6 | 14.8 | 2.7 | 79.9 | 84.8 | 12.6 | 2.6 | 82.2 | | Jun-18 | 83.8 | 14.1 | 2.0 | 81.8 | 86.5 | 11.3 | 2.2 | 84.4 | | Sep-18 | 78.4 | 18.2 | 3.5 | 74.9 | 81.2 | 15.7 | 3.1 | 78.1 | | Nov-18 | 73.0 | 23.9 | 3.1 | 69.9 | 77.6 | 19.0 | 3.4 | 74.2 | | Dec-18 | 73.8 | 22.7 | 3.5 | 70.3 | 77.3 | 18.7 | 4.0 | 73.3 | | Mar-19 | 70.1 | 26.8 | 3.1 | 67.0 | 77.5 | 19.9 | 2.6 | 74.9 | | May-19 | 68.6 | 28.0 | 3.4 | 65.2 | 74.7 | 22.5 | 2.9 | 71.8 |
| Table 7: Perceptions and Expectations on Spending- Essential Items | | (Percentage responses) | | Survey Round | Current Perception | One year ahead Expectation | | Increased | Remained Same | Decreased | Net Response | Will Increase | Will Remain Same | Will Decrease | Net Response | | May-18 | 85.2 | 11.8 | 3.0 | 82.2 | 85.1 | 11.2 | 3.7 | 81.4 | | Jun-18 | 86.6 | 11.1 | 2.3 | 84.3 | 87.5 | 10.0 | 2.5 | 85.0 | | Sep-18 | 83.6 | 13.1 | 3.4 | 80.2 | 84.2 | 13.1 | 2.7 | 81.5 | | Nov-18 | 83.4 | 13.4 | 3.2 | 80.2 | 84.1 | 12.5 | 3.3 | 80.8 | | Dec-18 | 82.4 | 14.5 | 3.1 | 79.3 | 83.5 | 13.0 | 3.4 | 80.1 | | Mar-19 | 78.6 | 18.2 | 3.2 | 75.4 | 83.4 | 14.3 | 2.3 | 81.1 | | May-19 | 80.0 | 17.1 | 2.9 | 77.1 | 80.7 | 16.5 | 2.8 | 77.9 |
| Table 8: Perceptions and Expectations on Spending- Non-Essential Items | | (Percentage responses) | | Survey Round | Current Perception | One year ahead Expectation | | Increased | Remained Same | Decreased | Net Response | Will Increase | Will Remain Same | Will Decrease | Net Response | | May-18 | 52.3 | 32.5 | 15.1 | 37.2 | 58.7 | 31.0 | 10.3 | 48.4 | | Jun-18 | 55.4 | 32.9 | 11.7 | 43.8 | 62.7 | 28.0 | 9.3 | 53.4 | | Sep-18 | 44.0 | 34.3 | 21.7 | 22.3 | 49.2 | 33.3 | 17.5 | 31.7 | | Nov-18 | 39.1 | 37.6 | 23.3 | 15.8 | 44.5 | 35.9 | 19.6 | 24.9 | | Dec-18 | 38.4 | 37.5 | 24.1 | 14.3 | 46.1 | 33.0 | 20.9 | 25.2 | | Mar-19 | 36.3 | 43.3 | 20.4 | 15.9 | 46.1 | 37.6 | 16.3 | 29.8 | | May-19 | 32.7 | 40.3 | 27.0 | 5.7 | 39.4 | 37.3 | 23.3 | 16.1 |
|  IST,
IST,