 IST,
IST,


Survey of Professional Forecasters on Macroeconomic Indicators- Results of the 58th Round
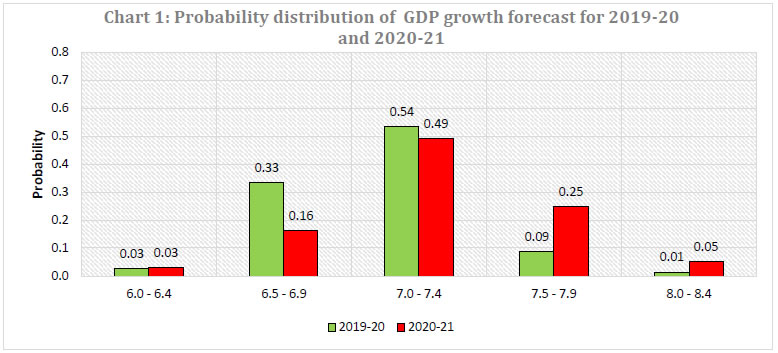
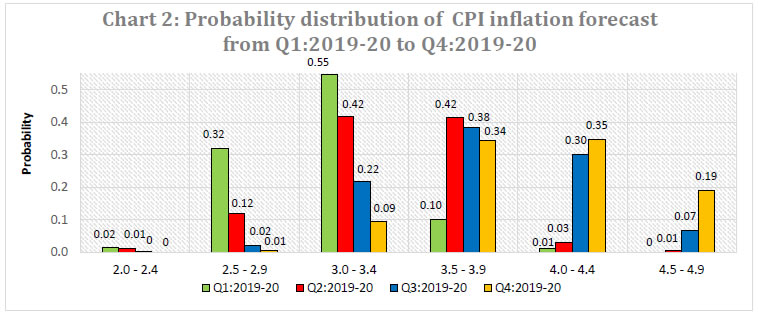
Growth is expected to improve in 2019-20 and firm up further in 2020-21. Consumer price inflation is expected to remain between 3.1 per cent and 4.0 per cent till Q3:2019-20 and increase to 4.2 per cent in Q4:2019-20. The Reserve Bank has been conducting the Survey of Professional Forecasters (SPF) since September 2007. Twenty-six panellists participated in the 58th round of the survey conducted during May 20192. The survey results are summarised in terms of their median forecasts and consolidated in Annexes 1-7, along with quarterly paths for key variables. Highlights: 1. Output
Note: Tails of the distribution are not presented in the chart. Detailed probability distributions are given in Annex 6. 2. Inflation
Note: Tails of the distribution are not presented in the chart. Detailed probability distributions are given in Annex 7. 3. External Sector
1 The results of the last survey round were released on April 4, 2019 on the Reserve Bank’s website. 2 The results presented here represent the views of the respondent forecasters and in no way reflect the views or forecasts of the Reserve Bank. | |||||||||||||||||||||||||||||||||||||||||||||||||||||||||||||||||||||||||||||||||||||||||||||||||||||||||||||||||||||||||||||||||||||||||||||||||||||||||||||||||||||||||||||||||||||||||||||||||||||||||||||||||||||||||||||||||||||||||||||||||||||||||||||||||||||||||||||||||||||||||||||||||||||||||||||||||||||||||||||||||||||||||||||||||||||||||||||||||||||||||||||||||||||||||||||||||||||||||||||||||||||||||||||||||||||||||||||||||||||||||||||||||||||||||||||||||||||||||||||||||||||||||||||||||||||||||||||||||||||||||||||||||||||||||||||||||||||||

شارك هذه الصفحة:


بھارت موبائل ایپلی کیشن کے ریزرو بینک کو انسٹال کریں اور تازہ ترین خبروں تک فوری رسائی حاصل کریں!
ہماری ایپ انسٹال کرنے کے لیے QR کوڈ اسکین کریں۔


صفحے پر آخری اپ ڈیٹ:


