 IST,
IST,


Survey of Professional Forecasters on Macroeconomic Indicators- Results of the 69th Round
The Reserve Bank has been conducting the Survey of Professional Forecasters (SPF) since September 2007. The responses for the 69th round of the survey were received during March 12-April 3, 2021, wherein thirty one panellists participated. The survey results are summarised in terms of their median forecasts (Annex 1-7), along with quarterly paths for key variables. Highlights: 1. Output
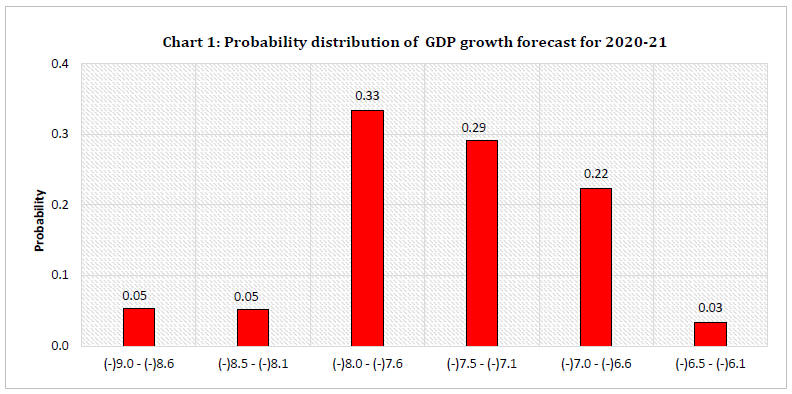 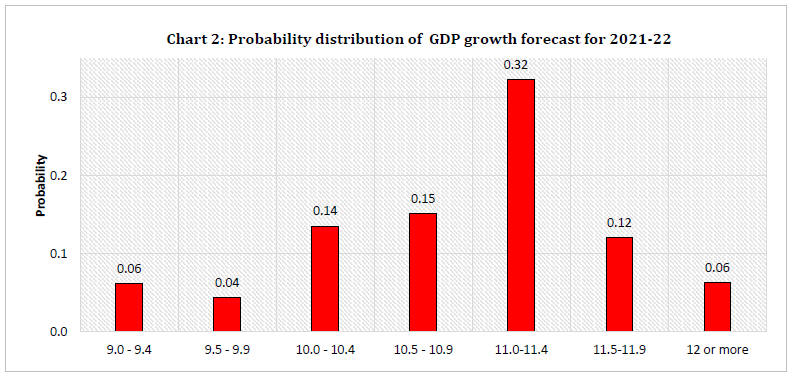 Note: Tails of the distributions are not presented in Charts 1 and 2. Detailed probability distributions are given in Annex 6.
2.Inflation
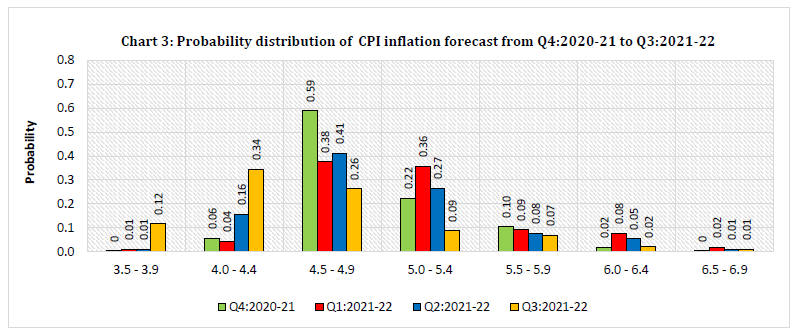 Note: Tails of the distributions are not presented in the Chart. Detailed probability distributions are given in Annex 7. 3.External Sector
Note: CPI: Consumer Price Index; GDP: Gross Domestic Products; GNDI: Gross National Disposable Income; GVA: Gross Value Added; IIP: Index of Industrial Production; WPI: Wholesale Price Index. 1 The survey results reflect the respondents’ views, which are not necessarily shared by the Reserve Bank. Results of the previous survey round were released on the Bank’s website on February 5, 2021. | |||||||||||||||||||||||||||||||||||||||||||||||||||||||||||||||||||||||||||||||||||||||||||||||||||||||||||||||||||||||||||||||||||||||||||||||||||||||||||||||||||||||||||||||||

شارك هذه الصفحة:


بھارت موبائل ایپلی کیشن کے ریزرو بینک کو انسٹال کریں اور تازہ ترین خبروں تک فوری رسائی حاصل کریں!
ہماری ایپ انسٹال کرنے کے لیے QR کوڈ اسکین کریں۔


صفحے پر آخری اپ ڈیٹ:


