III. Monetary Policy Operations - RBI - Reserve Bank of India


III. Monetary Policy Operations
|
During 2024-25, headline inflation exhibited gradual easing, with the path of disinflation interrupted by volatile and elevated food inflation. The monetary policy committee (MPC) changed the stance from withdrawal of accommodation to neutral in October 2024 and subsequently reduced the policy repo rate by 25 basis points (bps) to 6.25 per cent in February 2025. To ease potential liquidity stress, the cash reserve ratio (CRR) of banks was reduced to 4.0 per cent of net demand and time liabilities (NDTL) in December 2024 along with several other measures to inject durable liquidity during January-March 2025. III.1 Headline inflation in terms of the consumer price index (CPI) trended down during 2024-25, though the path of disinflation was interrupted by food price shocks (see Section 3 of Chapter II). Keeping in view the inflation-growth dynamics, the MPC changed the monetary policy stance from withdrawal of accommodation to neutral in October 2024 that provided it the flexibility to monitor the progress and outlook on disinflation and growth and act in accordance with the evolving situation. With inflation expected to moderate further during 2025-26, the MPC reduced the policy repo rate by 25 basis points to 6.25 per cent in February 2025 after maintaining status quo on the policy repo rate since February 2023 at 6.50 per cent. III.2 During the year, system liquidity moved from surplus during July-November 2024 to deficit during December 2024-February 2025, before turning into surplus by end-March 2025. To ease potential liquidity stress, the CRR of banks was reduced by 50 bps to 4.0 per cent of NDTL in December 2024 followed by several measures during January-March 2025 to inject durable liquidity. Reflecting the reduction in the policy repo rate, short-term money market rates softened. The transmission of policy repo rate changes to banks’ deposit and lending rates continued but at a slower pace during 2024-25. The mandated external benchmark regime introduced in October 2019 for loan pricing in select sectors strengthened the process of monetary transmission. III.3 Against the above backdrop, section 2 presents the implementation status of the agenda set for 2024-25 along with major developments during the year, while section 3 sets out the agenda for 2025-26. Concluding observations are provided in the last section. III.4 The Department had set out the following goals for 2024-25:
Implementation Status III.5 In pursuit of the goals set for 2024-25, lending rates and sectoral credit data of NBFCs are being collected and analysed for policy inputs. The introduction of the EBLR system of loan pricing for credit extended by NBFCs to select sectors was examined but was not found to be feasible at this juncture. A financial conditions index for India was developed using several financial market indicators at daily frequency, which captured the build-up of incipient stress in financial conditions during crisis episodes. The study on daily reserve maintenance behaviour of banks found that the flexible inflation targeting regime and automated sweep-in and sweep-out facility have been associated with lower volatility in daily reserve maintenance and a decline in average daily excess reserves by scheduled commercial banks (SCBs). CPI diffusion indices are now being disseminated on the centralised information management system (CIMS) of the Reserve Bank. III.6 Additionally, studies were undertaken to analyse: (i) monetary policy transmission during the phase of monetary policy tightening since May 2022; (ii) the core-like properties of food inflation such as volatility, persistence, spillovers and cyclical sensitivity; and (iii) the implication of high food inflation persistence on inflation expectations and its spillovers to non-food components. Major Developments Monetary Policy III.7 When the MPC met for its first meeting of 2024-25 in April, the global economy was exhibiting signs of resilience, and the domestic economy was gaining momentum buoyed by strong investment activity and a lower drag from net external demand. Domestic headline inflation had softened from 5.7 per cent in December 2023 to 5.1 per cent during January-February 2024. Food price uncertainties, frequent and overlapping adverse climate shocks and ongoing geopolitical tensions posed upside risks to the inflation trajectory. Assuming a normal monsoon, CPI inflation for 2024-25 was projected at 4.5 per cent with Q1 at 4.9 per cent, Q2 at 3.8 per cent, Q3 at 4.6 per cent and Q4 at 4.5 per cent with risks evenly balanced. The real GDP growth for 2024-25 was projected at 7.0 per cent with Q1 at 7.1 per cent; Q2 at 6.9 per cent; Q3 at 7.0 per cent; and Q4 at 7.0 per cent, reinforced by expectations of normal south-west monsoon (SWM), sustained growth in manufacturing and services sectors, and pick up in private consumption, although headwinds from geopolitical conflicts, volatility in international financial markets and geoeconomic fragmentation posed downside risks to the outlook. The MPC decided to keep the repo rate unchanged at 6.50 per cent with a 5-1 majority and remained focused on withdrawal of accommodation to ensure that inflation progressively aligns to the target while supporting growth. III.8 During the June 2024 policy meeting of the MPC, headline inflation had moderated sequentially since February. CPI inflation projection for 2024-25 was retained at 4.5 per cent. Real GDP growth for 2024-25 was projected at 7.2 per cent on the back of expectations of above-normal SWM, continued thrust on capital expenditure by the government and sustained momentum in manufacturing and services activity. The MPC decided to keep the policy repo rate unchanged at 6.50 per cent by a 4-2 majority and maintained its stance on withdrawal of accommodation, reiterating the need to continue with the disinflationary stance until a durable alignment of the headline CPI inflation with the target is achieved. III.9 During the MPC meeting of August 2024, global activity was exhibiting stability through uneven expansion and domestic activity remained steady. Real GDP growth projection for 2024-25 was retained at 7.2 per cent. In a reversal of trend, headline inflation increased to 5.1 per cent in June 2024 after remaining steady at 4.8 per cent during April-May 2024 owing to stubborn food inflation. Taking into account the expectations of food inflation easing due to pick-up in the SWM and healthy progress in sowing coupled with strong buffer stocks of cereals and softening global food prices, the CPI inflation projection for 2024-25 was retained at 4.5 per cent with Q2 at 4.4 per cent, Q3 at 4.7 per cent and Q4 at 4.3 per cent, with risks evenly balanced. The MPC noted that the risks from volatile and elevated food prices remained high, which may adversely impact inflation expectations and result in spillovers to core inflation. Therefore, the MPC decided to keep the repo rate unchanged by a 4-2 majority but unanimously reiterated its stance of withdrawal of accommodation. III.10 On October 1, 2024, the central government notified the reconstitution of the MPC with the induction of new external members after the completion of tenure of the existing external members. When the new MPC met in October 2024, domestic real GDP had registered a growth of 6.7 per cent (y-o-y) in Q1:2024-25, driven by private consumption and investment. Headline inflation moderated in July and August as compared to June. CPI inflation and real GDP growth projections for 2024-25 were retained at 4.5 per cent and 7.2 per cent, respectively. The MPC decided by a 5-1 majority to keep the policy repo rate unchanged at 6.50 per cent. Buoyed by a well-balanced inflation-growth dynamics, the MPC unanimously decided to change the policy stance from withdrawal of accommodation to neutral to provide it the flexibility to monitor the progress of ongoing disinflation. III.11 In the run up to the December 2024 meeting, real GDP growth registered a lower-than-expected growth of 5.4 per cent in Q2:2024-25. Consequently, real GDP growth projection for 2024-25 was revised downwards to 6.6 per cent. Headline inflation increased to 6.2 per cent in October breaching the upper tolerance level, driven by a sharp pick-up in food inflation and uptick in core inflation. Though food inflation was expected to ease by Q4:2024-25, adverse weather events and rise in international agricultural commodity prices posed upside risks to food inflation. In view of these factors, CPI inflation projection for 2024-25 was revised upwards to 4.8 per cent with Q3 at 5.7 per cent and Q4 at 4.5 per cent. Moreover, CPI inflation for Q1:2025-26 was projected at 4.6 per cent; and Q2 at 4.0 per cent. The MPC observed that the near-term inflation and growth outcomes had turned somewhat adverse since the October policy and it remained committed on restoring the inflation-growth balance, keeping in view the overall interest of the economy. By a majority of 4-2, the MPC decided to keep the policy repo rate unchanged at 6.50 per cent while unanimously deciding to continue with the neutral stance. III.12 The last meeting of the MPC for the financial year 2024-25 was held in February 2025. As per the First Advance Estimates (FAE), domestic real GDP was estimated to grow by 6.4 per cent in 2024-25, supported by a recovery in private consumption. For 2025-26, real GDP growth was projected at 6.7 per cent. Headline inflation eased in November-December 2024 due to moderation in food inflation, which, in turn, was expected to soften further due to good kharif production. Adverse weather events and uncertainties in global financial markets, however, posed upside risks to inflation. CPI inflation projection for 2024-25 was retained at 4.8 per cent with Q4 at 4.4 per cent. Assuming a normal monsoon, CPI for 2025-26 was projected at 4.2 per cent with Q1 at 4.5 per cent; Q2 at 4.0 per cent; Q3 at 3.8 per cent; and Q4 at 4.2 per cent. Against this backdrop, the MPC, noting that the growth-inflation dynamics opened up policy space to support growth, unanimously voted to reduce the policy repo rate by 25 bps to 6.25 per cent. The MPC, while being watchful, also decided unanimously to continue with the neutral stance, as excessive volatility in global financial markets, continued uncertainties about global trade policies and adverse weather events pose risks to growth and inflation outlook. 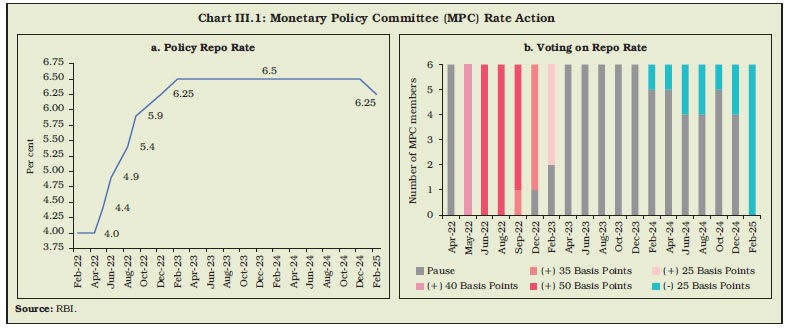 III.13 The MPC’s rate decisions during 2024-25 were marked with diversity barring the February 2025 rate cut action (Chart III.1). Moreover, given the prevailing uncertainties, the MPC eschewed from providing forward guidance and continued to remain data-dependent in policymaking. In the February 2025 meeting, the policy repo rate was reduced for the first time since February 2023, with greater confidence on the disinflation path. Inflation is expected to further moderate in 2025-26, gradually aligning with the target. III.14 Globally, while many central banks pivoted to an easing cycle in 2024, they remained cautious, maintaining a restrictive stance due to the lingering uncertainty about inflation aligning sustainably with their targets. However, faced with exacerbated trade related uncertainties, central banks remained guarded in their rate action in the first quarter of 2025, reducing rates either with caution or taking a pause (Chart III.2). The Operating Framework: Liquidity Management III.15 With a view to ease the potential liquidity stress that may arise on account of higher tax outflows, increase in currency in circulation (CiC) and volatility in capital flows, the CRR of banks was reduced to 4.0 per cent of NDTL on December 6, 2024, in two equal tranches of 25 bps each, effective fortnights beginning December 14, 2024 and December 28, 2024. This reduction released primary liquidity of about ₹1.16 lakh crore to the banking system. In addition, the Reserve Bank undertook a slew of liquidity measures in Q4:2024-25 including term repo auctions, open market purchase operations and USD/INR Buy/Sell swaps to inject durable liquidity into the banking system. Drivers and Management of Liquidity III.16 Volatile capital flows, pick-up in CiC and Government of India (GoI) cash balances emerged as the major drivers of liquidity during 2024-25 (Table III.1). The leakage in banking system liquidity due to increase in currency demand and the Reserve Bank’s forex market operations was partly offset by the drawdown of excess reserves, reduction in GoI cash balances and OMO purchases during 2024-25. III.17 At the beginning of Q1:2024-25, liquidity conditions remained in surplus during first half of April due to an increase in government spending. Thereafter, liquidity conditions turned into deficit in the latter half of April and remained so till June in the wake of: (i) seasonal expansion in CiC; (ii) build-up of GoI cash balances amidst lower spending as the model code of conduct became effective during elections; (iii) advance tax payments and goods and services tax (GST) related outflows; and (iv) the increase in holding of precautionary balances by banks in the form of excess reserves. As a result, average daily net injection under the liquidity adjustment facility (LAF) [including those under the marginal standing facility (MSF)] stood at ₹0.5 lakh crore in Q1:2024-25. With system liquidity in surplus in the first half of April 2024 (up to April 19), the Reserve Bank conducted one main and seven fine-tuning variable rate reverse repo (VRRR) auctions. As liquidity turned into deficit beginning the latter half of April, five main and 17 fine-tuning variable rate repo (VRR) auctions were conducted to ease liquidity tightness1. 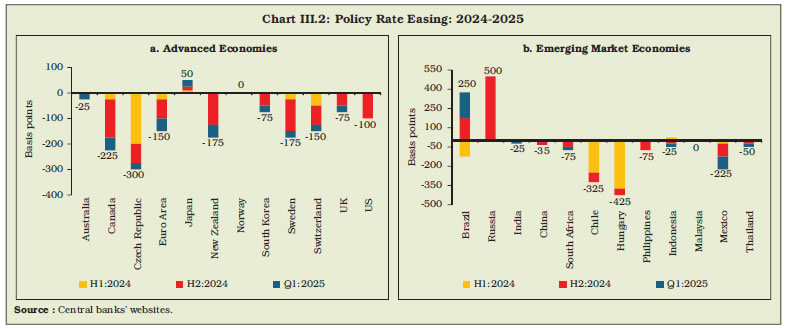 III.18 Liquidity turned into surplus during Q2:2024-25 with a pick-up in government spending after the elections, net forex purchases by the Reserve Bank and return of currency to the banking system. The build-up of GoI cash balances due to advance tax collections and GST payments tightened liquidity conditions between September 21-25, 2024. Additionally, net sales through open market operations (OMOs) under the negotiated dealing system - order matching (NDS-OM) absorbed durable liquidity amounting to ₹0.24 lakh crore during the quarter. Average daily net absorption under the LAF was ₹1.27 lakh crore during Q2. The Reserve Bank conducted five main and 44 fine-tuning VRRR auctions to absorb surplus liquidity. III.19 The liquidity surplus moderated in Q3:2024-25 with average net absorption under the LAF declining to ₹0.80 lakh crore from ₹1.27 lakh crore in the previous quarter. Except for a brief period, system liquidity remained in surplus during October-November on account of higher government spending, notwithstanding a significant increase in CiC due to festival related demand in October and capital outflows in November. Consequently, the Reserve Bank conducted five main and 23 fine-tuning VRRR operations during October 1-November 29, 20242. System liquidity turned into deficit during the second half of December on account of advance tax payments and capital outflows. III.20 Liquidity conditions remained in deficit in Q4:2024-25 due to capital outflows and currency outgo, with average net injection of ₹1.56 lakh crore under the LAF. In order to ease the liquidity stress and the resultant pressure on the weighted average call rate (WACR), the Reserve Bank started conducting daily VRR auctions effective January 16, 2025 with reversal taking place on the next working day. During Q4:2024-25, the Reserve Bank conducted four main and 62 fine-tuning VRR auctions to inject liquidity. With a view to ease the persistently tight liquidity conditions, the Reserve Bank undertook a slew of measures in Q4, which included: (i) injection of ₹1.83 lakh crore through three term VRR auctions of varying maturities conducted in February 2025; (ii) OMO purchase auctions of Government of India securities for an aggregate amount of ₹2.45 lakh crore; and (iii) USD/INR Buy/Sell swap auction of US$ 5 billion for a tenor of six months on January 31, 2025 and US$ 10 billion for a tenor of three years each on February 28, 2025 and March 24, 20253. In addition, the Reserve Bank purchased government securities amounting to ₹38,825 crore under the NDS-OM during the quarter that augmented durable liquidity.  III.21 During 2024-25, average absorption under the standing deposit facility (SDF) at ₹0.94 lakh crore constituted 78 per cent of average daily total absorption (₹1.21 lakh crore) under the LAF, while the remaining 22 per cent was absorbed through VRRR auctions – both main and fine-tuning operations (Chart III.3). Banks’ recourse to the MSF remained low, with average daily borrowing amounting to ₹0.07 lakh crore during 2024-25 compared to ₹0.5 lakh crore in 2023-24. Buyback of G-secs, which is part of an active debt consolidation strategy, augmented systemic liquidity amounting to ₹0.5 lakh crore during 2024-25. III.22 The tightening of liquidity conditions in the latter half of Q3 and Q4 was mainly on account of capital outflows and forex operations of the Reserve Bank. The Reserve Bank’s intervention in the forex market is aimed at maintaining orderly market conditions by containing excessive volatility in the exchange rate without targeting any exchange rate level or band, thereby allowing monetary policy to primarily remain focused on domestic macroeconomic conditions and the outlook (Box III.1).
III.23 During 2024-25, two-way fine-tuning operations were the key instrument to manage frictional liquidity. During this period, fine-tuning and main VRRR operations elicited average offer-cover ratios of 0.50 and 0.16, respectively. Banks were reluctant in parting with liquidity for longer tenors, as evident from the lower offer-cover ratios of main operations vis-à-vis fine-tuning operations. In contrast, the market was more responsive to fine-tuning and main VRR operations as reflected in much higher bid-cover ratios. III.24 Reflecting the liquidity dynamics, the WACR – the operating target of monetary policy – remained broadly within the LAF corridor during 2024-25.5 It, however, moderated after the introduction of daily VRR operations and the reduction in the policy repo rate by 25 bps on February 7, 2025. The WACR, on an average, remained 6 bps above the policy repo rate in 2024-25 as against 13 bps in 2023-24 (Chart III.4). 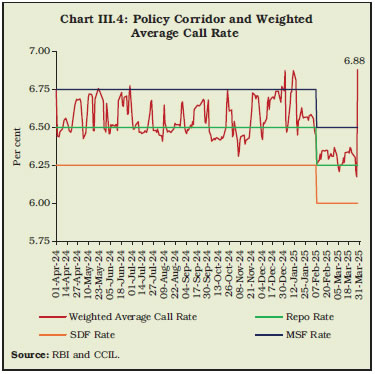 III.25 Overnight rates in the collateralised segment moved in tandem with the WACR (Table III.2). In the short-term money market, average yield on 3-month treasury bills (T-bills) softened by 26 bps in September 2024 from June 2024 on account of lower short-term borrowing requirements of the government, as reflected in the cancellation of T-bill auctions in the second half of September. Yields declined further in March 2025. Similarly, yields on 3-month commercial papers (CPs) of NBFCs and certificates of deposit (CDs) softened from March 2024, taking cues from domestic developments such as the transition of systemic liquidity to surplus and moderation in the wedge between deposit and credit growth. The decline in short-term rates prompted banks to increase CD issuances to meet rising credit demand amidst sluggish deposit growth. G-sec yields also remained benign throughout the year (see Section 5 of Chapter II). Overall, monetary policy changes impact short-term interest rates more than long-term rates in the Indian context (Patra et al., 2024)6. Monetary Policy Transmission III.26 The transmission of policy repo rate changes to banks’ deposit and lending rates continued during 2024-25 albeit at a slower pace. The weighted average lending rates (WALRs) on fresh and outstanding rupee loans of SCBs declined by 2 bps and 8 bps, respectively, during 2024-25. In case of deposits, weighted average domestic term deposit rates (WADTDRs) on fresh and outstanding deposits increased by 3 bps and 14 bps, respectively, in 2024-25, with a rising proportion of deposits getting renewed at higher rates. The pace and extent of monetary transmission to lending and deposit rates of SCBs has strengthened in recent years, reflecting the Reserve Bank’s sustained efforts to impart transparency and flexibility to the interest rate structure.7 III.27 During the tightening cycle (May 2022-January 2025), banks revised their repo-linked lending rates upwards by 250 bps and 1-year marginal cost of funds-based lending rate (MCLR) by 178 bps, resulting in an increase in the WALR on fresh rupee loans and on outstanding loans. The WADTDRs on fresh term deposits and outstanding term deposits also increased during this period (Table III.3). The increase in term deposit rates on fresh deposits was mainly driven by bulk deposit rates, although retail deposit rates also exhibited significant transmission, especially in H1:2024-25. 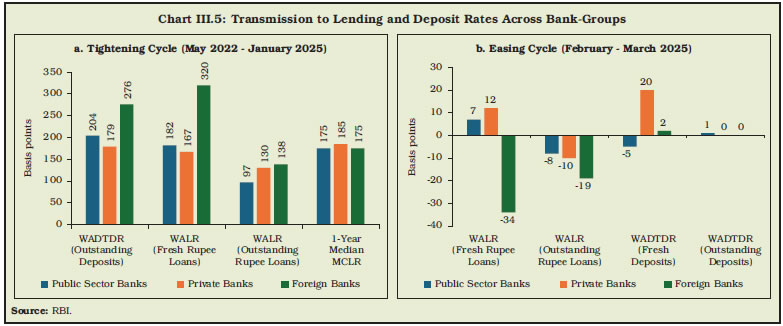 III.28 In response to the 25 bps cut in policy repo rate during the February policy meeting, banks have reduced their repo linked external benchmark lending rate (EBLR) by a similar magnitude. The MCLR, having a longer reset period and being linked to the cost of funds, may undergo adjustments with some lag. Consequently, the WALR on outstanding rupee loans declined by 10 bps during the easing cycle (February-March 2025). In case of fresh loans, however, it has increased by 3 bps. III.29 Across bank-groups, increase in the WADTDR on outstanding deposits and WALR on fresh rupee loans were higher for public sector banks (PSBs) relative to private banks (PVBs) during May 2022-January 2025 (Chart III.5). The transmission to WALR on outstanding rupee loans, however, was lower for PSBs reflecting a comparatively higher share of internal benchmark-based lending rates, viz., MCLR and others. Transmission was highest in case of foreign banks, facilitated by their low-cost deposits and a higher proportion of EBLR-linked loans8. During February-March 2025, WALR on outstanding rupee loans declined across all bank-groups. External Benchmark-based Loan Rates III.30 The EBLR regime has strengthened and quickened the pace of transmission. The proportion of EBLR-linked loans in outstanding floating rate rupee loans of SCBs increased further during 2024-25. Concomitantly, the share of the MCLR-linked loans fell during the year (Table III.4). 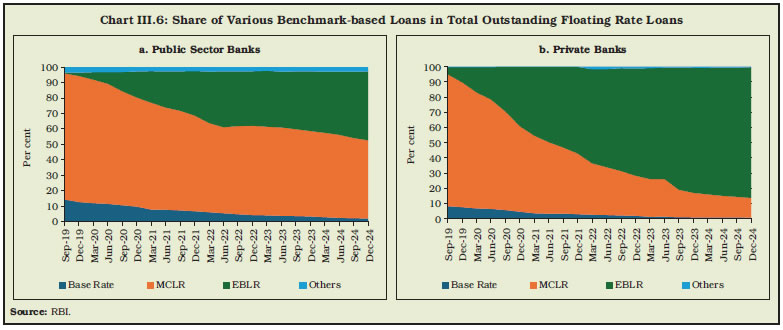 III.31 The share of EBLR-linked loans in total outstanding floating rate loans of PSBs stood at 44.6 per cent, whereas it was 85.9 per cent for PVBs as at end-December 2024 (Chart III.6). The share of MCLR and other legacy rate loans was significantly higher in PSBs as compared to PVBs. Thus, the predominance of legacy factors, viz., base rate, MCLR and others in PSBs’ portfolios have resulted in lower transmission to WALR on outstanding rupee loans of PSBs vis-à-vis PVBs. III.32 In case of loans linked to the policy repo rate, the spread of fresh rupee loans (WALR over the repo rate) was highest for education loans followed by micro, small and medium enterprise (MSME) loans and vehicle loans. Among the domestic bank-groups, the spreads charged by PSBs for housing, vehicle, education and other personal loans were lower than those of PVBs, whereas the spread on MSME loans was broadly similar between the two groups (Table III.5). Sectoral Lending Rates III.33 The WALRs on fresh rupee loans rose for vehicle, rupee export credit, and education segments during 2024-25, while they declined on loans to professional services, MSMEs, infrastructure, agriculture, housing, trade, and large industry (Table III.6). III.34 In case of outstanding loans, the WALRs on credit cards, rupee export credit, vehicle, and agriculture loans increased during 2024-25. On the other hand, the WALRs on loans to trade, MSMEs, large industry, housing, professional services, education and infrastructure segments declined during the same period (Table III.7). III.35 With a view to strengthen the assessment of monetary policy transmission, monthly data on lending rates of major NBFCs covering various sectors of the economy were examined. The interest rates charged by NBFCs tend to be higher as compared to SCBs, inter alia, reflecting their liability structure and the risk profile of their borrowers. The degree of monetary policy transmission, thus, differs between NBFCs and SCBs (Chart III.7). 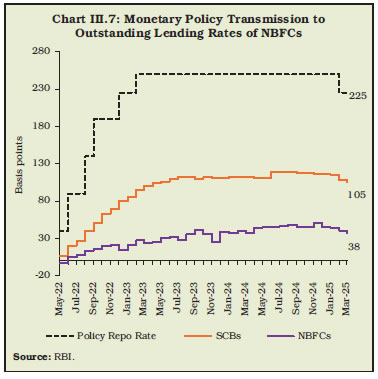 III.36 The Department would support the conduct and formulation of monetary policy by providing (i) high quality inputs on the assessment and outlook of inflation and growth; (ii) analysing and refining forecast of liquidity conditions; (iii) studying the monetary policy transmission process; and (iv) evaluating credit conditions and sectoral flows. Against this backdrop, the Department would focus on the following initiatives:
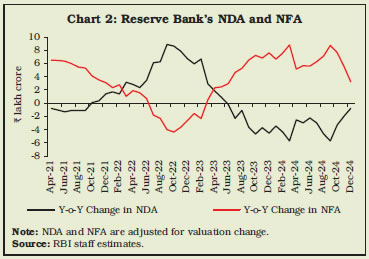
III.37 During 2024-25, headline inflation exhibited further moderation, though the path of disinflation was interrupted by volatile and elevated food inflation. System liquidity conditions transited from surplus during August-November 2024 to deficit in December-February. The Reserve Bank reduced the policy rate by 25 bps as growth-inflation dynamics opened up policy space for supporting growth and proactively conducted a suite of market operations to provide durable liquidity in the system. As a result, system liquidity returned to surplus by end-March 2025. Going forward, domestic economic activity is expected to strengthen from the lows of H1:2024-25. Headline inflation is expected to ease and move further towards the target in 2025-26. Monetary policy is committed towards achieving durable price stability, which is a necessary prerequisite for high growth on a sustained basis. The Reserve Bank will undertake liquidity management operations in sync with the monetary policy stance and keep system liquidity adequate to meet the needs of the productive sectors of the economy. 1 During this period, three fine-tuning VRRR operations were conducted on May 6 and June 4, 2024. 2 11 fine-tuning VRR auctions were conducted to alleviate occasional bouts of liquidity stress during this period. 3 USD/INR Buy/Sell swaps injected durable liquidity of approximately ₹2.16 lakh crore into the banking system. 4 The total monetary liability of the Reserve Bank, reflected in the quantum of reserve money in the economy, is the sum of NDA and NFA of the Reserve Bank. 5 Temporary liquidity tightness resulted in overnight rates breaching the ceiling of the policy corridor (MSF rate) occasionally during the year. 6 Patra, M. D., Bhattacharyya, I., John, J., and Kumar, A. (2024), ‘Monetary Policy Transmission in India: The Recent Experience’, RBI Monthly Bulletin, October. 7 The introduction of external benchmark-based lending rate (EBLR) for floating rate loans was a major initiative in October 2019. 8 Foreign banks had 92.2 per cent share of EBLR-linked loans in total outstanding floating rupee loans as at end-December 2024. |

Share this page:


Install the RBI mobile application and get quick access to the latest news!


