As per the extant practice, India's external debt statistics for the quarters ending March and June are compiled and released by the Reserve Bank of India and for the quarters ending September and December are compiled and released by the Ministry of Finance, Government of India. The external debt statistics are released with a lag of one quarter. A detailed account of external debt as compiled in the standard format as at end-June 2009 in rupee and US dollar terms and revised data for the earlier quarters are set out in Statement 1 and 2, respectively.
Major Highlights of External Debt
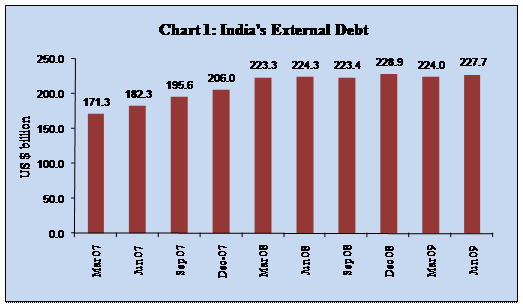
- India’s external debt stood at US$ 227.7 billion at the end of June 2009. The increase in external debt by US$ 3.7 billion over end-March 2009 level was mainly due to increase in long term external debt, particularly Non-Resident Indian (NRI) deposits.
- Excluding the valuation effects due to depreciation of US dollar against other major currencies and Indian rupee during the first quarter of the financial year 2009-10, the stock of external debt as at end-June 2009 would have declined by US$ 1.3 billion as compared to the stock as at end-March 2009.
- The share of US dollar denominated debt in the total external debt declined to 54.4 per cent as at end-June 2009 from 56.3 per cent as at end-March 2009.
- Based on the original maturity, the share of short-term to total debt declined to 17.8 per cent at end-June 2009 from 19.5 per cent at end-March 2009.
- Based on the residual maturity, the short-term debt accounted for 39.1 per cent of the total external debt at end-June 2009.
- The share of non-Government debt in the total external debt declined marginally to 74.8 per cent as at end-June 2009 from 75.5 per cent as at end-March 2009.
- The debt service ratio declined steadily during the last three years and stood at 4.6 per cent as at end-March 2009. The debt service ratio for April-June 2009 worked out to 5.5 per cent.
1. India’s External Debt as at the end of June 2009
- India’s external debt was placed at US$ 227.7 billion at the end of June 2009 as compared to US$ 224.0 billion as at end of March 2009. The increase in the external debt outstanding as at end-June 2009 by US$ 3.7 billion or 1.7 per cent over the end-March 2009 level was mainly due to the increase in long term external debt, particularly Non-Resident Indian (NRI) deposits (Table 1 and Chart 1). The external debt outstanding as at end-June 2009 increased by US$ 3.4 billion or 1.5 per cent over the end-June 2008 level.
Table 1: External Debt Outstanding |
(US$ billion) |
At end of |
Total External Debt |
Variation |
Over corresponding Quarter of the Previous Year |
Over the Previous Quarter |
Amount |
Per cent |
Amount |
Per cent |
1 |
2 |
3 |
4 |
5 |
6 |
March 2007 |
171.3 |
33.2 |
24.0 |
10.9 |
6.8 |
June 2007 |
182.3 |
37.3 |
25.7 |
11.0 |
6.4 |
September 2007 |
195.6 |
45.0 |
29.8 |
13.3 |
7.3 |
December 2007 |
206.0 |
45.6 |
28.5 |
10.4 |
5.3 |
March 2008 |
223.3 |
52.0 |
30.3 |
17.3 |
8.4 |
June 2008 |
224.3 |
42.0 |
23.0 |
1.0 |
0.4 |
September 2008 |
223.4 |
27.8 |
14.2 |
-0.8 |
-0.4 |
December 2008 |
228.9 |
23.0 |
11.1 |
5.5 |
2.5 |
March 2009 PR |
224.0 |
0.6 |
0.3 |
-5.0 |
-2.2 |
June 2009 P |
227.7 |
3.4 |
1.5 |
3.7 |
1.7 |
P: Provisional; PR: Partially Revised.
Source: Ministry of Finance, Government of India and Reserve Bank of India |
2. Valuation Changes
- The valuation effect reflecting the depreciation of the US dollar against other major international currencies and Indian rupee during the first quarter of the financial year 2009-10 resulted in an increase in the external debt by US$ 5.0 billion as compared to the end-March 2009 level. This implies that excluding the valuation effect, the stock of external debt as at end-June 2009 would have declined by US$ 1.3 billion over the end-March 2009 level.
3. Components of External Debt
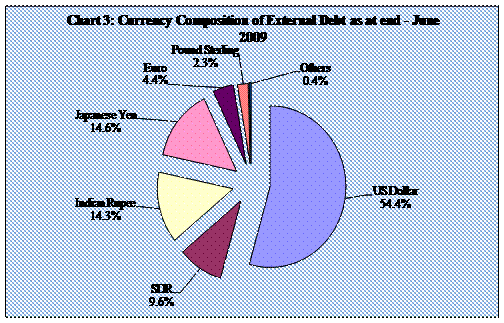
- By way of composition of external debt, the share of commercial borrowings (27.7 per cent) continued to be the highest followed by NRI deposits (19.6 per cent), multilateral debt (18.1 per cent), short-term debt (17.8 per cent) and bilateral debt (9.4 per cent) as at end-June 2009 (Table 2).
- The long-term debt at US$ 187.1 billion and short-term debt at US$ 40.6 billion accounted for 82.2 per cent and 17.8 per cent, respectively, of the total external debt as at end-June 2009.
- The increase in long-term debt by US$ 6.7 billion as at end June 2009 was mainly due to the increase in NRI deposits.
- External commercial borrowings showed a marginal increase of US$ 645 million over end-March 2009, mainly due to increase in commercial bank loans and FII investment in Government securities and corporate bonds.
- Short-term debt at US$ 40.6 billion, however, declined by US$ 3.0 billion as at end-June 2009 as compared to the level of end-March 2009 mainly on account of decline in short-term trade credit (up to 6 months) (Table 3 and Chart 2).
- Short-term trade credit stood lower at US$ 37.1 billion as at end-June 2009 as compared with US$ 40.2 billion at end-March 2009.
- Outstanding NRI deposits at US$ 44.6 billion as at end-June 2009 increased by US$ 3.0 billion over the level at end-March 2009 on account of increase in inflows under NRI deposit schemes reflecting a positive influence of hike in ceiling interest rates in a phased manner during 2008-09.
Table 2: External Debt by Component |
(US $ million) |
Item |
End- March |
End-June |
|
1991 |
1998 |
2005 |
2006 |
2007 |
2008 |
2009 PR |
2008 |
2009 P |
1 |
2 |
3 |
4 |
5 |
6 |
7 |
8 |
9 |
10 |
1. Multilateral |
20,900 |
29,553 |
31,744 |
32,620 |
35,337 |
39,490 |
39,538 |
39,644 |
41,236 |
|
(24.9) |
(31.6) |
(23.9) |
(23.6) |
(20.6) |
(17.7) |
(17.7) |
(17.7) |
(18.1) |
2. Bilateral |
14,168 |
16,969 |
17,034 |
15,761 |
16,065 |
19,701 |
20,605 |
18,724 |
21,417 |
|
(16.9) |
(18.1) |
(12.8) |
(11.4) |
(9.4) |
(8.8) |
(9.2) |
(8.3) |
(9.4) |
3. IMF |
2,623 |
664 |
0 |
0 |
0 |
0 |
0 |
0 |
0 |
|
(3.1) |
(0.7) |
(0.0) |
(0.0) |
(0.0) |
(0.0) |
(0.0) |
(0.0) |
(0.0) |
4. Trade Credit |
4,301 |
6,526 |
5,022 |
5,420 |
7,165 |
10,358 |
14,625 |
11,030 |
15,055 |
|
(5.1) |
(7.0) |
(3.8) |
(3.9) |
(4.2) |
(4.6) |
(6.5) |
(4.9) |
(6.6) |
5. ECBs |
10,209 |
16,986 |
26,405 |
26,452 |
41,443 |
62,337 |
62,508 |
61,058 |
63,153 |
|
(12.2) |
(18.2) |
(19.9) |
(19.1) |
(24.2) |
(27.9) |
(27.9) |
(27.2) |
(27.7) |
6. NRI |
10,209 |
11,913 |
32,743 |
36,282 |
41,240 |
43,672 |
41,554 |
42,612 |
44,579 |
|
(12.2) |
(12.7) |
(24.6) |
(26.3) |
(24.1) |
(19.6) |
(18.6) |
(19.0) |
(19.6) |
7. Rupee Debt |
12,847 |
5,874 |
2,302 |
2,059 |
1,951 |
2,016 |
1,527 |
1,866 |
1,607 |
|
(15.3) |
(6.3) |
(1.7) |
(1.5) |
(1.1) |
(0.9) |
(0.7) |
(0.8) |
(0.7) |
8. Long-term Debt (1to 7) |
75,257 |
88,485 |
1,15,250 |
1,18,594 |
1,43,201 |
1,77,574 |
1,80,357 |
1,74,934 |
1,87,047 |
|
(89.8) |
(94.6) |
(86.7) |
(85.9) |
(83.6) |
(79.5) |
(80.5) |
(78.0) |
(82.2) |
9. Short-term Debt |
8,544 |
5,046 |
17,723 |
19,539 |
28,130 |
45,738 |
43,596 |
49,330 |
40,641 |
|
(10.2) |
(5.4) |
(13.3) |
(14.1) |
(16.4) |
(20.5) |
(19.5) |
(22.0) |
(17.8) |
Total (8+9) |
83,801 |
93,531 |
1,32,973 |
1,38,133 |
1,71,331 |
2,23,312 |
2,23,953 |
2,24,264 |
2,27,688 |
|
(100.0) |
(100.0) |
(100.0) |
(100.0) |
(100.0) |
(100.0) |
(100.0) |
(100.0) |
(100.0) |
P : Provisional; PR: Partially Revised.
IMF: International Monetary Fund; ECBs: External Commercial Borrowings; NRI: Non-Resident Deposits
Note: Figures in parentheses are percentage to total external debt.
Source: Ministry of Finance, Government of India and Reserve Bank of India. |
Table 3: Variation in Components of External Debt |
Item |
External Debt Outstanding at the end-of (US $ million) |
Absolute Variation (US $ million) |
Percentage Variation (per cent) |
Mar 08 |
Mar 09 (PR) |
Jun 09 (P) |
Mar 09
over
Mar 08 |
Jun 09 over
Mar 09 |
Mar 09
over
Mar 08 |
Jun 09 over
Mar 09 |
1 |
2 |
3 |
4 |
5 |
6 |
7 |
8 |
1. Multilateral |
39,490 |
39,538 |
41,236 |
48 |
1,698 |
0.1 |
4.3 |
2. Bilateral |
19,701 |
20,605 |
21,417 |
904 |
812 |
4.6 |
3.9 |
3. IMF |
- |
- |
- |
- |
- |
- |
- |
4. Export Credit |
10,358 |
14,625 |
15,054 |
4,267 |
429 |
41.2 |
2.9 |
5.Commercial Borrowing |
62,337 |
62,508 |
63,153 |
171 |
645 |
0.3 |
1.0 |
6. NRI Deposits |
43,672 |
41,554 |
44,579 |
-2,118 |
3,025 |
-4.8 |
7.3 |
7. Rupee Debt |
2,016 |
1,527 |
1,607 |
-489 |
80 |
-24.3 |
5.2 |
8. Short term Debt |
45,738 |
43,596 |
40,641 |
-2,142 |
-2,955 |
-4.7 |
-6.8 |
| of which: |
|
|
|
|
|
|
|
(i) Short term trade credit |
41,901 |
40,198 |
37,113 |
-1,703 |
-3,085 |
-4.1 |
-7.7 |
Total Debt (1 to 8) |
223,312 |
223,953 |
227,688 |
641 |
3,735 |
0.3 |
1.7 |
Memo Items |
|
|
|
|
|
|
|
A. Long-Term Debt (1 to 7) |
177,574 |
180,357 |
187,047 |
2,783 |
6,690 |
1.6 |
3.7 |
B. Short-Term Debt |
45,738 |
43,596 |
40,641 |
-2,142 |
-2,955 |
-4.7 |
-6.8 |
P: Provisional PR: Partially Revised -: Nil
Source: Ministry of Finance, Government of India and Reserve Bank of India. |
 |
4. External Commercial Borrowings
- The ECB approval for April-June 2009 stood lower at US$ 2.7 billion as compared with US$ 3.8 billion for the corresponding quarter of the previous year. As a result, there was a lower disbursement of ECB during April-June 2009 (Table 4).
Table 4: External Commercial Borrowings |
(US $ million) |
Year |
Approvals# |
Gross Disbursement* |
Amortisation* |
Interest* |
Total Servicing |
ECB Debt Outstanding |
1 |
2 |
3 |
4 |
5 |
6 (4+5) |
7 |
1990-91 |
1,903 |
4,252 |
2,004 |
1,410 |
3,414 |
10,209 |
1991-92 |
2,127 |
3,133 |
1,677 |
1,153 |
2,830 |
11,715 |
1992-93 |
2,200 |
1,167 |
1,525 |
1,182 |
2,707 |
11,643 |
1993-94 |
2,585 |
2,913 |
1,978 |
1,254 |
3,232 |
12,363 |
1994-95 |
4,469 |
4,152 |
2,812 |
1,478 |
4,290 |
12,991 |
1995-96 |
6,286 |
4,252 |
3,868 |
1,380 |
5,248 |
13,873 |
1996-97 |
8,581 |
7,571 |
4,605 |
1,354 |
5,959 |
14,335 |
1997-98 |
8,712 |
7,371 |
3,550 |
1,384 |
4,934 |
16,986 |
1998-99 |
5,200 |
7,226 |
3,477 |
1,593 |
5,070 |
20,978 |
1999-00 |
3,398 |
3,187 |
4,147 |
1,653 |
5,800 |
19,943 |
2000-01 |
2,837 |
9,621 |
5,378 |
1,695 |
7,073 |
24,408 |
2001-02 |
2,653 |
2,684 |
4,107 |
1,456 |
5,563 |
23,320 |
2002-03 |
4,235 |
3,505 |
5,019 |
1,167 |
6,186 |
22,472 |
2003-04 |
6,671 |
5,225 |
8,045 |
2,119 |
10,164 |
22,007 |
2004-05 |
11,490 |
9,084 |
3,571 |
959 |
4,530 |
26,405 |
2005-06 |
17,175 |
14,343 |
11,584 |
3,165 |
14,749 |
26,452 |
2006-07 |
25,353 |
20,257 |
3,814 |
2,517 |
6,331 |
41,443 |
2007-08 PR |
28,900 |
28,784 |
6,119 |
3,652 |
9,771 |
62,337 |
2008-09 PR |
17,200 |
13,377 |
6,439 |
3,962 |
10,401 |
62,508 |
2008-09(Apr-Jun) |
3,775 |
2,356 |
1,100 |
944 |
2,044 |
61,058 |
2009-10(Apr-Jun) P |
2,685 |
1,848 |
2,115 |
856 |
2,973 |
63,153 |
P: Provisional; PR: Partially Revised;
* : Revised; based on Balance of Payments data.
# : Based on date of agreement of the loan which may differ from the date of granting the loan registration number by the RBI. Ceiling on ECB approvals is fixed on the basis of the latter, which may either be after or before the date of agreement of the loan. Hence, there may be some difference between the amount shown under approvals in the table and the amount of ceiling fixed for a particular year.
Note: Disbursements during 1998-99 and 2000-01 include RIBs (US$ 4.2 billion) and IMDs (US$ 5.5 billion), respectively. Debt service payments during 2003-04 and 2005-06 include redemption of RIBs and IMDs, respectively. |
5. Currency Composition
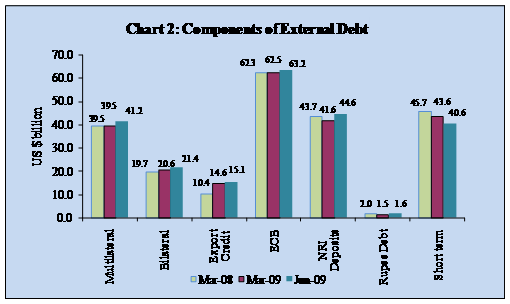
- While the US dollar is generally used as the numeraire currency for computing external debt in order to facilitate international comparison, the currency composition of the external debt is essential to understand the currencies in which the debt is actually denominated. It gives an idea of the extent of exposure of the economy to cross currency exchange rate movements. The currency composition of India’s external debt is generally disseminated in terms of major foreign currencies such as US dollar, Japanese Yen, Euro, Pound Sterling, Special Drawing Rights (SDR) and the domestic currency i.e., Indian Rupee.
- The US dollar continues to remain the predominant currency accounting for 54.4 per cent of the total external debt stock as at end-June 2009. However, there was a decline in the share of US dollar dominated external debt as compared to its share in the external debt as at end-March 2009.
- There was an increase in the share of Japanese yen (14.6 per cent), Indian rupee (14.3 per cent), SDR (9.6 per cent) and Euro (4.4 per cent) in the total external debt as at end-June 2009 as compared to its share in the external debt as at end-March 2009 (Table 5 and Chart 3).
Table 5 : Currency Composition of India’s External Debt |
(Percentage Share in Total External Debt) |
|
End-March |
End-June |
Currency |
2005 |
2006 |
2007 |
2008 |
2009 PR |
2009 P |
1 |
2 |
3 |
4 |
5 |
6 |
7 |
US Dollar |
48.0 |
49.2 |
51.4 |
54.4 |
56.3 |
54.4 |
SDR |
14.2 |
13.7 |
11.9 |
10.0 |
9.4 |
9.6 |
Indian Rupee |
19.6 |
18.9 |
18.6 |
17.5 |
13.6 |
14.3 |
Japanese Yen |
10.5 |
10.9 |
11.5 |
12.0 |
14.3 |
14.6 |
Euro |
4.6 |
4.4 |
3.9 |
3.6 |
4.1 |
4.4 |
Pound Sterling |
2.6 |
2.6 |
2.4 |
2.2 |
1.9 |
2.3 |
Others |
0.5 |
0.3 |
0.3 |
0.3 |
0.4 |
0.4 |
Total |
100 |
100 |
100 |
100 |
100 |
100 |
P: Provisional; PR: Partially Revised
Source: Ministry of Finance, Government of India and Reserve Bank of India |
6. Instrument-wise Classification of External Debt
- The instrument-wise classification of India’s external debt as at end-June 2009 reveals that the share of ‘loans’ in the total external debt outstanding accounted for 53.8 per cent as compared to 53.1 per cent as at end-March 2009 (Table 6).
- The group ‘currency and deposits’ and ‘trade credits’ together accounted for 48.6 per cent of the total non-Government debt as at end-June 2009 as compared with 49.0 per cent as at end-March 2009.
Table 6: Instrument-wise Classification of External Debt Outstanding |
(US$ million) |
Sr. No. |
Borrower |
End-March 2009 PR |
End-June 2009 P |
1 |
2 |
3 |
4 |
A. |
Government (1+2) |
54,856 |
57,446 |
1. |
Short-Term |
939 |
1,248 |
|
(i) Money Market Instruments |
939 |
1,248 |
2. |
Long-term {(i)+(ii)+(iii)} |
53,917 |
56,199 |
|
(i) Bonds and Notes |
963 |
1,275 |
|
(ii) Loans |
51,680 |
53,605 |
|
(iii) Trade Credits |
1,274 |
1,319 |
B. |
Monetary Authority |
764 |
769 |
1. |
Short-term |
764 |
769 |
|
(i) Currency and Deposits |
764 |
769 |
C. |
Non-Government (1+2) |
1,68,334 |
1,69,472 |
1. |
Short-Term {(i)+(ii)} |
41,893 |
38,624 |
|
(i) Money Market Instruments |
1,695 |
1,512 |
|
(ii) Trade Credits |
40,198 |
37,113 |
2. |
Long-term {(i)+(ii)+(iii)+(iv)} |
1,26,440 |
1,30,848 |
|
(i) Bonds and Notes |
16,932 |
16,779 |
|
(ii) Loans |
67,232 |
68,780 |
|
(iii) Currency and Deposits |
41,554 |
44,579 |
|
(iv) Trade Credits |
722 |
710 |
|
Total External Debt (A+B+C) |
2,23,953 |
2,27,688 |
P: Provisional; PR: Partially Revised
Source: Ministry of Finance, Government of India and Reserve Bank of India |
7. Short-term Debt
- The short-term debt has become an important component for measuring the liquidity and refinancing risks. In the recent years, efforts have been made to expand the coverage of short-term external debt. The data on short-term debt now includes suppliers’ credit up to and above 180 days, FII investments in Government debt, investment by foreign central banks and international institutions in Treasury Bills and external liabilities of central banks and commercial banks.
- Short-term debt by original maturity as at end-June 2009 declined to US$ 40.6 billion as against US$ 43.6 billion as at end-March 2009 mainly due to decline in short-term trade credits.
- The share of trade related credits in total short-term debt stood at 91.3 per cent as at end-June 2009.
- The ratio of trade credits to imports declined to 13.6 per cent as at end-March 2009 as against 16.3 per cent as at end-March 2008 (Table 7).
Table 7: Short-Term Debt by Original Maturity |
(US $ million) |
Components |
End-March |
End -June |
2005 |
2006 |
2007 |
2008 |
2009 PR |
2008 |
2009 P |
1 |
2 |
3 |
4 |
5 |
6 |
7 |
8 |
A |
Short-Term Debt |
17,723 |
19,539 |
28,130 |
45,738 |
43,596 |
49,330 |
40,641 |
|
(a) Trade related credits * |
16,271 |
19,399 |
25,979 |
41,901 |
40,198 |
46,270 |
37,113 |
|
(i) above 6 months and upto 1year |
7,529 |
8,696 |
11,971 |
22,884 |
23,346 |
24,361 |
23,882 |
|
(ii) Upto 6 months |
8,742 |
10,703 |
14,008 |
19,017 |
16,852 |
21,909 |
13,231 |
|
(b) FII Investments in Govt Treasury
Bills & other instruments |
1,452 |
140 |
397 |
651 |
2,065 |
676 |
2,149 |
|
(c) Investment in Treasury Bills by
foreign central banks and
international institutions etc. |
- |
- |
164 |
155 |
105 |
149 |
104 |
|
(d) External Debt Liabilities of: |
- |
- |
1,590 |
3,031 |
1,228 |
2,235 |
1,275 |
|
(i) Central Bank |
- |
- |
501 |
1,115 |
764 |
975 |
769 |
|
(ii) Commercial Bank |
- |
- |
1,089 |
1,916 |
464 |
1,260 |
507 |
B |
Imports (during the year) # |
1,18,908 |
1,57,056 |
1,90,670 |
2,57,789 |
2,94,587 |
80,545 |
64,775 |
C |
Trade Credits to Imports (%) |
13.7 |
12.4 |
13.6 |
16.3 |
13.6 |
- |
- |
P: Provisional; PR: Partially Revised
*: Data on short-term Trade Credits of less than six months in respect of suppliers’ credit and FII investment in debt papers are included since end-March 2005. |
#: On balance of payments basis |
Source: Ministry of Finance, Government of India and Reserve Bank of India |
8. External Debt by Residual Maturity
- While external debt is generally compiled in terms of original maturity, analysing the external debt, in particular, short term debt in terms of residual maturity is important from the point of view of foreign exchange liquidity management and to ascertain the total foreign exchange outgo on account of debt service payments in the immediate future.
- The ‘short-term debt by residual maturity’ comprises repayments due under medium and long-term debt by original maturity during one year reference period along with the short-term debt with original maturity. The balance constitutes the long-term debt by residual maturity.
- As at end-March 2009, the revised short-term debt by residual maturity stood at US$ 87.5 billion, which has increased to US$ 89.1 billion as at end-June 2009.
- Based on residual maturity, the short-term debt accounted for 39.1 per cent of total external debt as at end-June 2009. The ratio of short-term debt by residual maturity to foreign exchange reserves worked out to 33.6 per cent at end-June 2009 (Table 8).
Table 8: Residual Maturity of External Debt Outstanding as at End-June 2009 |
(US $ million) |
|
Short-term |
Long term |
Total
(2) to (5) |
Components |
Up to one year |
1 to 2 years |
2 to 3 years |
More than 3 years |
1 |
2 |
3 |
4 |
5 |
6 |
| 1. Sovereign Debt |
2,839 |
3,036 |
3,223 |
47,102 |
56,200 |
2. Commercial Borrowing
(including trade credit) |
10,124 |
13,174 |
14,929 |
48,041 |
86,268 |
3. NRI deposits {(i)+(ii)+(iii)} |
35,526 |
4,466 |
3,526 |
1,061 |
44,579 |
(i) FCNR(B) |
10,931 |
2,032 |
925 |
126 |
14,014 |
(ii) NR(E)RA |
20,386 |
1,996 |
1,871 |
699 |
24,952 |
(iii) NRO |
4,210 |
438 |
730 |
236 |
5,613 |
4. Short-Term Debt*
(Original maturity) |
40,641 |
- |
- |
- |
40,641 |
Total (1 to 4) |
89,130 |
20,676 |
21,678 |
96,204 |
227,688 |
Memo Items |
|
|
|
|
|
Short-term debt
(Residual maturity as per cent of total debt |
39.1 |
|
|
|
|
Short-term debt (Residual maturity as
per cent of Reserves) |
33.6 |
|
|
|
|
*: Also includes short-term component of sovereign debt amounting to US$ 1,114 million
Note: Residual Maturity of NRI Deposits is estimated on the basis of the Survey conducted by the Reserve Bank on NRI deposits outstanding as on June 30, 2009.
Source: Ministry of Finance, Government of India and Reserve Bank of India. |
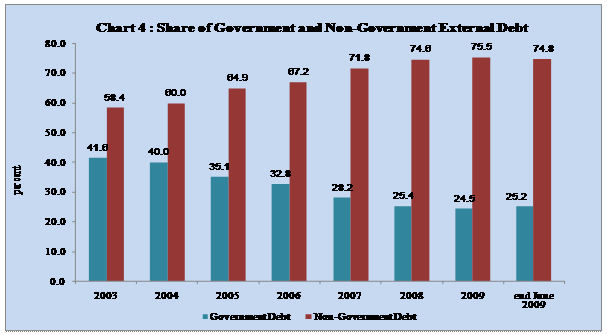
9. Government and Non-Government External Debt
- Government (Sovereign) external debt stood at US$ 57.5 billion as at end-June 2009, while non-Government debt amounted to US$ 170.2 billion.
- The share of non-Government debt in total external debt has increased steadily since March 2003. However, the share of non-Government debt in total external debt declined to 74.8 per cent as at end-June 2009 as compared to 75.5 per cent as at end-March 2009 (Table 9 and Chart 4).
Table 9: Government and Non-Government External Debt |
(US $ million) |
Sr No. |
Components |
End-March |
End-June |
2005 |
2006 |
2007 |
2008 |
2009 |
2009 |
1 |
2 |
3 |
4 |
5 |
6 |
7 |
9 |
A. |
Sovereign Debt (I+II) |
46,668 |
45,278 |
48,331 |
56,947 |
54,856 |
57,446 |
|
(As a percentage of GDP) |
(6.5) |
(5.6) |
(5.1) |
(4.8) |
(5.3) |
- |
I. |
External Debt on Government Account under External Assistance |
43,686 |
43,510 |
46,155 |
52,538 |
51,816 |
53,716 |
II. |
Other Government External Debt @ |
2,982 |
1,768 |
2,176 |
4,409 |
3,040 |
3,730 |
B. |
Non-Government Debt # |
86,305 |
92,855 |
123,000 |
166,365 |
169,097 |
170,242 |
|
(As a percentage of GDP) |
(12.0) |
(11.5) |
(13.0) |
(14.1) |
(16.2) |
- |
C. |
Total External Debt (A+B) |
1,32,973 |
1,38,133 |
1,71,331 |
2,23,312 |
223,953 |
2,27,688 |
|
(As a percentage of GDP) |
(18.5) |
(17.2) |
(18.1) |
(18.9) |
( 21.4) |
- |
@: Other Government external debt includes defence debt, investment in Treasury Bills/ Government securities by FIIs, foreign central banks and international institutions. |
#: Includes external debt of Monetary Authority. |
Source: Ministry of Finance, Government of India and Reserve Bank of India. |
 |
10. Debt Service Payments
- India’s debt service ratio has improved progressively over the years owing to the combined effect of moderation in debt service payments and growth in external current receipts. The debt service ratio had declined from a peak of 35.3 per cent in 1990-91 to 5.9 per cent in 2004-05 but increased to 10.1 per cent during 2005-06 due to repayments relating to the India Millennium Deposits. The debt service ratio declined to 4.6 per cent during 2008-09. The debt service ratio for April-June 2009 stood at 5.5 per cent (Table 10).
Table 10 : India’s External Debt Service Payments |
(US $ million) |
Sr. No. |
Item |
1990-91 |
2000-01 |
2005-06 |
2006-07 |
2007-08 |
2008-09 |
End-June 2009 |
1 |
2 |
3 |
4 |
5 |
6 |
7 |
8 |
9 |
1 |
External Assistance |
2,315 |
3,444 |
2,652 |
2,942 |
3,241 |
3,381 |
862 |
|
Repayment |
1,187 |
2,338 |
1,945 |
1,960 |
2,099 |
2,372 |
620 |
|
Interest |
1,128 |
1,106 |
707 |
982 |
1,142 |
1,009 |
242 |
2 |
External Commercial Borrowings |
3,414 |
7,073 |
14,839 |
6,331 |
9,771 |
10,401 |
2,973 |
|
Repayment |
2,004 |
5,378 |
11,824 |
3,814 |
6,119 |
6,439 |
2,115 |
|
Interest |
1,410 |
1,695 |
3,015 |
2,517 |
3,652 |
3,962 |
858 |
3 |
I.M.F. |
778 |
26 |
0 |
0 |
0 |
0 |
0 |
|
Repayment |
644 |
26 |
0 |
0 |
0 |
0 |
0 |
|
Interest |
134 |
0 |
0 |
0 |
0 |
0 |
0 |
4 |
NRI Deposits Interest |
1,282 |
1,661 |
1,497 |
1,969 |
1,813 |
1,547 |
393 |
5 |
Rupee Debt Services Repayments |
1,193 |
617 |
572 |
162 |
121 |
101 |
23 |
6 |
Total Debt Service (1 to 5) |
8,982 |
12,821 |
19,560 |
11,404 |
14,946 |
15,430 |
4,251 |
|
Repayment |
5,028 |
8,359 |
14,341 |
5,936 |
8,339 |
8,912 |
2,758 |
|
Interest |
3,954 |
4,462 |
5,219 |
5,468 |
6,607 |
6,518 |
1,493 |
7 |
Current
Receipts # |
25,479 |
77,467 |
1,94,170 |
2,42,811 |
3,14,014 |
3,37,095 |
77,427 |
|
Debt Service Ratio (6/7) (%) |
35.3 |
16.6 |
10.1 |
4.7 |
4.8 |
4.6 |
5.5 |
#: Current Receipts minus Official Transfers.
Note: Debt service ratio is defined as total repayments of principal and interest on debt as a ratio of current receipts.
Source: Ministry of Finance, Government of India and Reserve Bank of India |
- Based on outstanding long-term debt, as at end-March 2009, the total debt service payments will be higher at US$ 22.8 billion during 2012-13. The repayment of NRI deposits and FII investment in debt securities are not included in the projections. The projections do not include future debt service obligations arising out of fresh borrowings.
- At end-March 2009, the projected debt service payments for External Commercial Borrowings (ECBs) and Foreign Currency Convertible Bonds (FCCBs) revealed that the principal repayments between 2011-12 and 2012-13 would be higher (Table 11).
Table 11: Projected Debt Service Payments |
(US $ million) |
Year |
Long-Term Debt |
Of which:
ECBs and FCCBs |
Principal |
Interest |
Total |
Principal |
Interest |
Total |
1 |
2 |
3 |
4 |
5 |
6 |
7 |
2009-10 |
11277 |
3093 |
14,370 |
7,842 |
1,363 |
9,204 |
2010-11 |
13059 |
3375 |
16,434 |
10,215 |
1,819 |
12,035 |
2011-12 |
16819 |
3817 |
20,636 |
13,627 |
2,257 |
15,884 |
2012-13 |
19131 |
3647 |
22,778 |
15,508 |
2,045 |
17,553 |
2013-14 |
13755 |
2523 |
16,278 |
10,221 |
949 |
11,170 |
2014-15 |
9213 |
2195 |
11,408 |
6,157 |
625 |
6,782 |
2015-16 |
7496 |
1924 |
9,420 |
4,132 |
472 |
4,604 |
2016-17 |
7331 |
1691 |
9,022 |
3,804 |
338 |
4,142 |
2017-18 |
6063 |
1462 |
7,525 |
2,404 |
226 |
2,629 |
2018-19 |
5543 |
1273 |
6,816 |
1,748 |
153 |
1,900 |
ECBs: External Commercial Borrowings;
FCCBs: Foreign Currency Convertible Bonds.
Note: Projections on debt servicing in respect of long-term debt are based on the debt outstanding position at end-March 2009. The projections for ECBs and FCCBs are based on the outstanding position at end-June 2009. The projections exclude NRI deposits and FII investment in government debt securities. |
11. Sustainability of India’s External Debt
- An assessment of sustainability of external debt is generally undertaken based on the trends in certain key ratios such as debt to GDP ratio, debt service ratio, short-term debt to total debt and total debt to foreign exchange reserves. India has managed its external debt successfully as reflected in the perceptible improvement in various external debt sustainability indicators (Table 12).
- The ratio of external debt to GDP has increased to 21.4 per cent as at end-March 2009 from 18.9 per cent as at end-March 2008.
- The debt service ratio declined steadily during the last three years and stood at 4.6 per cent as at end-March 2009. The debt service ratio for April-June 2009 worked out to 5.5 per cent.
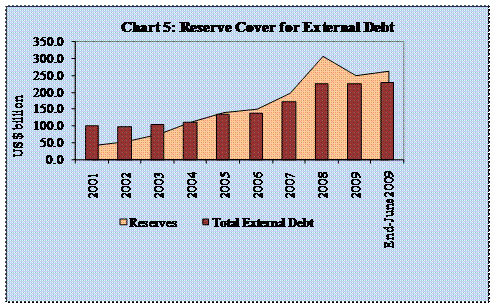
- India’s foreign exchange reserves provide a cover of 116.5 per cent to the external debt stock at the end of June 2009 as compared to 112.5 per cent at end-March 2009 (Chart 5).
- The share of concessional debt in total external debt increased marginally to 19.0 per cent as at end-June 2009 from 18.7 per cent at end-March 2009.
- The ratio of short-term debt to foreign exchange reserves at 15.3 per cent as at end-June 2009 was lower compared to 17.3 per cent as at end-March 2009.
- The ratio of short-term to total debt declined to 17.8 per cent at end-June 2009 from 19.5 per cent at end-March 2009.
Table 12: India’s Key External Debt Indicators |
Year |
External Debt
(US $ billion) |
Ratio of External Debt to GDP (%) |
Debt Service Ratio (%) |
Ratio of Foreign Exchange Reserves to Total Debt
(%) |
Ratio of Concessional Debt to Total Debt (%) |
Ratio of Short-Term Debt to Foreign Exchange Reserves (%) |
Ratio of Short- Term Debt to Total Debt (%) |
1 |
2 |
3 |
4 |
5 |
6 |
7 |
8 |
1990-91 |
83.8 |
28.7 |
35.3 |
7.0 |
45.9 |
146.5 |
10.2 |
1995-96 |
93.7 |
27.0 |
26.2 |
23.1 |
44.7 |
23.2 |
5.4 |
2000-01 |
101.3 |
22.5 |
16.6 |
41.7 |
35.4 |
8.6 |
3.6 |
2001-02 |
98.8 |
21.1 |
13.7 |
54.7 |
35.9 |
5.1 |
2.8 |
2002-03 |
104.9 |
20.3 |
16.0* |
72.5 |
36.8 |
6.1 |
4.5 |
2003-04 |
111.6 |
17.8 |
16.1** |
101.2 |
36.1 |
3.9 |
4.0 |
2004-05 |
133.0 |
18.5 |
5.9^ |
106.4 |
30.9 |
12.5 |
13.3 |
2005-06 |
138.1 |
17.2 |
10.1# |
109.8 |
28.6 |
12.9 |
14.1 |
2006-07 |
171.3 |
18.1 |
4.7 |
116.2 |
23.1 |
14.1 |
16.4 |
2007-08 |
223.3 |
18.9 |
4.8 |
138.7 |
19.8 |
14.8 |
20.5 |
2008-09 |
224.0 |
21.4 |
4.6 |
112.5 |
18.7 |
17.3 |
19.5 |
End-June 2009 |
227.7 |
.. |
5.5 |
116.5 |
19.0 |
15.3 |
17.8 |
* Works out to 12.4 %, with the exclusion of prepayment of external debt of US $ 3,430 million |
** Works out to 8.2 % with the exclusion of pre payment of external debt of US $ 3,797 million and redemption of RIBs of US $ 5,549 million. |
^ works out to 5.7 % with the exclusion of pre payment of external debt of US $ 381 million. |
# works out to 6.3 % with the exclusion of IMD repayments of US $ 7.1 billion and pre payment of external debt of US $ 23.5 million. |
Source: Ministry of Finance, Government of India and Reserve Bank of India |
 |
12. Cross Country Comparison
- According to the latest data available on Global Development Finance Online Database, World Bank, the international comparison of external debt of the twenty most indebted countries manifests that India was the fifth most indebted country in 2007 as compared with third position in 1990 (Table 13).
Table 13: Total External Debt Outstanding |
(US $ billion) |
Country Name |
1990 |
2000 |
2004 |
2005 |
2006 |
2007 |
1 |
2 |
3 |
4 |
5 |
6 |
7 |
All developing countries |
1,283.1 |
2,177.8 |
2,636.5 |
2,633.0 |
2,858.4 |
3,466.0 |
1. China |
55.3 |
145.7 |
247.7 |
283.8 |
325.1 |
373.6 |
2. Russian Federation |
.. |
160.0 |
196.8 |
229.9 |
250.5 |
370.2 |
3. Turkey |
49.4 |
116.8 |
160.7 |
169.3 |
207.8 |
251.5 |
4. Brazil |
119.7 |
241.6 |
219.5 |
187.4 |
193.5 |
237.5 |
5. India |
83.8 |
101.3 |
133.0 |
138.1 |
171.3 |
223.3 |
6. Poland |
49.4 |
64.8 |
105.3 |
108.2 |
139.0 |
195.4 |
7. Mexico |
104.4 |
150.9 |
171.2 |
167.9 |
160.5 |
178.1 |
8. Indonesia |
69.9 |
144.3 |
139.6 |
132.8 |
130.8 |
140.8 |
9. Argentina |
62.2 |
140.9 |
162.4 |
125.0 |
115.9 |
127.8 |
10. Kazakhstan |
.. |
12.4 |
32.8 |
43.4 |
74.1 |
96.1 |
11. Romania |
1.1 |
11.2 |
29.6 |
38.9 |
54.0 |
85.4 |
12. Ukraine |
.. |
12.2 |
30.2 |
33.3 |
49.9 |
73.6 |
13. Philippines |
30.6 |
58.3 |
61.0 |
61.7 |
60.3 |
65.8 |
14. Thailand |
28.1 |
79.7 |
51.3 |
51.4 |
55.0 |
63.1 |
15. Chile |
19.2 |
37.3 |
43.8 |
45.4 |
48.0 |
58.6 |
16. Malaysia |
15.3 |
41.9 |
52.2 |
52.0 |
56.5 |
53.7 |
17. Croatia |
.. |
12.4 |
33.0 |
30.6 |
38.4 |
48.6 |
18. Colombia |
17.2 |
33.9 |
37.9 |
37.7 |
38.9 |
45.0 |
19. South Africa |
.. |
24.9 |
27.1 |
31.1 |
35.5 |
43.4 |
20. Venezuela, RB |
33.2 |
42.0 |
39.3 |
45.7 |
44.6 |
43.1 |
Note: The source data for India is Government of India and Reserve Bank of India. Therefore, the data for India pertain to financial year (April-March) and not calendar year. |
Source: Global Development Finance Online Database, World Bank, Ministry of Finance, Government of India and Reserve Bank of India |
- The element of concessionality in India’s external debt portfolio was the third highest after Indonesia and Philippines (Table 14).
- India’s debt service ratio was third lowest with China and Malaysia having first and second lowest debt service ratio, respectively.
- In terms of ratio of external debt to Gross National Product (GNP), India’s position was sixth lowest, with China having the lowest ratio of external debt to GNP.
- India’s position with respect to short-term debt to total external debt was eighth lowest with Mexico having the lowest ratio of short-term debt to total external debt.
- In terms of reserves to total debt, India’s position was third, similar to that of Thailand, as China and Malaysia had higher reserves to debt ratio than India.
Table 14: International Comparison of Top Twenty Debtor Countries, 2007 |
| |
External debt stocks, total (US $ billion) |
Concessional debt/Total debt (EDT) (%) |
Debt service ratio (%) |
External Debt to GNP(%) |
Short-term debt/Total debt (EDT) (%) |
Forex Reserves to Total Debt (%) |
1 |
2 |
3 |
4 |
5 |
6 |
7 |
China |
373.6 |
10.1 |
2.2 |
11.6 |
54.5 |
413.9 |
Russian Federation |
370.2 |
0.4 |
9.1 |
29.4 |
21.4 |
129.1 |
Turkey |
251.5 |
2.1 |
32.1 |
38.8 |
16.6 |
30.4 |
Brazil |
237.5 |
1.0 |
27.8 |
18.7 |
16.5 |
75.9 |
India |
223.3 |
19.8 |
4.8 |
18.9 |
20.5 |
138.7 |
Poland |
195.4 |
0.4 |
25.6 |
47.7 |
30.9 |
33.6 |
Mexico |
178.1 |
0.6 |
12.5 |
17.7 |
5.1 |
49.0 |
Indonesia |
140.8 |
26.2 |
10.5 |
33.9 |
24.8 |
40.4 |
Argentina |
127.8 |
1.3 |
13.0 |
49.7 |
29.8 |
36.1 |
Kazakhstan |
96.1 |
1.0 |
49.6 |
103.7 |
12.2 |
18.4 |
Romania |
85.4 |
1.6 |
19.1 |
51.5 |
35.7 |
46.8 |
Ukraine |
73.6 |
2.2 |
16.9 |
52.9 |
31.1 |
44.1 |
Philippines |
65.8 |
20.0 |
13.7 |
41.9 |
10.8 |
51.2 |
Thailand |
63.1 |
9.6 |
8.1 |
26.5 |
34.3 |
138.7 |
Chile |
58.6 |
0.4 |
14.2 |
40.3 |
22.7 |
28.7 |
Malaysia |
53.7 |
6.1 |
4.6 |
29.4 |
28.4 |
189.9 |
Croatia |
48.6 |
2.1 |
33.0 |
97.7 |
10.5 |
28.1 |
Colombia |
45.0 |
2.1 |
22.0 |
22.5 |
11.9 |
46.6 |
South Africa |
43.4 |
0.0 |
5.9 |
15.8 |
38.2 |
75.9 |
Venezuela, RB |
43.1 |
0.5 |
7.4 |
18.7 |
27.1 |
78.2 |
Source: Data for India as published by national authorities for 2007-08 and those for other countries as at end-December 2007 as available in World Bank’s Global Development Finance Online Database. |
- The Quarterly External Debt Statistics (QEDS) database, jointly developed by the World Bank and the International Monetary Fund, brings out detailed external debt data of countries that are subscribing to IMF’s Special Data Dissemination Standard/ General Data Dissemination System. The position in respect of the 63 reporting countries for the fourth quarter of the calendar year 2008 and the first quarter of the calendar year 2009, which has been published by the World Bank http://go.worldbank.org/6V603CE490 is given at Annex I .
Annex I : Gross External Debt Position of QEDS Reporting Countries for End-December 2008 and End-March 2009 |
(US$ billion) |
Sr. No. |
Countries |
2008Q4 |
2009Q1 |
Short-Term |
Long-Term |
Total |
Short-Term |
Long-Term |
Total |
1 |
2 |
3 |
4 |
5 |
6 |
7 |
8 |
1 |
Hong Kong,China |
483.9 |
176.1 |
659.9 |
486.1 |
154.4 |
640.5 |
2 |
Russian Federation |
73.0 |
410.4 |
483.5 |
60.2 |
390.6 |
450.8 |
3 |
Turkey |
50.6 |
226.6 |
277.1 |
48.1 |
217.2 |
265.3 |
4 |
Brazil |
36.4 |
226.5 |
262.9 |
32.4 |
227.6 |
259.9 |
5 |
India |
46.3 |
182.6 |
228.9 |
43.6 |
180.4 |
224.0 |
6 |
Mexico |
24.2 |
176.2 |
200.4 |
23.8 |
145.4 |
169.3 |
7 |
Indonesia |
20.5 |
134.6 |
155.1 |
17.8 |
133.3 |
151.0 |
8 |
Argentina |
35.1 |
93.1 |
128.2 |
36.0 |
91.5 |
127.5 |
9 |
Kazakhstan |
10.2 |
97.6 |
107.8 |
8.6 |
96.5 |
105.1 |
10 |
Ukraine |
20.3 |
81.4 |
101.7 |
18.8 |
80.4 |
99.2 |
11 |
Romania |
26.3 |
75.3 |
101.6 |
22.8 |
72.5 |
95.3 |
12 |
Malaysia |
30.7 |
44.7 |
75.3 |
30.4 |
43.2 |
73.6 |
13 |
South Africa |
25.5 |
46.3 |
71.8 |
23.3 |
44.1 |
67.4 |
14 |
Chile |
14.3 |
50.5 |
64.8 |
12.7 |
52.1 |
64.9 |
15 |
Thailand |
20.4 |
44.6 |
65.1 |
18.5 |
43.0 |
61.5 |
16 |
Croatia |
6.7 |
48.1 |
54.8 |
5.3 |
46.9 |
52.2 |
17 |
Colombia |
5.7 |
40.7 |
46.4 |
4.8 |
42.0 |
46.8 |
Annex I: Gross External Debt Position of QEDS Reporting Countries for End-December 2008 and End-March 2009 |
(US$ billion) |
Sr. No. |
Countries |
2008Q4 |
2009Q1 |
Short-Term |
Long-Term |
Total |
Short-Term |
Long-Term |
Total |
1 |
2 |
3 |
4 |
5 |
6 |
7 |
8 |
18 |
Armenia |
0.5 |
3.0 |
3.4 |
0.5 |
3.1 |
3.6 |
19 |
Australia |
223.0 |
547.3 |
770.3 |
209.4 |
544.2 |
753.7 |
20 |
Austria |
266.7 |
566.1 |
832.8 |
250.9 |
533.9 |
784.8 |
21 |
Belarus |
7.6 |
7.6 |
15.2 |
7.5 |
8.8 |
16.3 |
22 |
Belgium |
962.0 |
392.3 |
1,354.3 |
872.4 |
374.0 |
1,246.4 |
23 |
Bolivia |
0.3 |
5.7 |
5.9 |
0.2 |
5.7 |
5.9 |
24 |
Bulgaria |
18.5 |
32.6 |
51.1 |
17.5 |
31.0 |
48.5 |
25 |
Canada |
304.7 |
457.5 |
762.2 |
313.4 |
460.9 |
774.3 |
26 |
Costa Rica |
4.0 |
5.2 |
9.2 |
3.6 |
5.2 |
8.7 |
27 |
Czech Republic |
25.9 |
54.5 |
80.4 |
22.9 |
50.6 |
73.4 |
28 |
Denmark |
300.1 |
285.0 |
585.1 |
281.4 |
293.8 |
575.2 |
29 |
Ecuador |
1.6 |
16.5 |
18.1 |
0.0 |
0.0 |
0.0 |
30 |
Egypt |
2.8 |
29.3 |
32.1 |
2.5 |
28.4 |
30.9 |
31 |
El Salvador |
1.5 |
9.1 |
10.7 |
1.2 |
9.3 |
10.5 |
32 |
Estonia |
10.1 |
16.8 |
26.8 |
8.8 |
15.6 |
24.4 |
33 |
Finland |
113.1 |
219.1 |
332.2 |
118.4 |
231.2 |
349.7 |
34 |
France |
2,138.5 |
2,863.2 |
5,001.7 |
1,999.5 |
2,723.7 |
4,723.2 |
35 |
Georgia |
1.0 |
6.7 |
7.7 |
0.8 |
6.9 |
7.7 |
36 |
Germany |
1,723.7 |
3,526.1 |
5,249.8 |
1,635.9 |
3,363.7 |
4,999.6 |
37 |
Greece |
155.6 |
349.0 |
504.6 |
148.9 |
342.3 |
491.3 |
38 |
Hungary |
26.2 |
186.0 |
212.1 |
26.5 |
181.4 |
207.9 |
39 |
Ireland |
1,110.6 |
1,201.1 |
2,311.7 |
1,056.3 |
1,196.7 |
2,253.0 |
40 |
Israel |
33.2 |
52.9 |
86.1 |
31.4 |
52.7 |
84.1 |
41 |
Italy |
807.0 |
1,521.2 |
2,328.2 |
800.9 |
1,509.2 |
2,310.1 |
42 |
Japan |
1,415.6 |
815.1 |
2,230.6 |
1,341.1 |
747.9 |
2,088.9 |
43 |
Korea |
151.1 |
230.0 |
381.1 |
148.1 |
221.2 |
369.3 |
44 |
Kyrgyz Republic |
0.4 |
3.1 |
3.5 |
0.4 |
3.0 |
3.4 |
45 |
Latvia |
14.1 |
28.0 |
42.1 |
10.5 |
27.5 |
38.0 |
46 |
Lithuania |
8.2 |
24.3 |
32.5 |
6.9 |
23.1 |
30.0 |
47 |
Luxembourg |
1,163.5 |
769.5 |
1,933.0 |
1,126.0 |
696.6 |
1,822.6 |
48 |
Moldova |
1.4 |
2.7 |
4.1 |
1.4 |
2.6 |
4.0 |
49 |
Netherlands |
1,090.6 |
1,379.0 |
2,469.6 |
1,047.6 |
1,355.3 |
2,402.9 |
50 |
Norway |
276.9 |
281.6 |
558.5 |
258.0 |
285.9 |
543.9 |
51 |
Paraguay |
0.7 |
2.8 |
3.5 |
0.0 |
0.0 |
0.0 |
52 |
Peru |
6.1 |
28.4 |
34.6 |
4.6 |
29.6 |
34.1 |
53 |
Poland |
51.0 |
192.7 |
243.6 |
45.6 |
177.1 |
222.6 |
54 |
Portugal |
180.4 |
304.4 |
484.7 |
173.3 |
296.8 |
470.2 |
55 |
Slovak Republic |
20.1 |
32.4 |
52.5 |
24.1 |
29.1 |
53.3 |
56 |
Slovenia |
16.2 |
38.2 |
54.4 |
12.7 |
37.2 |
49.9 |
57 |
Spain |
694.2 |
1,618.4 |
2,312.6 |
686.0 |
1,554.2 |
2,240.2 |
58 |
Sweden |
303.2 |
314.3 |
617.6 |
292.9 |
306.9 |
599.8 |
59 |
Switzerland |
912.8 |
392.2 |
1,305.0 |
891.9 |
380.0 |
1,271.9 |
60 |
Tunisia |
4.3 |
16.5 |
20.8 |
4.0 |
15.5 |
19.4 |
61 |
United Kingdom |
6,798.4 |
2,371.5 |
9,169.8 |
6,444.9 |
2,290.6 |
8,735.5 |
62 |
United States |
5,414.4 |
8,227.4 |
13,641.8 |
5,169.4 |
8,230.5 |
13,399.9 |
63 |
Uruguay |
0.1 |
10.6 |
10.7 |
0.1 |
10.9 |
11.0 |
Ajit Prasad
Manager
Press Release : 2009-2010/509
|
 IST,
IST,