Banking sector
in India is currently passing through an exciting and challenging phase. The reform
measures have brought about sweeping changes in this vital sector of the country's
economy. This paper is an attempt to study the trends in important banking indicators
for the 25-year period from 1980 to 2005. Analysing the data from balance sheets
of banks, the paper draws some important conclusions for the banking sector as
a whole as well as for different bank groups.
JEL Classification
: G 21
Keywords : Commercial Banks, Annual Accounts,
Income and Expenditure, Assets and Liabilities
Introduction The
banking system is central to a nation’s economy. Banks are special as they
not only accept and deploy large amounts of uncollateralised public funds in a
fiduciary capacity, but also leverage such funds through credit creation. In India,
prior to nationalisation, banking was restricted mainly to the urban areas and
neglected in the rural and semi-urban areas. Large industries and big business
houses enjoyed major portion of the credit facilities. Agriculture, small-scale
industries and exports did not receive the deserved attention. Therefore, inspired
by a larger social purpose, 14 major banks were nationalised in 1969 and six more
in 1980. Since then the banking system in India has played a pivotal role in the
Indian economy, acting as an instrument of social and economic change. The rationale
behind bank nationalisation has been succinctly put forth by eminent bankers:
“Many bank failures and crises over two centuries, and the damage they
did under laissez faire conditions; the needs of planned
growth and equitable distribution of credit, which in
privately owned banks was concentrated mainly on the controlling industrial houses
and influential borrowers; the needs of growing small scale industry and farming
regarding finance, equipment and inputs; from all these there emerged an inexorable
demand for banking legislation, some government control and a central banking
authority, adding up, in the final analysis, to social control and nationalisation”
(Tandon, 1989).
Post nationalisation, the Indian banking system registered
tremendous growth in volume. Despite the undeniable and multifold gains of bank
nationalization, it may be noted that the important financial institutions were
all state owned and were subject to central direction and control. Banks enjoyed
little autonomy as both lending and deposit rates were controlled until the end
of the 1980s. Although nationalisation of banks helped in the spread of banking
to the rural and hitherto uncovered areas, the monopoly granted to the public
sector and lack of competition led to overall inefficiency and low productivity.
By 1991, the country’s financial system was saddled with an inefficient
and financially unsound banking sector. Some of the reasons for this were (i)
high reserve requirements, (ii) administered interest rates, (iii) directed credit
and (iv) lack of competition (v) political interference and corruption. As recommended
by the Narasimham Committee Report (1991) several reform measures were introduced
which included reduction of reserve requirements, de-regulation of interest rates,
introduction of prudential norms, strengthening of bank supervision and improving
the competitiveness of the system, particularly by allowing entry of private sector
banks. With a view to adopting the Basel Committee (1988) framework on capital
adequacy norms, the Reserve Bank introduced a risk-weighted asset ratio system
for banks in India as a capital adequacy measure in 1992. Banks were asked to
maintain risk-weighted capital adequacy ratio initially at the lower level of
4 per cent, which was gradually increased to 9 per cent. Banks were also directed
to identify problem loans on their balance sheets and make provisions for bad
loans and bring down the burgeoning problem f non- performing assets. The period
1992-97 laid the foundations for reform in the banking system (Rangarajan, 1998).
The second Narasimham Committee Report (1998) focussed on issues like strengthening
of the banking system, upgrading of technology and human resource development.
The report laid emphasis on two aspects of banking regulation, viz.,
capital adequacy and asset classification and resolution of NPA-related problems.
Commercial banks in India are expected to start implementing Basel II norms
with effect from March 31, 2007. They are expected to adopt the standardised approach
for credit risk and the basic indicator approach for operational risk initially.
After adequate skills are developed, both at the banks and at the supervisory
levels, some banks may be allowed to migrate to the internal rating based (IRB)
approach (Reddy 2005).
At present, banks in India are venturing into
non-traditional areas and generating income through diversified activities other
than the core banking activities. Strategic mergers and acquisitions are being
explored and implemented. With this, the banking sector is currently on the threshold
of an exciting phase.
Against this backdrop, this paper endeavours to
study the important banking indicators for the last 25-year period from 1981 to
2005. These indicators have been broadly grouped into different categories, viz.,
(i) number of banks and offices (ii) deposits and credit (iii) investments (iv)
capital to risk-weighted assets ratio (CRAR) (v) non performing assets (NPAs)
(vi) Income composition (vii) Expenditure composition (viii) return on assets
(ROAs) and (ix) some select ratios. Accordingly, the paper discusses these banking
indicators in nine sections in the same order as listed above. The paper concludes
in section X by drawing important inferences from the trends of these different
banking parameters.
Section I
Number of Banks and Offices The number of offices of all
scheduled commercial banks almost doubled from 29,677 in 1980 to 55,537 in 2005.
This rapid increase
Table
1: Number of Scheduled Commercial
Banks- Bank Group-wise
| Year
| SBI
& its
Associates | Nationalised
Banks | Foreign
Banks | Domestic
Private
Sector Banks | All
Scheduled
Commercial Banks |
Number
of
Banks | Number
of
Offices | Number
of
Banks | Number
of
Offices | Number
of
Banks | Number
of
Offices | Number
of
Banks | Number
of
Offices | Number
of
Banks | Number
of
Offices |
1980 | | 8 | 7745 | 20 | 18083 | 13 | NA | 34 | 3849 | 75 | 29677 |
1985 | | 8 | 10568 | 20 | 25061 | 20 | NA | 32 | 4833 | 80 | 40462 |
1990 | | 8 | 12074 | 20 | 29800 | 22 | 148 | 25 | 3961 | 75 | 45983 |
1995 | | 8 | 12947 | 19 | 31817 | 27 | 157 | 32 | 4213 | 86 | 49134 |
2000 | | 8 | 13589 | 19 | 33905 | 42 | 237 | 33 | 5437 | 101 | 53168 |
2005 | | 8 | 13896 | 20 | 35075 | 31 | 245 | 29 | 6321 | 88 | 55537 |
Note :
Number
of banks and branches of the Nationalised bank group for the year 2005 includes
IDBI Ltd.
Source :
Data on number of
bank offices are taken from Banking Statistics, 1972 to 1996, Basic Statistical
Returns, 1998 and various issues of Statistical Tables Relating to Banks
in India for the years from 1996 to 2005. | in
the number of bank offices is observed in the case of all the bank groups. However,
the number of banks in the case of foreign bank group and domestic private sector
bank group decreased from 42 in 2000 to 31 in 2005 and from 33 in 2000 to 29 in
2005, respectively. This fall in the number of banks is reflective of the consolidation
process and, in particular, the mergers and acquisitions that are the order of
the banking system at present (Table 1).
Section
II
Deposits and Credit
II.1
Credit Deposit Ratio
The credit-deposit ratio (C-D ratio)
provides an indication of the extent of credit deployment for every unit of resource
raised in the form of deposits. The C-D ratios of all scheduled commercial banks
decreased gradually from 63.3 per cent in 1980 to 49.3 per cent in 2000. This
declining trend has been reversed in the recent years, with the ratio increasing
to 62.7 per cent in 2005. The foreign bank group recorded the highest C-D ratio
(87.1 per cent) and State Bank Group the lowest (56.3 per cent) in 2005. The C-D
ratios of all the bank groups had fallen drastically in 2000, except for foreign
banks. With respect to domestic private sector banks group, this ratio
Table
2: Credit Deposit Ratios of Scheduled Commercial Banks |
(Per
cent) | Year
| SBI &
its
Associates | Nationalised
Banks | Foreign
Banks | Domestic
Private
Sector Banks | All
Scheduled
Commercial
Banks |
C-D
Ratio | C-D
Ratio | C-D
Ratio | C-D
Ratio | C-D
Ratio | 1980 | | 74.4 | 58.9 | 73.5 | 54.3 | 63.3 |
1985 | | 64.6 | 58.9 | 74.1 | 55.5 | 60.8 |
1990 | | 74.0 | 56.6 | 62.3 | 54.1 | 61.6 |
1995 | | 57.1 | 48.0 | 54.3 | 54.3 | 51.4 |
2000 | | 50.3 | 46.4 | 72.2 | 49.0 | 49.3 |
2005 | | 56.3 | 61.3 | 87.1 | 70.5 | 62.7 |
Note :
Ratio includes the impact of the conversion of two non-banking entities into banking
entities.
Source :
Base data are taken from Annual Accounts
of Scheduled Commercial Banks 1979 to 2004 and Statistical Tables Relating to
Banks in India 2004-05. | was high at 70.5 per cent in
2005. With respect to State Bank Group and nationalised bank group, the C-D ratios
were lower at 56.3 per cent and 61.3 per cent, respectively, which were less than
the C-D ratio of all scheduled commercial banks at 62.7 per cent in 2005. There
has been a significant increase in the C-D ratios in 2005 across all the bank
groups. (Table 2 and Chart 1).
II.2 Per Office
Deposits and Credit
The overall business of foreign banks per
office is higher than the per office business of other bank groups. Across the
board, the 
per
office deposits are more than the per office credit as expected. With respect
to all scheduled commercial banks, deposits per office increased from Rs.1.4 crore
in 1980 to Rs. 33 crore in 2005 and credit per office also increased from Rs.
0.9 crore to Rs. 20.7 crore during the same period (Table 3). II.3
Type-wise Deposits
Over the years, there has been a shift in
the composition of deposits. While the savings bank deposits of all scheduled
commercial banks remained more or less constant at around one fourth of the total
deposits, term deposits increased from 55.1 per cent in 1980 to 63.0
per cent in 2005. On the other hand, demand deposits fell from 19.7 per cent in
1980 to 12.8 per cent in 2005. More or less similar trend is observed for both
State Bank Group and also for the nationalised bank group. In the case of
foreign banks and domestic private sector bank groups, the pattern in the composition
of deposits differs from that of the public sector banks. In the case of foreign
banks, demand deposits, which formed 25.7 per cent in 1980, increased to 30.1
per cent in 2005. The share of savings bank deposits in total deposits of foreign
banks, decreased from 21.5 per cent in 1980 to 9.9 per cent in 2000. This share
was 17.9 per cent in 2005. The analysis shows that more funds of short-term nature
are parked with the foreign banks group. This may be an indication that the business
class is attracted towards better
Table
3: Per Office deposits and credit of Scheduled Commercial Banks |
(Rs.
crore) | Year
| SBI
& its
Associates | Nationalised
Banks | Foreign
Banks | Domestic
Private
Sector Banks | All
Scheduled
Commercial Banks |
| Deposits | Credit | Deposits | Credit | Deposits | Credit | Deposits | Credit | Deposits | Credit |
1980 | 1.5 | 1.1 | 1.5 | 0.9 | - | - | 0.6 | 0.3 | 1.4 | 0.9 |
1985 | 2.8 | 1.8 | 2.5 | 1.5 | - | - | 1.0 | 0.5 | 2.5 | 1.5 |
1990 | 4.7 | 3.5 | 4.3 | 2.4 | 60.3 | 37.6 | 2.0 | 1.1 | 4.4 | 2.7 |
1995 | 8.7 | 5.0 | 7.4 | 3.6 | 178.5 | 97.0 | 6.9 | 3.8 | 8.3 | 4.2 |
2000 | 18.9 | 9.5 | 14.2 | 6.6 | 208.1 | 150.3 | 20.9 | 10.3 | 16.9 | 8.3 |
2005 | 36.4 | 20.5 | 26.5 | 16.2 | 353.1 | 307.4 | 49.5 | 34.9 | 33.0 | 20.7 |
Source
:
Base data are taken from Annual Accounts of Scheduled Commercial
Banks 1979 to 2004 and Statistical Tables Relating to Banks in India 2004-05. |
service offered by foreign banks. In the case of domestic
private sector bank group, while the composition of demand deposits did not vary
much over the 25-year period, the share of savings deposits fell from 26.8 per
cent in 1980 to 16.0 percent in 2005, whereas term deposits increased from 56.7
per cent to 69.5 per cent over the same period. Even though bank deposit
rates are low, people prefer to park major portion of their funds in the form
of term deposits because of the risk free returns and assured returns it provides.
We can infer that the interest rate structure has definitely influenced the maturity
structure of bank deposits. For example, since the year 2000, the share of term
deposits to total deposits declined across bank groups except for State Bank group.
The deposit rates of 1 to 3 yrs maturity show that there is a clear fall in the
rates since 2000. This could be the major reason for decline in term deposits
after 2000 (Table 4 and Chart 2).
Table
4: Bank Group-wise Deposits of Scheduled
Commercial Banks:
Type-wise | (Per
cent) | Year
| SBI
& its Associates | Nationalised
Banks | Foreign
Banks | Demand
Deposits | Savings
Bank Deposits | Term
Deposits | Demand
Deposits | Savings
Bank Deposits | Term
Deposits | Demand
Deposits | Savings
Bank Deposits | Term
Deposits | 1980 | | 24.6 | 23.3 | 52.1 | 17.6 | 26.1 | 56.3 | 25.7 | 21.5 | 52.8 |
1985 | | 24.7 | 23.4 | 52.0 | 16.5 | 24.9 | 58.6 | 33.7 | 16.9 | 49.4 |
1990 | | 26.7 | 22.9 | 50.4 | 16.7 | 22.2 | 61.1 | 26.9 | 9.3 | 63.8 |
1995 | | 22.5 | 22.5 | 55.0 | 15.8 | 23.5 | 60.7 | 15.5 | 8.3 | 76.2 |
2000 | | 17.7 | 21.5 | 60.7 | 11.9 | 24.1 | 64.0 | 21.6 | 9.9 | 68.5 |
2005 | | 14.1 | 25.0 | 60.9 | 9.9 | 27.2 | 63.0 | 30.1 | 17.9 | 51.9 |
Year
| Domestic
Private
Sector Banks | All
Scheduled
Commercial Banks | |
Demand
Deposits | Savings
Bank
Deposits | Term
Deposits | Demand
Deposits | Savings
Bank
Deposits | Term
Deposits | 1980 | | 16.5 | 26.8 | 56.7 | 19.7 | 25.2 | 55.1 |
1985 | | 16.9 | 27.3 | 55.8 | 19.4 | 24.3 | 56.2 |
1990 | | 16.9 | 25.1 | 58.0 | 19.9 | 22.0 | 58.1 |
1995 | | 16.0 | 15.0 | 69.0 | 17.6 | 21.6 | 60.8 |
2000 | | 14.3 | 11.0 | 74.7 | 14.4 | 20.9 | 64.7 |
2005 | | 14.4 | 16.0 | 69.5 | 12.8 | 24.2 | 63.0 |
Source
: Base data are taken from Annual Accounts of Scheduled
Commercial Banks 1979 to 2004 and Statistical Tables Relating
to Banks in India 2004-05. | 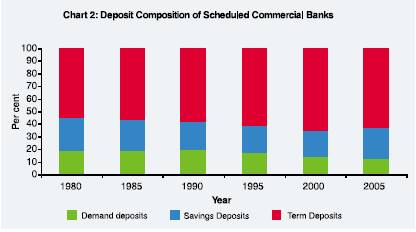
II.4 Bank Group-wise Share in Deposits
The bank group-wise
share in deposits of scheduled commercial banks depicts that nationalised bank
group contributed more than 50 per cent in the total deposits mobilised by all
scheduled commercial banks in the year 2005. This share dropped from 64.4 per
cent in 1980 to 50.7 per cent in 2005. The share of deposits of State Bank group
remained more or less constant during the 25-year period constituting a little
more than one fourth of the total deposits by all scheduled commercial banks.
State Bank group is successful in holding on to its percentage share of deposits
in total deposits of all scheduled commercial banks. However, nationalised bank
group is seen to be slipping in this area. The share of foreign bank group in
total deposits is showing increasing trend. The share of foreign banks increased
from 2.9 per cent to 4.7 per cent and in the case of domestic private sector banks,
it increased from 5.3 per cent in 1980 to 17.0 per cent in 2005. This shows that
banks in the private sector have taken a head start in the deposit mobilisation
after the liberalisation measures adopted with regard to entry of new private
sector banks in 1995 (Table 5).
II.5 Security-wise Advances
The advances secured by tangible assets in the case of all scheduled commercial
banks increased from 73.2 per cent in 1992 to
Table
5: Bank Group-wise Share of Deposits of
Scheduled Commercial
Banks to Total | (Per
cent) | Year | SBI
& its | Nationalised | Foreign | Domestic
Private | | Associates | Banks | Banks | Sector
Banks | 1980 | 27.4 | 64.4 | 2.9 | 5.3 |
1985 | 29.3 | 63.2 | 2.9 | 4.6 |
1990 | 28.1 | 63.6 | 4.4 | 3.9 |
1995 | 27.8 | 58.2 | 6.9 | 7.2 |
2000 | 28.5 | 53.4 | 5.5 | 12.6 |
2005 | 27.6 | 50.7 | 4.7 | 17.0 |
Source
: Base data are taken from Annual Accounts of Scheduled Commercial Banks
1979 to 2004 and Statistical Tables Relating to Banks in India
2004-05. | 76.4 percent in 2005. For all
the bank groups, with the exception of foreign bank group, advances secured by
tangible assets were more than 70 per cent for the period 1992 to 2005.
In the case of foreign banks, such secured loans increased from 54 per cent in
1992 to 57.9 per cent in 2005. Advances covered by government / bank guarantees
with respect to all scheduled commercial banks decreased from 15.1 per cent to
5.9 per cent during the same period. Such type of advances declined for each of
the bank groups. It is interesting to note here that unsecured loans granted by
foreign banks group was more than a third of the total advances for all the years
from 1992 to 2005. For all other bank groups, unsecured loans were less than 21
per cent. It is also noteworthy that unsecured advances granted by State Bank
of India and its Associates increased sharply from 15.4 per cent in 2004 to 20.9
percent in 2005 (Table 6 and Chart 3). II.6 Bank Group-wise Share
in Advances
The bank group-wise share of advances of scheduled
commercial banks depicts that nationalised bank group contributed
about 50 per cent of the total credit advanced by all scheduled commercial banks
followed by State Bank Group with a share of about 25 per cent, domestic private
sector banks with a share of 19 per cent and foreign banks about 7 per cent
in the year 2005. This indicates that banks in the public sector even after the
implementation of reforms since 1991, contribute about 75 per cent of the total
credit advanced by all scheduled commercial banks.
Table
6: Security-wise Advances of Scheduled Commercial Banks |
(Per
cent) | | | SBI
& its Associates | Nationalised
Banks | Foreign
Banks | Year | | Secured
by
tangible
assets | Covered
by Bank/
Govt.
Guara-
ntees | Un-
secured | Secured
by
tangible
assets | Covered
by Bank/
Govt.
Guara-
ntees | Un-
secured | Secured
by
tangible
assets | Covered
by Bank/
Govt.
Guara-
ntees | Un-
secured | | |
| |
| |
| |
1992 | | 70.8 | 24.7 | 4.5 | 76.4 | 10.0 | 13.6 | 54.0 | 13.9 | 32.1 |
1995 | | 78.3 | 18.0 | 3.7 | 76.0 | 14.3 | 9.7 | 67.2 | 5.9 | 26.8 |
2000 | | 86.0 | 8.3 | 5.8 | 81.6 | 8.7 | 9.7 | 56.1 | 8.1 | 35.9 |
2001 | | 81.0 | 7.6 | 11.4 | 80.0 | 8.5 | 11.5 | 51.9 | 9.3 | 38.8 |
2002 | | 81.4 | 6.3 | 12.3 | 77.2 | 9.9 | 12.9 | 53.1 | 12.0 | 34.9 |
2003 | | 80.4 | 7.2 | 12.4 | 79.9 | 7.2 | 12.9 | 56.2 | 11.3 | 32.6 |
2004 | | 77.3 | 7.4 | 15.4 | 80.1 | 6.5 | 13.3 | 58.7 | 7.3 | 34.0 |
2005 | | 74.7 | 4.4 | 20.9 | 77.6 | 7.2 | 15.1 | 57.9 | 5.6 | 36.4 |
| | Domestic
Private
Sector Banks | All
Scheduled
Commercial Banks | |
| |
Year
| Secured
by
tangible
assets | Covered
by Bank/
Govt.
Guara-
ntees | Un-
secured | Secured
by
tangible
assets | Covered
by Bank/
Govt.
Guara-
ntees | Un-
secured | 1992 | | 76.2 | 8.7 | 15.1 | 73.2 | 15.1 | 11.7 |
1995 | | 87.0 | 6.4 | 6.6 | 77.2 | 14.0 | 8.8 |
2000 | | 76.7 | 11.9 | 11.4 | 80.2 | 8.9 | 10.9 |
2001 | | 77.6 | 8.3 | 14.1 | 77.7 | 8.3 | 14.1 |
2002 | | 85.9 | 5.8 | 8.3 | 78.0 | 8.4 | 13.6 |
2003 | | 85.5 | 6.4 | 8.1 | 79.4 | 7.4 | 13.3 |
2004 | | 85.1 | 5.1 | 9.7 | 78.9 | 6.5 | 14.6 |
2005 | | 81.7 | 4.4 | 14.0 | 76.4 | 5.9 | 17.7 |
Source
: Base data are taken from Annual Accounts of Scheduled Commercial Banks
1979 to 2004 and Statistical Tables Relating to Banks in India
2004-05. | This trend may not continue
in future as the data reveals that the share of the public sector banks declined
from 92.1 per cent in 1980 to 74.3 per cent in 2005. On the other hand,
the advances made by foreign banks increased from 3.3 per cent in 1980 to 6.5
per cent in 2005 and that made by private banks in the domestic sector increased
from 4.5 per cent in 1980 to 19.2 per cent in 2005. Data supports that in the
post reform period, public sector banks 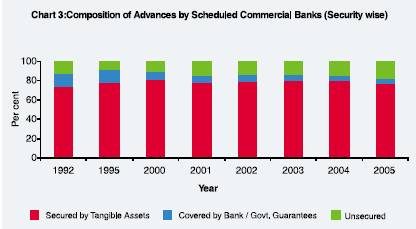
are facing increasing competition from the private sector
banks-both foreign and domestic (Table 7).
II.7 Priority
Sector Advances
Priority sector advances of scheduled commercial
banks showed some marginal decline from 35 per cent in 1992 to 34 per cent in
2005. This declining trend is observed in the case of all bank groups except for
foreign banks. In the case of foreign banks, priority sector advances increased
over the years since the banking sector reforms started. Of the total advances,
nationalised banks advanced loans to priority sectors to the extent of 37.4 per
cent and State Bank group to the extent of 35.3 per cent in 2005. Such loans
were low
Table
7: Bank Group-wise Share of Advances of Scheduled
Commercial
Banks to Total | (Per
cent) | Year | SBI
& its
Associates | Nationalised
Banks | Foreign
Banks | Domestic
Private
Sector Banks |
1980 | 32.2 | 59.9 | 3.3 | 4.5 |
1985 | 31.1 | 61.2 | 3.5 | 4.2 |
1990 | 33.7 | 58.4 | 4.5 | 3.4 |
1995 | 30.8 | 54.3 | 7.3 | 7.6 |
2000 | 29.1 | 50.3 | 8.0 | 12.6 |
2005 | 24.8 | 49.5 | 6.5 | 19.2 |
Source:
Base data are taken from Annual Accounts of Scheduled Commercial Banks
1979 to 2004 and Statistical Tables Relating to Banks in India 2004-05. |
Table
8: Percentage of Priority Sector Advances to Total Advances:
Bank
Group-wise | (Per
cent) | Year
| SBI &
its
Associates | Nationalised
Banks | Foreign
Banks | Domestic
Private
Sector Banks | All
Scheduled
Commercial
Banks |
1992 | 36.0 | 38.4 | 7.9 | 28.9 | 35.0 |
1995 | 31.1 | 33.6 | 20.7 | 27.0 | 31.3 |
2000 | 32.3 | 34.1 | 21.4 | 26.6 | 31.5 |
2001 | 32.2 | 333.9 | 21.1 | 24.5 | 31.0 |
2002 | 31.4 | 34.1 | 21.6 | 16.9 | 29.2 |
2003 | 31.2 | 36.2 | 21.9 | 22.2 | 31.1 |
2004 | 33.2 | 38.6 | 23.2 | 26.9 | 33.7 |
2005 | 35.3 | 37.4 | 25.8 | 26.5 | 34.0 |
Source
: Base data are taken from Annual Accounts of Scheduled Commercial Banks
1979 to 2004 and Statistical Tables Relating to Banks in India
2004-05. | with respect to domestic
private sector banks group at 26.5 per cent and foreign banks at 25.8 per cent.
A target of 40 per cent of net bank credit has been stipulated for lending to
the priority sector by domestic scheduled commercial banks both in the public
and private sectors and a target of 32 per cent has been stipulated for lending
to the priority sector by foreign bank groups at present. However, the data presented
in this section are percentages of priority sector lending to gross bank credit
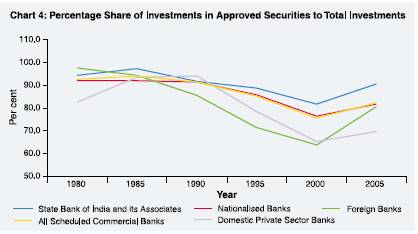
(Table 8). Section III Investments
Bank group-wise
investments show that all scheduled commercial banks invested 92.6 per cent of
their total investments in government and other approved securities in the year
1980, which declined to 82.4 per cent in 2005; whereas other investments increased
from 7.4 per cent to 17.6 per cent during the same period. This could be due to
the reduction in SLR requirements. Even though the SLR requirements have been
reduced from a high of 38.5 per cent in 1992 to the statutory minimum of 25 per
cent, banks still prefer to invest large portion of their investments in approved
securities, because of the risk-free and assured returns they get through such
investments. In the case of public sector banks and foreign banks, there was a
reduction in investment in government securities and a preference for other investments
like shares, bonds and debentures, which are not counted for SLR requirements.
However, in 2005, a major reduction was noticed with respect to investments in
other securities and a clear preference for government and other approved securities.
As against this, in the case of domestic private sector banks, there is a clear
preference for investments in other securities after the year 1995 and a reduction
of investments in government and other approved securities. Since the year 2000,
with the entry of more private sector banks, this group invested more than one
third of their total investments in non-SLR securities, which indicates that the
private banks of late are currently venturing into more riskier, nonetheless challenging
business (Table 9 and Chart 4).
Table
9: Bank Group-wise Distribution of Investments
of Scheduled
Commercial Banks | (Per
cent) | Year
| SBI
& its Associates | Nationalised
Banks | Foreign
Banks | Govt.
&
Other
Appr.
Securities | Other
Invest-
ments | Govt.
&
Other
Appr.
Securities | Other
Invest-
ments | Govt.
&
Other
Appr.
Securities | Other
Invest-
ments |
1980 | 94.5 | 5.5 | 92.2 | 7.8 | 97.7 | 2.0 |
1985 | 97.3 | 2.7 | 92.2 | 7.8 | 94.5 | 5.5 |
1990 | 91.9 | 8.1 | 91.6 | 8.4 | 85.5 | 14.5 |
1995 | 88.7 | 11.3 | 85.8 | 14.2 | 71.4 | 28.6 |
2000 | 81.8 | 18.2 | 76.4 | 23.6 | 63.8 | 36.2 |
2005 | 90.5 | 9.5 | 81.7 | 18.3 | 80.5 | 19.5 |
Year
| Domestic
Private
Sector Banks | All
Scheduled
Commercial Banks | |
Govt.
&Other
Appr. Securities | Other
Investments | Govt. &Other
Appr.Securities | Other
Investments | 1980 | 82.6 | 17.2 | 92.6 | 7.4 |
1985 | 93.6 | 6.3 | 94.0 | 6.0 |
1990 | 94.1 | 5.9 | 91.5 | 8.5 |
1995 | 78.5 | 21.5 | 85.2 | 14.8 |
2000 | 65.2 | 34.8 | 75.7 | 24.3 |
2005 | 69.8 | 30.2 | 82.4 | 17.6 |
Source
: Base data are taken from Annual Accounts of Scheduled Commercial Banks
1979 to 2004 and Statistical Tables Relating to Banks in India
2004-05. |
Section IV
Capital
To Risk-weighted Assets Ratio (CRAR)
The capital
to risk weighted assets ratio (CRAR) is an indicator for assessing soundness and
solvency of banks. Out of 92 scheduled commercial banks, 75 banks could maintain
the CRAR of more than 8 per cent during the year 1995-96, when the prescribed
CRAR was 8 per cent. During 1999-2000, 96 banks maintained CRAR of 9 to 10 per
cent and above when the prescribed rate was 9 per cent. In 2004-05, out of 88
scheduled commercial banks, 78 banks could maintain CRAR of above 10 per cent
and 8 banks between 9 and 10 per cent. All banks in the State Bank group maintained
capital to risk weighted assets ratio of more than 10 per cent in 2004-05. In
the nationalised bank group, 17 banks reached more than 10 per cent CRAR level
except two banks whose CRAR during 2004-05 was between 9-10 per cent. During 2004-05,
there were 2 banks in the old private sector categorywhose CRAR was less than
9 per cent (Table 10). Section V
Non-performing Assets (NPAs) The measure of non-performing
assets helps us to assess the efficiency in allocation of resources made by banks
to productive
Table
10: Distribution of Scheduled Commercial Banks by CRAR |
Year | Bank
Group | State
Bank
Group | Nation-
alised
Bank
Sector
Banks | Old
Private
Sector
Banks | New
Private | Foreign
Banks
in
India
| Scheduled
Commer-
cial
Banks |
1995-1996 | Below
4 per cent | - | 5 | 3 | - | - | 8 |
| Between
4-8 per cent | - | 3 | 3 | - | 3 | 9 |
| Between
8-10 per cent | 6 | 7 | 7 | 1 | 12 | 33 |
| Above
10 per cent | 2 | 4 | 12 | 8 | 16 | 42 |
1999-2000 | Below
4 per cent | - | 1 | 2 | - | - | 3 |
| Between
4-9 per cent | - | - | 2 | - | - | 2 |
| Between
9-10 per cent | - | 4 | 2 | 1 | 5 | 12 |
| Above
10 per cent | 8 | 14 | 18 | 7 | 37 | 84 |
2003-2004 | Below
4 per cent | - | - | - | 1 | - | 1 |
| Between
4-9 per cent | - | - | - | 1 | - | 1 |
| Between
9-10 per cent | - | 1 | - | - | - | 1 |
| Above
10 per cent | 8 | 18 | 20 | 8 | 33 | 87 |
2004-05 | Below
4 per cent | - | - | 1 | - | - | 1 |
| Between
4-9 per cent | - | - | 1 | - | - | 1 |
| Between
9-10 per cent | - | 2 | 3 | 2 | 1 | 8 |
| Above
10 per cent | 8 | 17 | 15 | 7 | 30 | 78 |
Source:
Handbook of Statistics on the Indian Economy, 2004-05 & Report on
Trend and Progress of Banking in India 2004-05. | sectors.
The problem of NPAs arise either due to bad management by banks or due to external
factors like unanticipated shocks, business cycle and natural calamities (Caprio
and Klingebiel, 1996). Several studies have underscored the role of banks’
lending policy and terms of credit, which include cost, maturity and collateral
in influencing the movement of non-performing assets of banks (Reddy, 2004, Mohan
2003, 2004).
The ratio of gross non-performing assets (NPAs) to gross
advances of all scheduled commercial banks decreased from 14.4 per cent in 1998
to 5.1 per cent in 2005. Bank group-wise analysis shows that across the bank groups
there has been a significant reduction in the gross non-performing assets. With
respect to public sector banks (State Bank group and nationalised bank group together),
NPAs have decreased from 16.0 per cent in 1998 to 5.4 per cent in 2005.
In the case of foreign banks group, gross NPAs as a percentage to gross advances,
which was the lowest among all the groups at 6.4 per cent in 1998, decreased to
2.9 per cent in 2005. With regard to domestic private sector banks group,
gross NPAs decreased from 8.7 per cent to 3.9 per cent during the same period.
The ratio of net NPAs to net advances of different bank groups also exhibited
similar declining trends during the period from 1998 to 2005. The net NPAs of
all scheduled commercial banks declined from 7.3 per cent in 1998 to 2.0 per cent
in 2005 (Table 11). The decline in NPAs is more evidenced across bank groups
especially since 2003. This reflects on the positive impact of the measures taken
by the Reserve Bank towards NPA reduction and specifically due to the enactment
of the Securitisation and Reconstruction of Financial Assets and Enforcement of
Security Interest (SARFAESI) Act, ensuring speedier recovery without intervention
of courts or tribunal.
The composition of NPAs of public sector banks
brings to light certain interesting aspects. It is observed that in 1995 for State
Bank group, the share of NPAs was 52.5 per cent for the priority sector, 41.4
per cent for the non-priority sector, and 6.1 per cent for the public sector.
These percentages were 47.4 per cent, 51.5 per cent and 1.1 per cent, respectively
in 2005. Similarly in the case of nationalised banks also, the NPA composition
for non-priority sector
Table
11: NPAs of Scheduled Commercial Banks (Bank Group-wise) |
(Per
cent) | Year | Public
| Foreign
| Domestic
Private | All
SCBs | | Sector
Banks | Banks | | Sector
Banks | | Gross | Net | Gross | Net | Gross | Net | Gross | Net |
| NPA | NPA | NPA | NPA | NPA | NPA | NPA | NPA |
1998 | 16.0 | 8.2 | 6.4 | 2.2 | 8.7 | 5.3 | 14.4 | 7.3 |
2000 | 14.0 | 7.4 | 7.0 | 2.4 | 8.2 | 5.4 | 12.7 | 6.8 |
2001 | 12.4 | 6.7 | 6.8 | 1.8 | 8.4 | 5.4 | 11.4 | 6.2 |
2002 | 11.1 | 5.8 | 5.4 | 1.9 | 9.6 | 5.7 | 10.4 | 5.5 |
2003 | 9.4 | 4.5 | 5.3 | 1.8 | 8.1 | 5.0 | 8.8 | 4.4 |
2004 | 7.8 | 3.0 | 4.6 | 1.5 | 5.8 | 2.8 | 7.2 | 2.9 |
2005 | 5.4 | 2.1 | 2.9 | 0.9 | 3.9 | 2.2 | 5.1 | 2.0 |
Source
:Handbook of Statistics on Indian Economy 2004-05 and Report on Trend
and Progress of Banking in India 2004-05. |
Table
11A: Composition of NPAs of Public Sector Banks |
(Per cent) |
Year | SBI
& its Associates | Nationalised
Banks | Priority | Non-priority | Public | Priority | Non-priority | Public |
Sector | Sector | Sector | Sector | Sector | Sector |
1995 | 52.5 | 41.4 | 6.1 | 48.7 | 49.2 | 2.0 |
2000 | 45.2 | 51.9 | 2.8 | 44.1 | 54.5 | 1.5 |
2001 | 44.2 | 49.8 | 6.0 | 46.2 | 52.3 | 1.5 |
2002 | 47.0 | 50.4 | 2.6 | 45.7 | 53.1 | 1.2 |
2003 | 47.5 | 49.4 | 3.1 | 47.1 | 51.3 | 1.6 |
2004 | 47.1 | 51.5 | 1.5 | 47.7 | 51.1 | 1.1 |
2005 | 47.4 | 51.5 | 1.1 | 48.4 | 50.7 | 0.9 |
Source:
Statistical Tables Relating to Banks in India, Various issues. | has
increased, whereas, that for priority sector and public sector, there is a marginal
reduction. This shows that not only advances to the priority sector are going
non-performing, but more than that, non-priority sector lending is the area where
the bankers need to cautiously examine the possibilities of loans becoming non-performing.
Here the question of moral hazard, adverse selection and credit rationing comes
to the fore. These issues are to be addressed face on. This also goes to explode
the commonly held myth that the problem of NPAs is caused mainly due to the credit
allocation to priority sectors. (Table 11 A).
Section
VI Income Composition Income
composition of scheduled commercial banks shows that across the different bank
groups, interest income viz., income from advances and investments are falling
and the percentage of other income is increasing. Other income inter alia
includes income earned in the form of commission, exchange and brokerage and income
from profit on sale of investments. In 1980, the share of interest income of all
scheduled commercial banks was 89.0 per cent, which decreased to 82.0 per cent
in 2005. Other income on the other hand, increased from 11.0 per cent to 18.0
per cent during the same period. This reflects upon the increasing reliance on
non-interest income vis-à-vis interest income of commercial banks.
This is a welcome trend as it may reduce the risks arising out of the sole dependency
on interest as the source of income (Ramasastri, Samuel & Gangadaran, 2004)
Bank group-wise interest and non-interest income shows that in the case of SBI
and its Associates, interest income declined from 84.5 per cent in 1980 to 82.3
percent in 2005 and in the case of nationalised banks group, the same declined
from 91.4 per cent to 84.0 per cent. In the case of domestic private sector banks
also, interest income declined from 90.3 per cent in 1990 to 80.5 per cent in
2005. It is evident from these figures that more than 80 per cent of the income
still comes from interest income in the case of public sector banks and domestic
private sector banks, which indicates that these banks are seen to be dependent
mainly on the traditional way of earning income even though there is a reduction
in such dependence. In contrast, foreign banks are seen to be increasingly dependent
upon non-interest sources of income. Non-interest income of foreign banks formed
about 29.6 per cent of their total income, followed by domestic private sector
banks 19.5 per cent, State Bank of India and its Associates 17.7 percent and nationalised
banks 16.0 per cent (Table 12 and Chart 5). A comparison
of the break-up of interest income viz., interest on advances and interest on
investments shows that with respect to all scheduled commercial banks, interest
income on advances has fallen
| Table
12: Income Composition of Scheduled Commercial Banks | |
(Per cent) | |
Year |
SBI & its |
Nationalised |
Foreign |
Domestic Private |
All Scheduled |
| Associates |
Banks |
Banks |
Sector Banks |
Commercial Banks |
| Interest |
Other |
Interest |
Other |
Interest |
Other |
Interest |
Other |
Interest |
Other | |
Income |
Income |
Income |
Income |
Income |
Income |
Income |
Income |
Income |
Income | |
1980 |
84.5 |
15.5 |
91.4 |
8.6 |
- |
- |
- |
- |
89.0 |
11.0 | |
1985 |
88.2 |
11.8 |
93.6 |
6.4 |
- |
- |
- |
- |
91.8 |
8.2 | |
1990 |
89.1 |
10.9 |
91.9 |
8.1 |
82.8 |
17.2 |
90.3 |
9.7 |
90.3 |
9.7 | |
1995 |
86.9 |
13.1 |
88.8 |
11.2 |
80.1 |
19.9 |
86.0 |
14.0 |
87.2 |
12.8 | |
2000 |
85.8 |
14.2 |
88.4 |
11.6 |
79.2 |
20.8 |
83.9 |
16.1 |
86.2 |
13.8 | |
2005 |
82.3 |
17.7 |
84.0 |
16.0 |
70.4 |
29.6 |
80.5 |
19.5 |
82.0 |
18.0 | |
‘_’ : Not Available.
Source :
Base
data are taken from Annual Accounts of Scheduled Commercial Banks 1979 to 2004
and
Statistical Tables Relating to Banks in India 2004-05. |
from 60.7 per cent in
1992 to 52.3 per cent in 2005. Whereas, interest income on investments increased
from 25.6 per cent in 1992 to 42.2 per cent in 2005. This is true for all the
bank groups (Table 12 A) .
| Table
12A: Composition of Interest Income of Scheduled Commercial Banks |
| (Per
cent) | | |
SBI & its Associates |
Nationalised Banks |
Foreign Banks | |
| Year |
Interest |
Interest |
Others |
Interest |
Interest Others |
Interest |
Interest Others |
| | on |
on | |
on |
on | |
on |
on | |
| | Advances |
Investments | |
Advances |
Investments | |
Advances |
Investments | |
| 1992 |
60.8 |
22.5 |
16.7 |
60.9 |
28.0 |
11.1 |
61.1 |
21.5 |
17.4 | |
1995 | 47.4 |
44.1 |
8.5 |
49.6 |
42.1 |
8.3 |
52.8 |
41.5 |
5.7 | |
2000 | 44.3 |
43.4 |
12.3 |
48.3 |
45.9 |
5.7 |
52.1 |
40.3 |
7.5 | |
2001 | 44.2 |
43.7 |
12.2 |
49.1 |
45.0 |
5.9 |
54.4 |
38.1 |
7.5 | |
2002 | 39.5 |
47.7 |
12.8 |
49.4 |
44.9 |
5.7 |
55.0 |
37.8 |
7.2 | |
2003 | 39.1 |
48.7 |
12.1 |
50.1 |
45.4 |
4.6 |
60.1 |
35.0 |
4.9 | |
2004 | 39.7 |
51.0 |
9.3 |
49.1 |
47.1 |
3.8 |
56.1 |
37.9 |
6.0 | |
2005 | 43.0 |
48.4 |
8.6 |
52.8 |
43.3 |
3.9 |
60.4 |
32.1 |
7.5 | | |
Domestic Private |
All Scheduled | |
| |
Sector Banks |
Commercial Banks |
| Year |
Interest |
Interest |
Others |
Interest |
Interest |
Others | | |
on |
on | |
on |
on | |
| | Advances |
Investments | |
Advances |
Investments | |
| 1992 |
56.7 |
27.6 |
15.6 |
60.7 |
25.6 |
13.7 | |
1995 | 56.9 |
36.0 |
7.2 |
49.7 |
42.3 |
8.1 | |
2000 | 50.8 |
42.1 |
7.1 |
47.8 |
44.3 |
8.0 | |
2001 | 49.9 |
43.5 |
6.6 |
48.2 |
43.9 |
8.0 | |
2002 | 48.8 |
44.6 |
6.6 |
46.7 |
45.2 |
8.1 | |
2003 | 57.0 |
37.8 |
5.3 |
48.7 |
44.4 |
6.9 | |
2004 | 59.0 |
36.1 |
4.9 |
48.6 |
45.7 |
5.7 | |
2005 | 63.5 |
32.1 |
4.5 |
52.3 |
42.2 |
5.5 | |
Note:
‘Others’
include interest on balances with RBI and other inter-bank funds and others.
Source: Base data are taken from Annual Accounts of Scheduled Commercial
Banks 1979 to 2004 and Statistical Tables Relating to Banks in India 2004-05. |
Section VII Expenditure
Composition The expenditure composition of scheduled
commercial banks indicates that the percentage of interest expenses to total expenses
of all scheduled commercial banks declined by 2.1 per cent from 66.3 per cent
in 1980 to 64.2 per cent in 2005. Percentage of operating expenses to total expenses
has increased from 33.7 per cent in 1980 to 35.8 per cent in 2005. In the case
of all bank groups, similar trend is noticed except for foreign banks where the
interest expenses has decreased from 64.6 per cent in 1990 to 47.9 per cent in
2005. Whereas, percentage of operating expenses to the total expenses of foreign
banks increased from 35.4 per cent to 52.1 per cent (Table 13 & Chart 6). A
further break-up of operating expenses reveals that wages, as percentage of operating
expenses of public sector banks is more than 60 per cent. These are symptoms of
under employment. This situation calls for more apt and pragmatic human resource
policies and proper man power planning for the future. The wages of foreign banks
increased from 25.9 per cent in 1990 to 30.6 per cent of their
| Table
13: Expenditure Composition of Scheduled Commercial Banks |
| (Per
cent) | | |
SBI & its |
Nationalised |
Foreign |
Domestic Private |
All Scheduled |
| Year |
Associates |
Banks |
Banks |
Sector Banks |
Commercial Banks |
| | Interest |
Operating |
Interest |
Operating |
Interest |
Operating |
Interest |
Operating |
Interest |
Operating |
| | expenses |
expenses |
expenses |
expenses |
expenses |
expenses |
expenses |
expenses |
expenses |
expenses | | |
to total |
to total |
to total |
to total |
to total |
to total |
to total |
to total |
to total |
to total | |
1980 | 64.3 |
35.7 |
67.4 |
32.6 |
- |
- |
- |
- |
66.3 |
33.7 | |
1985 | 64.8 |
35.1 |
68.6 |
31.4 |
- |
- |
- |
- |
67.3 |
32.6 | |
1990 | 69.0 |
31.0 |
71.4 |
28.6 |
64.6 |
35.4 |
62.8 |
37.2 |
69.9 |
30.1 | |
1995 | 65.5 |
34.5 |
67.6 |
32.4 |
67.4 |
32.6 |
70.9 |
29.1 |
67.1 |
32.9 | |
2000 | 70.6 |
29.4 |
71.4 |
28.6 |
65.8 |
34.2 |
78.0 |
22.0 |
71.5 |
28.5 | |
2005 | 64.9 |
35.1 |
65.5 |
34.5 |
47.9 |
52.1 |
65.3 |
34.7 |
64.2 |
35.8 | |
- = Not Available.
Source : Base data
are taken from Annual Accounts of Scheduled Commercial Banks 1979 to 2004 and
Statistical Tables Relating to Banks in India 2004-05. | 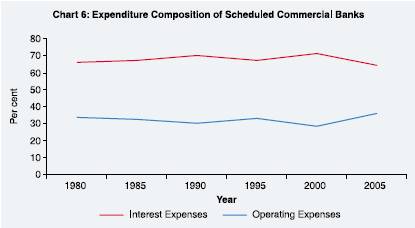
operating expenses in 2005. In the case of domestic private sector banks group,
wages as percentage of operating expenses was 73.5 per cent in 1990 and the same
decreased drastically to 33.7 per cent. This goes to indicate that banks in the
private sector both foreign and domestic are spending for other business boosting
measures like image building, software development etc. (Table 13 A and Chart
6 A).
Table
13A:Wages as Percentage of Operating Expenses*
of Scheduled
Commercial Banks | (Per
cent) | Year
| SBI &
its
Associates | Nationalised
Banks | Foreign
Banks | Domestic
Private
Sector Banks | All
Scheduled
Commercial Banks |
1980 | 74.1 | 72.1 | - | - | 72.9 |
1985 | 72.5 | 71.3 | - | - | 71.7 |
1990 | 67.8 | 68.9 | 25.9 | 73.5 | 65.7 |
1995 | 72.4 | 67.1 | 32.8 | 62.9 | 66.1 |
2000 | 71.6 | 73.6 | 33.3 | 49.1 | 67.0 |
2005 | 67.4 | 67.4 | 30.6 | 33.7 | 58.3 |
- = Not Available.
* Wages are calculated as percentage of payments to and provisions for employees
to total expenses.
Source : Base data are taken from Annual
Accounts of Scheduled Commercial Banks 1979 to 2004 and Statistical Tables Relating
to Banks in India 2004-05. | 
Section
VIII Return on Assets Return
on assets (ROA) is an important performance indicator of banks. Return on assets
has been worked out by taking the ratio of net profit or loss to average advances
and investments. For all scheduled commercial banks, the ROA increased from 0.1
per cent in 1980 to 1.1 per cent in 2005. Amongst the bank groups, the ROA of
foreign banks group is the highest at 1.8 per cent in 2005. All other bank groups
recorded a return on assets of 1.1 per cent showing that all banks are making
profits and their performances are good. Foreign banks group is on a higher plane
with respect to its performance in comparison with other bank groups. Compared
to the pre-reform period, the ROA of public sector banks improved significantly
after the initiation of reforms. In the case of foreign banks and domestic private
sector banks, data are available only from 1995 (Table 14).
The distribution
of scheduled commercial banks by ROA reveals that in 1995, with respect to State
Bank group, all 8 banks were in the ROA range of up to 1 per cent. This position
improved slightly as one bank was in the ROA category of more than 1.5 per cent
in 2000 and 2005. This goes to indicate that State Bank group has much potential
to enhance their performance. Similarly, majority of the banks in the nationalised
group were in the ROA range of less than 1 per cent in
Table
14: Return on Assets (ROAs)* of Scheduled Commercial Banks |
(Per
cent) | Year
| SBI & its
Associates | Nationalised
Banks | Foreign
Banks | Domestic
Private
Sector Banks | All
Scheduled
Commercial Banks |
| 1980 | 0.1 | 0.1 | - | - | 0.1 |
| 1985 | 0.1 | 0.1 | - | - | 0.1 |
| 1990 | 0.2 | 0.2 | - | - | 0.3 |
| 1995 | 0.8 | 0.1 | 2.6 | 1.9 | 0.6 |
| 2000 | 1.2 | 0.6 | 1.7 | 1.3 | 0.9 |
| 2005 | 1.1 | 1.1 | 1.8 | 1.1 | 1.1 |
‘-’ = Not Available.
*
ROAs are calculated as percentage of net profit / loss to average advances
and investments.
Source:
Base data are taken from Annual
Accounts of Scheduled Commercial Banks 1979 to 2004 and Statistical Tables Relating
to Banks in India 2004-05. 1995, which exhibited some improvement since 2000.
In the case of domestic private sector banks also, there seems to be more scope
for improvement as many banks reported negative ROA in 2005. In contrast to all
other bank groups, majority of the foreign banks were placed in the category of
high ROA of more than 1.5 per cent (Table 14 A). |
Table
14 A: Distribution of Scheduled Commercial Banks by ROA |
Year | Range | SBI
& its
Associates | Nationalised
Banks | Foreign
Banks | Domestic
Private
Sector
Banks | All
Scheduled
Commercial
Banks |
1995 | Negative | - | 8 | - | 2 | 10 |
| 0
to 0.1 | 1 | 2 | 4 | 11 | 18 |
| 0.1
to 0.5 | 3 | 2 | 2 | 3 | 10 |
| 0.5
to 1.0 | 4 | 4 | 1 | 3 | 12 |
| 1
to 1.5 | - | 1 | 2 | 4 | 7 |
| >1.5 | - | 2 | 18 | 9 | 29 |
2000 | Negative | - | 1 | 9 | 1 | 11 |
| 0
to 0.1 | - | - | 6 | 2 | 8 |
| 0.1
to 0.5 | - | 8 | 1 | 3 | 12 |
| 0.5
to 1.0 | 3 | 5 | 2 | 7 | 17 |
| 1
to 1.5 | 4 | 3 | 6 | 8 | 21 |
| >1.5 | 1 | 2 | 18 | 11 | 32 |
2005 | Negative | - | 1 | 8 | 10 | 19 |
| 0
to 0.1 | - | - | 1 | 3 | 4 |
| 0.1
to 0.5 | 1 | 2 | - | 2 | 5 |
| 0.5
to 1.0 | 3 | 6 | 2 | 4 | 15 |
| 1
to 1.5 | 3 | 8 | 4 | 4 | 19 |
| >1.5 | 1 | 3 | 16 | 6 | 26 |
Source
:
Base data are taken from Annual Accounts of Scheduled Commercial
Banks 1979 to 2004 and Statistical Tables Relating to Banks in India 2004-05. |
Section IX
Some
Select Ratios The data reveals that the ratio of interest on advances
to average advances of all scheduled commercial banks, which is reflective of
the lending rates, decreased from 14.0 per cent in 1992 to 7.1 percent in 2005.
The prime lending rate was 19.0 per cent in 1992 and in the range of 10.25 to
10.75 per cent in 2005. From this, it is evidenced that banks are lending at the
sub prime lending rates. The gap between the PLR and lending rates of all scheduled
commercial banks was very less for the years 2000 to 2002. However, this gap widened
since 2003. This is true for all the bank groups, which is indicative of the fact
that during the recent years, banks are lending at sub PLR rates with wider gaps
between PLR and lending rates.
The ratio of interest on investments to average
investments, which is reflective of the return on investments, shows that for
all scheduled commercial banks, the rates have declined from 10.1 per cent in
1992 to 7.6 percent in 2005. In comparison, the interest rates on central government
dated securities (weighted average) declined from 11.8 per cent in 1992 to 6.1
per cent in 2005. Overall trends indicate that the return on investments made
by the public sector banks is higher than that of all scheduled commercial banks.
An interesting point to note here is that even though private sector banks invested
more of their funds in non-SLR securities, still their interest on investments
as a percentage to average investments is lower than that obtained by the public
sector banks. Between State Bank group and nationalised bank group, the former
was successful in getting higher yields on their investments than the latter group.
The ratio of interest on deposits to average deposits of scheduled commercial
banks, which is reflective of the deposit rate, declined from 7.5 per cent in
1992 to 4.2 per cent in 2005. These rates are lower than the rates of deposits
with 1 to 3 year maturity for all the bank groups. This indicates that banks are
able to mobilise deposits at a lower rate than that of the rates for deposits
of 1 to 3 years maturity (Table 15 and Chart 7).
Table
15: Some Select Ratios of Scheduled Commercial Banks
(Bank
Group-wise) | Year | Ratio
of Interest on Advances to Average advances | PLR* |
SBI &
its | Nationalised | Foreign | Domestic | All
Sch. | Associates | Banks | Banks | Pvt.
Sector Banks | Comm
Banks. | 1992 | 13.9 | 13.4 | 21.8 | 13.8 | 14.0 | 19.00 |
1995 | 11.1 | 11.5 | 14.7 | 13.0 | 11.7 | 15.00 |
2000 | 10.9 | 11.8 | 13.1 | 12.3 | 11.7 | 12.00-12.50 |
2001 | 10.7 | 11.5 | 13.1 | 11.7 | 11.4 | 11.00-12.00 |
2002 | 9.7 | 10.6 | 11.6 | 8.8 | 10.1 | 11.00-12.00 |
2003 | 9.0 | 9.8 | 10.7 | 10.9 | 9.9 | 10.75-11.50 |
2004 | 7.9 | 8.7 | 9.0 | 9.8 | 8.7 | 10.25-11.00 |
2005 | 6.6 | 7.1 | 7.3 | 7.5 | 7.1 | 10.25-10.75 |
Year | Ratio
of interest on Investments to average Investments | Interest
Rate on Central Govt. | SBI
& its Associates | Nationalised
Banks | Foreign
Banks | Domestic
Pvt. Sector Banks | All
Sch.Comm. Banks | Dated
Securities average) (Weighted | 1992 | 10.1 | 10.1 | 10.1 | 10.6 | 10.1 | 11.78 |
1995 | 12.3 | 11.0 | 11.0 | 12.0 | 11.5 | 11.90 |
2000 | 11.7 | 11.7 | 11.7 | 11.5 | 11.7 | 11.77 |
2001 | 10.7 | 11.4 | 11.4 | 11.2 | 11.1 | 10.95 |
2002 | 10.8 | 11.0 | 11.0 | 9.2 | 10.6 | 9.44 |
2003 | 9.7 | 10.2 | 10.2 | 9.0 | 9.7 | 7.34 |
2004 | 8.9 | 9.2 | 9.2 | 7.6 | 8.8 | 5.71 |
2005 | 8.2 | 7.8 | 6.9 | 6.0 | 7.6 | 6.11 |
Year | Ratio
of interest on deposits to average deposits | Deposit
Rates**(1 to 3 Yrs.) | SBI
& its
Associates | Nationalised
Banks | Foreign
Banks | Domestic
Pvt.
Sector
Banks | All
Sch.
Comm.
Banks |
1992 | 7.9 | 7.5 | 6.9 | 6.8 | 7.5 | 12.00 |
1995 | 7.1 | 6.8 | 5.9 | 6.9 | 6.8 | 11.00 |
2000 | 7.9 | 7.5 | 7.2 | 8.1 | 7.7 | 8.50
- 9.50 | 2001 | 7.6 | 7.2 | 6.7 | 7.8 | 7.3 | 8.50
- 9.00 | 2002 | 7.6 | 6.9 | 6.1 | 7.3 | 7.1 | 7.50
- 8.50 | 2003 | 7.0 | 6.2 | 5.3 | 6.6 | 6.5 | 4.25
- 6.00 | 2004 | 5.8 | 5.2 | 3.9 | 5.3 | 5.3 | 4.00
- 5.25 | 2005 | 4.6 | 4.2 | 3.0 | 3.8 | 4.2 | 5.25
- 5.50 | *
Relates to the prime lending rates of 5 major public sector banks.
** Relates
to the deposit rates of 5 major public sector banks.
Source :
(i) Base data are taken from Annual Accounts of Scheduled Commercial Banks 1979
to 2004 and Statistical Tables Relating to Banks in India 2004-05.
(ii) Handbook
of Statistics on the Indian Economy, 2004-05. | 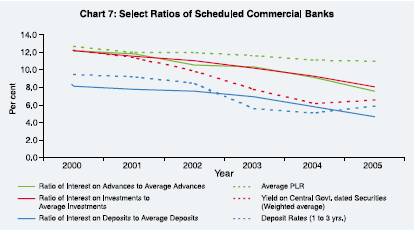
The
spread between the lending and deposit rates have reduced over the years from
1992 to 2005. The general fall in interest rates in the recent period is in consonance
with the monetary policy stance of a soft and flexible interest rate regime.
Section X
Concluding Observations There
has been a spurt in the number of banks during the late 1990s, which decreased
during the early period of the new millennium. This could be reflective of the
consolidation process, and in particular, the mergers and acquisitions that are
the order of the banking system at present. The number of bank offices increased
significantly during the early 1980s. After a consolidation phase during the late
1980s and early 1990s, there has been a moderate increase in the number of offices
mainly due to the entry of new generation private sector banks since late nineties.
The public sector banks continued to play a very prominent role in both deposit
mobilisation and credit disbursal even after the implementation of reforms since
1991. They contribute about 75 per cent of the total deposits mobilised and total
credit advanced by all scheduled commercial banks. The entry of domestic private
sector banks has been altering this trend to some extent since the late nineties. There
has been a significant change in the composition of deposits, with a clear shift
in favour of term deposits, whereas demand deposits witnessed a decline. The share
of savings bank deposits remained more or less constant. It is observed that more
funds of short-term nature in the form of demand deposits are parked with the
foreign banks group. This may be an indication that the business class is attracted
towards better service offered by foreign banks.
Even though the SLR
requirements have been reduced to the statutory minimum of 25 per cent, banks
still prefer to invest large portion of their investments in approved securities,
due to the risk-free and assured returns they get through such investments. However,
in the case of private sector banks in the domestic sector, there is a clear preference
for investments in other securities and a reduction of investments in government
and other approved securities. Since the year 2000, with the entry of more private
sector banks, this group invested more than one third of their total investments
in non-SLR securities, which indicates that the private banks, of late, are currently
venturing into more riskier, nonetheless challenging business.
Across
the bank groups, there has been a significant reduction in the non-performing
assets (NPAs). The composition of NPAs of public sector banks interestingly reveals
that NPAs connected to non-priority sector has increased, whereas, NPAs relating
to priority sector advances exhibited a decline. This goes to explode the commonly
held myth that the problem of NPAs is caused mainly due to the credit allocation
made to priority sectors.
The share of non-interest income in the total
income has been increasing across the different bank groups. This is a welcome
trend as it may reduce the risks arising out of the sole dependency on interest
as the source of income. Wages as a percentage of operating expenses of
public sector banks is more than 60 per cent. This situation possibly calls
for more apt and pragmatic human resource policies and proper manpower planning
for the future of these banks. Banks in the private sector both foreign and domestic,
however, have reduced their wage component in the operating expenses and are spending
more for other business boosting measures like image building, software development
etc. Compared to the pre-reform period, the ROA of public sector banks improved
significantly after the initiation of reforms, although it is still lower as compared
to foreign banks.
The objective of the analysis was to study the trends in
banking during a span of 25 years, covering both pre- and post- reforms period.
The study has clearly brought out the positive effects of the reform measures
on the banking industry in general. A comparative analysis of various bank
groups with respect to different variables has also identified certain specific
problem areas of the respective groups. The pace of the reform process is sometimes
a cause for concern and criticism. But, there seems to be a great wisdom in this
gradualism.
The Indian approach to financial sector reforms is based on
pancha sutra or five principles- cautious and proper sequencing; mutually
re-inforcing measures, complementarity between reforms in the banking sector and
changes in fiscal, external and monetary policies, developing financial infrastructure
and developing financial markets (Reddy, 2000). The progress of the banking sector
reforms this far, albeit slow, vindicates this stand.
References
1. Banerjee Abhijit V., Cole Shawn and Duflo Esther (2004):
“Banking Reform in India”, Bureau for Research in Economic Analysis
of Development, Policy Paper, No. 006, September, Harvard.
2.
Caprio G. Jr. and Klingebiel D. (1996) “ Bank Insolvency: Bad Luck, Bad
Policy, or Bad Banking ?” Annual World Bank Conference on Development
Economics 1996, Policy Research Working Paper, 1620, World Bank.
3.
Fama E (1985): “ What’s Different about Banks” Journal
of Monetary Economics, 15, pp. 29- 39.
4. Government of India
(1998) Report of the Committee on Banking Sector Reforms (Chairman: M
Narasimham).
5. Mohan Rakesh (2003): “ Transforming Indian
Banking: In Search of a Better Tomorrow”, Reserve Bank of India Bulletin,
January.
6. Mohan Rakesh (2004): “Finance for Industrial
Growth”, Reserve Bank of India Bulletin, March. 7.
Ramanathan A & Samuel Achamma (1997-98): “Financial Liberalization and
Economic Development: The Theory and Experience”, The Indian Economic
Journal, Vol. 46, July.
8. Ramasastri A S, Samuel Achamma
& Gangadaran S (2004): “Emerging Structure of Indian Banking”,
Seminar on Basel-II & Risk Management, Member Education Series, Indian
Institute of Banking and Finance,
Mumbai.
9. Ramasastri
A S, Samuel Achamma & Gangadaran S (2004): “Income Stability of Scheduled
Commercial Banks Interest vis-à-vis Non-Interest Income”, Economic
and Political Weekly, Vol. XXXIX No.12, March 20-26.
10. Rangarajan C
(1998): Indian Economy: Essays in Money and Finance, UBSPD, New Delhi.
11. Reddy Y.V. (2000): Monetary and Financial Sector Reforms in India: A Central
Bankers’s Perspective, UBSPD.
12. Reddy Y.V. (2004): “Credit
Policy, Systems and Culture”, Reserve Bank of India Bulletin, March.
13. Reddy Y.V. (2005): “Banking Sector Reforms in India: An Overview”
Reserve Bank of India Bulletin, June.
14. Reserve Bank of India:
Report on Trend and Progress of Banking in India, Various issues.
15. Reserve Bank of India (1991): Report of the Committee on the Financial
System (Narasimham Committee Report).
16. Tandon Prakash (1989) Banking
Century: A Short History of Banking in India, Viking, New Delhi.
*
The authors are Director and Assistant Adviser, respectively, in the Department
of Statistical Analysis and Computer Services. The views expressed in the paper
are those of the authors’ and not of the institution to which they belong. |
 IST,
IST,


