 IST,
IST,


Developments in Cooperative Banking
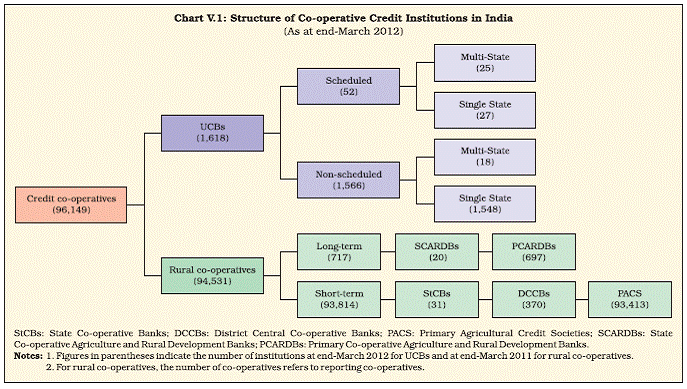
Over recent years, the financial health of the urban co-operative sector has shown an improvement. In 2011-12, the sector showed an increased return on assets and a further fall in the ratio of Non- Performing Assets (NPAs). As per the new CAMELS rating model, 61 per cent of the UCBs, accounting for about 78 per cent of the total banking business of the UCB sector, had ratings of ‘A’ and ‘B’, indicating the good financial health of this sector. As regards rural co-operatives, State Co-operative Banks and District Central Co-operative Banks showed some signs of improvement in profitability and asset quality in 2010-11, partly attributable to the prudential regulatory reforms and implementation of the revival package for the short-term rural co-operative sector. However, long-term rural co-operatives, such as State and Primary Co-operative Agriculture and Rural Development Banks, showed very weak financial health. Going forward, it is necessary to persevere with recapitalisation and regulatory reforms so that the rural co-operative sector can lend support to financial inclusion and agriculture. 1. Introduction 5.1 Co-operatives account for a relatively small share in the bank-dominated Indian financial system; however, given their geographic and demographic outreach, they hold a key position in the system1. Geographically, co-operatives have been instrumental in extending formal financial services to villages and small towns in India. Demographically, these institutions have enabled access to financial services to low and middle-income groups in both rural and urban areas. 5.2 Notwithstanding their role in enhancing the inclusiveness of the financial system, these institutions have been marred by weak financial health, partly on account of operational and governance-related concerns. Hence, there has been an ongoing effort to revitalise these institutions by means of various development and regulatory initiatives. In the case of urban co-operatives, the Reserve Bank has moved towards a more unified regulatory framework consequent to its Vision Document of 2005 aimed at creating a consolidated and stronger urban co-operative banking sector. As regards the short-term arm of rural co-operatives, the application of prudential regulations followed by recapitalisation has paved the way towards improving the financial health of these institutions. Apart from these ongoing initiatives, several new policy measures have been introduced with regard to the co-operative sector in 2011-12, which are discussed in Chapter 3. 5.3 In light of these policy initiatives, this chapter analyses the performance of co-operatives in 2011-12, drawing time-series as well as cross-sectional comparisons with other segments of the financial system, where necessary. As data on rural co-operatives are available with a lag of one year, the analysis for these institutions only goes as far as 2010-11. The analysis covered in this chapter broadly pertains to 1,618 Urban co-operative Banks (UCBs) and 94,531 rural co-operatives, including short-term and long-term co-operatives, as given in Chart V.1.
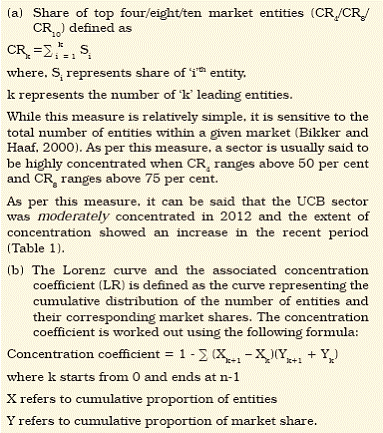
5.4 The chapter is organised into six sections. Section 2 analyses the performance of UCBs, using data on their assets and liabilities, income and expenditure, and soundness indicators. Section 3 reviews the performance of various tiers of the short-term and long-term rural co-operative credit structure. Sections 4 and 5 discuss salient developments pertaining to rural co-operatives with regard to licensing and implementation of the revival package for these institutions. Section 6 enumerates the developments related to Kisan Credit Cards (KCCs), a scheme for rural credit involving rural co-operatives. Section 7 concludes with the major observations from the chapter. 2. Urban Co-operative Banks Emergence of a stronger UCB sector through consolidation 5.5 The Urban Co-operative Bank (UCB) sector has emerged financially stronger since 2005, when the Reserve Bank conceived a Vision Document for the revival of this sector. Through the Document, the Reserve Bank laid down a multilayered regulatory and supervisory approach aimed at the merger/amalgamation of viable UCBs and the exit of unviable UCBs. On account of this process of consolidation, there has been a continued reduction in the number of UCBs (Chart V.2). In continuation with this trend, at end-March 2012, the total number of UCBs stood at 1,618 as against 1,645 at end-March 2011. Further, there was a steady rise in the number of financially stronger UCBs (defined as UCBs belonging to Grades I and II) and a decline in the number of financially weaker UCBs (defined as UCBs belonging to Grades III and IV) between 2005 and 20112. 5.6 Maharashtra, the State with the largest concentration of UCBs, accounted for the maximum number of mergers. In the total number of mergers that took place until end-March 2012 since 2005, Maharashtra had a share of about 61 per cent, followed by Gujarat with a share of 19 per cent and Andhra Pradesh with a share of 8 per cent (Chart V.3).
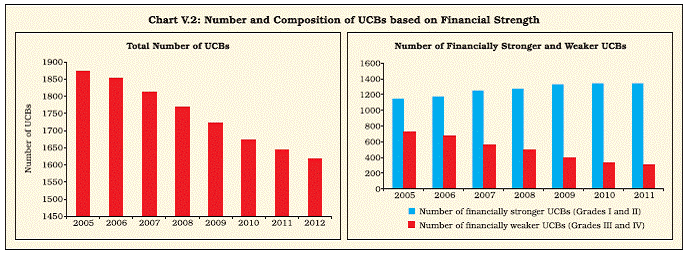
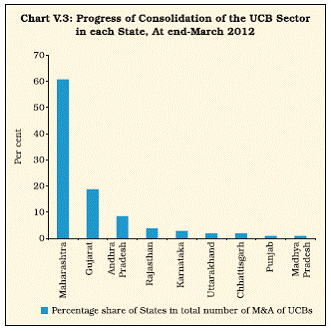
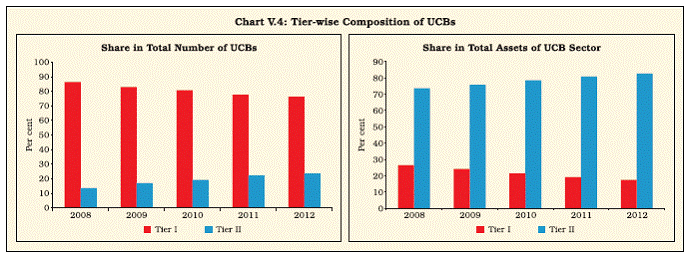
Rapid growth of Tier II UCBs in 2011-12 indicates an expansion of the UCB sector 5.7 Following the Vision Document of 2005, UCBs were classified into Tier I and Tier II categories based on their deposit base, and a differentiated regulatory treatment was laid down for these two categories3. In recent years, Tier II banks, which have a larger deposit base and wider geographical presence, have grown in terms of both number and asset size (Table V.1 read with Chart V.4). A new CAMELS rating method for judging the financial strength of UCBs 5.8 UCBs were earlier classified into various grades based on their financial health for regulatory and supervisory purposes. However, with the introduction of the CAMELS (capital adequacy, asset quality, management, earnings, liquidity, and systems & control) rating model, this classification was discontinued and a newer dimension was introduced to judge the financial strength of UCBs, namely, the credit rating of these institutions. 5.9 Under the new CAMELS rating model, a composite rating of A/B/C/D (in decreasing order of performance) is being given to a bank, based on the weighted average rating of the individual components of CAMELS. The rating of A/B/C is suffixed with a ‘+’ or ‘-’ sign, wherever necessary, to reflect granularity in the components and composite rating of the bank. The rating of D represents the lowest rating. 5.10 As per this new classification, at end-March 2012 about 61 per cent of the UCBs had composite ratings of A and B, accounting for about 78 per cent of the total banking business (represented by deposits plus credit) of the UCB sector. Further, 32 per cent of the UCBs had a composite rating of C; these UCBs accounted for about 18 per cent of the banking business of the UCB sector. Only about 7 per cent of the UCBs had the lowest rating of D, representing the weakest financial health (Table V.2).
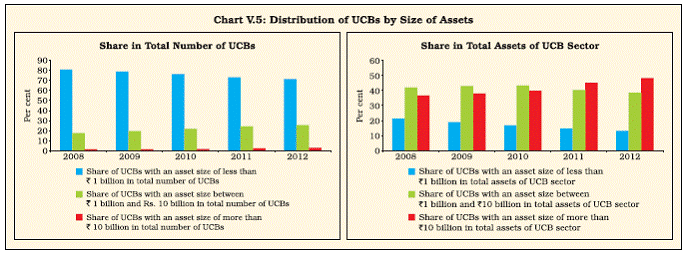
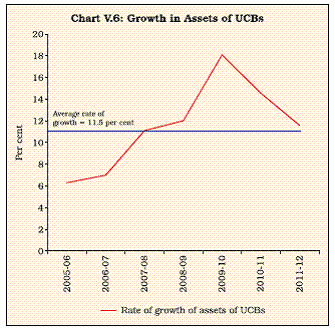
Asset concentration within the UCB sector rose in 2011-12 5.11 Over the years, partly as a fall-out of consolidation, there has been an increase in asset concentration within the UCB sector. The number of UCBs with an asset size of more than `10 billion quadrupled between 2008 and 2012. Notably, the percentage share of such UCBs in the total assets of the UCB sector increased from about 37 per cent to 48 per cent during this period (Chart V.5). 5.12 At end-March 2012, UCBs with a deposit base of over `10 billion accounted for 45 per cent of total deposits. Further, UCBs with a credit size of over `10 billion accounted for about 37 per cent of total advances of the UCB sector (Table V.3). Box V.1 provides a detailed discussion on the concentration within the UCB sector, using various statistical measures of market concentration. Asset growth of UCBs slowed down in 2011-12 5.13 The growth in the assets of UCBs picked up significantly from a single-digit figure to a double-digit one since the beginning of the process of consolidation in 2005. However, after peaking at 18 per cent in 2009-10, growth steadily slowed but remained in the double digits (Chart V.6). 5.14 The growth in credit witnessed a slowdown in 2011-12, possibly reflecting the high interest and slack credit demand prevailing during most part of the year. Investments, the second major use of funds of UCBs, also posted slower growth in 2011-12, on account of a decline in the growth of SLR investments (Tables V.4 and V.5).
Box V.1: An Analysis of Market Concentration within the UCB Sector Since the formation of the Vision Document and issuance of guidelines aimed at consolidation of the Urban Co-operative Bank (UCB) sector, the sector has exhibited phenomenal growth. It accounted for 3.7 per cent of the SCB sector by end-March 2012 by posting an exponential rate of growth of about 13 per cent per annum between 2005 and 2012. As the sector has consolidated, there has been a rise in
the extent of concentration within this sector. Though
market concentration is analysed using several statistical
measures, a few measures have been selected here, keeping
in view the availability of data on the UCB sector. The two
measures used are the following:
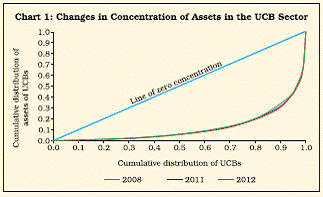
As the concentration coefficient ranged above 0.5, the UCB sector showed a relatively high degree of concentration as per this measure. Moreover, there was a moderate rise in the extent of concentration over time, as borne out both from the concentration curve and the concentration coefficient (Chart 1 read with Table 2). In conclusion, it could be said that the UCB sector was marked by a moderate to high degree of asset concentration and the degree of concentration has increased over time, partly on account of the regulatory reforms aimed at consolidating the sector.
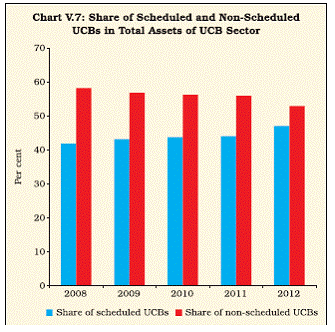
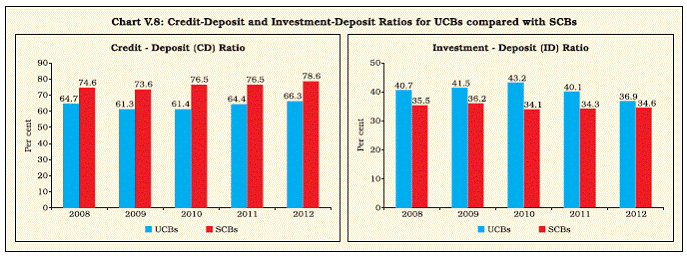
Reference: Bikker, J.A. and K. Haaf (2000), “Measures of Competition and Concentration in the Banking Industry: A Review of Literature”, De Nederlandsche Bank, Research Series Supervision No. 27. Rising share of scheduled UCBs suggests a trend of expansion in the capital base of UCBs 5.15 Over recent years, there has been a rising trend in the share of scheduled UCBs, suggesting a general trend of expansion in the capital base of UCBs (Chart V.7). Scheduled UCBs are banks included in the Second Schedule of the RBI Act, 1934 and include banks that have paid-up capital and reserves of not less than `0.5 million and carry out their business in the interest of depositors to the satisfaction of the Reserve Bank. Persistently lower CD ratio for UCBs than SCBs 5.16 Though there has been a rising trend in the Credit-Deposit (CD) ratio of UCBs reflecting the general expansion in banking business of these institutions, the ratio has been persistently lower than that of SCBs (Chart V.8). Correspondingly, investments were the preferred use of funds among UCBs than SCBs. Remarkable improvement in profitability of UCBs driven by high growth in total income 5.17 The overall levels of UCB profits exhibited an improvement in 2011-12, attributable to an almost doubling of the growth in the total income of these institutions (Table V.6). This increase was on account of an expansion in both interest and non-interest components of income.
Rising trend in various indicators of profitability for UCBs 5.18 In continuation of the past trend, there has been an improvement in the major indicators of profitability of UCBs in 2011-12 (Table V.7). Both the Return on Assets (RoA), defined as net profits as per cent of average assets, as well as Return on Equity, defined as net profits as per cent of average equity, showed a perceptible rise during the year. 5.19 Further, the rise in RoA could be seen not just at the aggregate or system-wide level but also at the disaggregated level; there was a discernible upward shift in RoA among all scheduled UCBs in 2011-12. No scheduled UCB reported a negative RoA in this year unlike in the past (Appendix Table V.1).
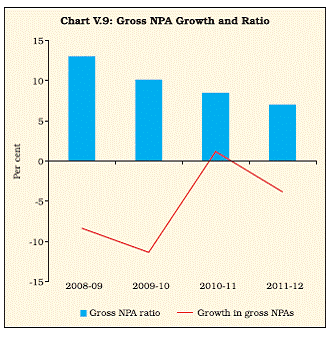
Improvement in the asset quality of UCBs was sustained 5.20 UCBs have shown a steady improvement in their asset quality over recent years. There has been a decline in gross Non-Performing Assets (NPAs), both in absolute and ratio terms. In continuation of this trend, UCBs reported negative growth in gross NPAs and also showed a fall in their gross NPA ratio in 2011-12 (Chart V.9 read with Table V.8).
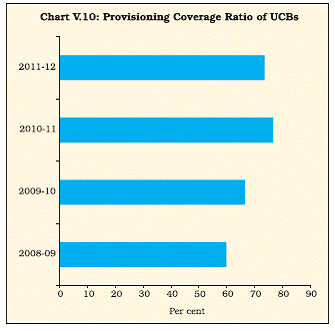
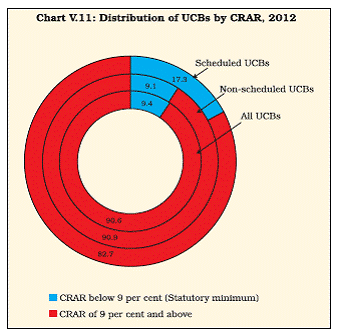
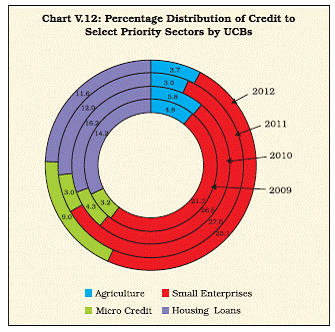
Rising Provisioning Coverage Ratio (PCR) for UCBs 5.21 Not only were the NPAs of UCBs on the decline, but also their provisions were on a steady rise in recent years. As a result, their Provisioning Coverage Ratio (PCR), defined as provisions as per cent of gross NPAs, also showed a largely rising trend (Chart V.10). Majority of UCBs reported CRAR above the statutory minimum in 2011-12, but capital position of scheduled UCBs was much weaker than non-scheduled UCBs 5.22 The majority of UCBs (about 91 per cent) reported Capital to Risk-Weighted Assets Ratio (CRAR) above the statutory minimum of 9 per cent at end-March 2012 (Table V.9 read with Chart V.11). However, the capital position of scheduled UCBs was much weaker than that of non-scheduled UCBs. Moreover, it was a disquieting feature that most of the scheduled UCBs with CRAR below the regulatory minimum had a negative CRAR. Small enterprises and housing – principal elements in UCB credit in 2011-12 5.23 Given their urban focus, UCBs mainly cater to the credit needs of small enterprises and the housing sector. These two sectors accounted for over one-third of the total credit of UCBs in 2011- 12 (Chart V.12 read with Table V.10). Further, they had a share of around 70 per cent in the total priority sector credit of UCBs.
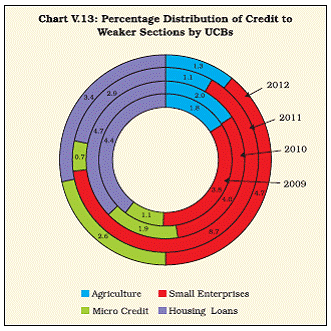
Increase in the provision of micro credit by UCBs 5.24 Micro credit, a component of the priority sector, has increased in terms of importance for UCBs. Within the total priority sector credit given to weaker sections, which can be taken as a reflection of the contribution of UCBs to financial inclusion, micro credit showed a significant increase in 2011-12. It competed closely with housing and small enterprises, the two major priority sectors for UCBs (Chart V.13). A high but declining degree of geographical concentration of banking business of UCBs 5.25 The banking business of UCBs captured by credit plus deposits remained spatially concentrated in the western region followed by the southern region. These two regions accounted for only 27 per cent of total districts in India and yet controlled about 92 per cent of the total banking business of UCBs (Table V.11 read with Appendix Table V.3). On the other hand, the remaining four regions accounted for about 73 per cent of total districts, but had a share of less than 9 per cent in the total banking business of UCBs. The volume of banking business per branch too was significantly higher in the western and southern regions (Table V.12).
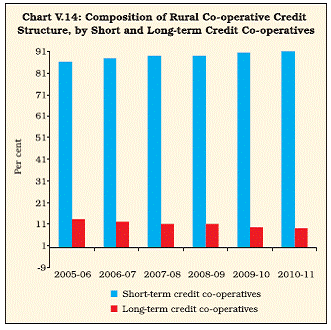
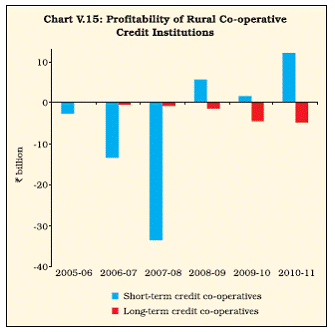
5.26 However, it is noteworthy that the degree of concentration of banking business of UCBs showed some signs of decline over time. The coefficient of variation in the banking business of UCBs across regions showed a mild but steady fall between 2009 and 2012 (Table V.12). 3. Rural Co-operatives4 Short-term co-operatives dominate rural co-operative credit structure 5.27 Over the years, there has been a growing dominance of short-term credit co-operatives in the rural co-operative credit structure. Concomitantly, the share of long-term credit co-operatives has been on a steady decline (Chart V.14 read with Table V.13). Revival in profitability of short-term co-operatives as against long-term co-operatives 5.28 The profitability of short-term credit co-operatives, at the aggregate level, has shown a distinct revival since 2008-09. This is in contrast with the earlier years, when there was a continued increase in the losses reported by these co-operatives. The improvement in the profitability of short-term credit co-operatives could be partly attributed to the reforms implemented across several States as part of the revival package for these institutions5. On the other hand, long-term credit co-operatives showed a continued deterioration in profitability with absolutely no signs of revival (Chart V.15).
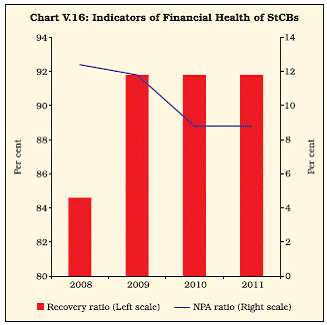
Short-term rural credit co-operatives State Co-operative Banks Slowdown in the growth of the balance sheet of StCBs in 2010-11 5.29 There was a decline in the growth of the balance sheet of State Co-operative Banks (StCBs) in 2010-11 over 2009-10. On the liabilities side, the growth in the balance sheet of StCBs in 2010- 11 emanated from high growth in borrowings, while on the assets side, the growth was attributed to loans and advances or credit (Table V.14). Possibility of a slowdown in growth of the balance sheet of scheduled StCBs in 2011-12 5.30 Advance information on scheduled StCBs for 2011-12 available from Section 42(2) returns has been analysed to gauge the more recent trends. The trends suggest that although there has been a revival in the growth of both deposits and SLR investments of scheduled StCBs in 2011-12, there has been a slowdown in the growth of credit from StCBs during this year (Table V.15). Turnaround in profitability of StCBs in 2010- 11 on account of higher growth in income 5.31 There was a near-doubling of net profits of StCBs in 2010-11, suggesting a complete turnaround from the negative growth in profits shown by these institutions in 2009-10 (Table V.16). The increased profitability of StCBs was on account of the growth in income outpacing that of expenditure. The growth in income was primarily attributable to a higher growth in interest income. 5.32 Within the total expenditure of StCBs, there was increased growth in provisions and contingencies, necessitated partly by the increased growth in the NPAs of these institutions in 2010-11. High growth in NPAs of StCBs in 2010-11, though NPA ratio was largely maintained 5.33 There was a deterioration in the NPA position of StCBs in 2010-11. However, on account of high growth in credit from StCBs, the NPA ratio (defined as NPAs as per cent of loans outstanding) was largely maintained at around 8.9 per cent in 2010-11 (Table V.17). The high growth in NPAs in 2010-11 emanated from sub-standard assets, since the growth in doubtful and loss assets showed a slight moderation over the previous year. Like the NPA ratio, the recovery-to-demand ratio suggesting the extent of recovery of loans as a proportion of the expected recovery, was maintained at 92 per cent in 2010-11. Perceptible improvement in the financial health of StCBs 5.34 There have been signs of distinct improvement in the financial health of StCBs in recent years. Between 2008 and 2011, there was no increase in the NPA ratio of StCBs. The ratio either showed a decline or was, at best, maintained at the previous year’s level (Chart V.16). There was a similar trend for the recovery ratio, with the ratio either showing a rise or remaining unchanged.
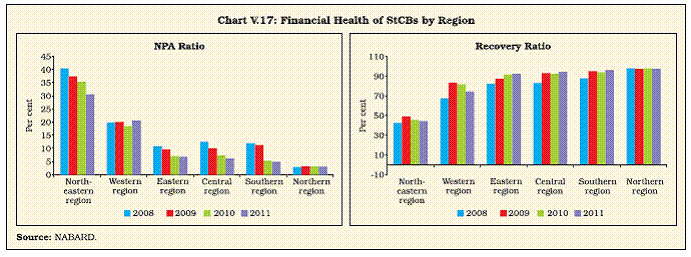
Broad-based improvement in financial health of StCBs across most regions, except the western region 5.35 The improvement in the financial health of StCBs as suggested by the NPAs and recovery ratios could be seen across most regions except the western region (Chart V.17 read with Appendix Table V.4). The NPA ratio showed a rising trend, while the recovery ratio posted a decline in the western region in complete contrast to the trend observed across all other regions. District Central Co-operative Banks Like StCBs, slowdown in the growth of the balance sheet of DCCBs 5.36 Similar to StCBs, District Central co-operative Banks (DCCBs) witnessed a slowdown in their balance sheet in 2010-11 (Table V.18). The slowdown in the balance sheet of DCCBs was on account of a slowdown in deposits on the liabilities side and investments on the assets side, although the credit growth of DCCBs posted an increase. Declining trend in the profits of DCCBs 5.37 Although DCCBs as a whole reported profits in 2010-11, there was a decline in the quantum of profits reported by these institutions (Table V.19). The decline in profitability mainly emanated from a high growth in operating expenses, which outpaced the growth in income of these institutions.
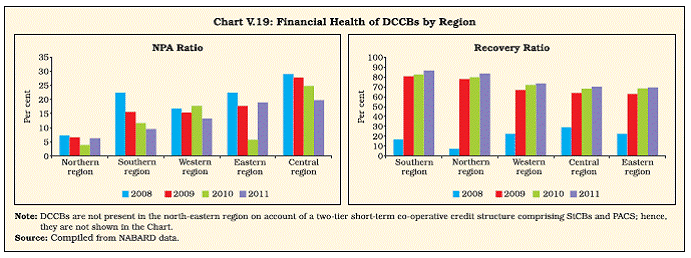
Further improvement in asset quality of DCCBs 5.38 There was a continued improvement in the asset quality of DCCBs, with a decline in the NPA ratio in 2010-11 (Table V.20). Also, contrary to the trends observed in the case of StCBs, there was a decline in absolute terms in the NPAs of DCCBs between 2009-10 and 2010-11 (Table V.20 read with Table V.17). The recovery ratio of DCCBs increased in 2010-11. Distinct improvement in the financial health of DCCBs, like StCBs 5.39 There was a distinct improvement in the financial health of DCCBs in recent years, again partly reflecting the outcome of the reform package being implemented for these institutions. The recovery ratio of DCCBs showed a consistent increase, while the NPA ratio posted a decline (Chart V.18). Signs of improvement in financial health of DCCBs across all regions 5.40 Though there was an improvement in the financial health of DCCBs at the aggregate level, this improvement was not spread across all regions (Chart V.19 read with Appendix Table V.5). On the one hand, DCCBs in the southern and northern regions were financially most sound, as indicated by low NPAs and a high recovery ratio, on the other hand, the financial health of DCCBs in the central, eastern and western regions appeared relatively less robust. However, over recent years, the regional gap in terms of both these indicators narrowed considerably, suggesting an increase in the financial soundness of DCCBs across the country.
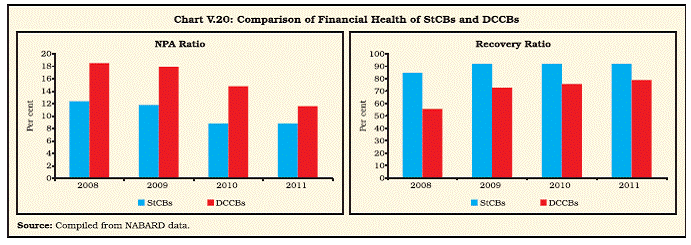
Notwithstanding improvement, DCCBs had much weaker financial health than StCBs 5.41 Notwithstanding the decline in the NPA ratio and the rise in the recovery ratio, it is noteworthy that the financial health of DCCBs remained generally much weaker than that of StCBs (Chart V.20).
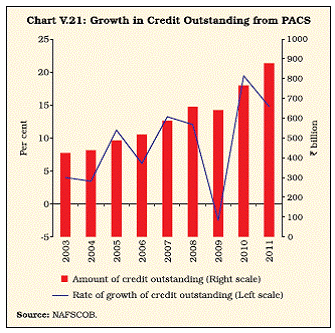
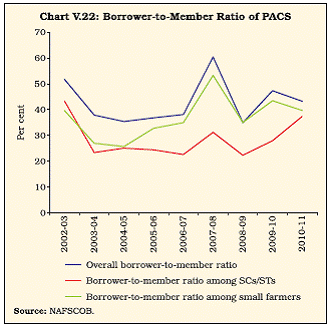
Primary Agricultural Credit Societies Slower credit growth for PACS in 2010-11 5.42 The credit growth of Primary Agricultural Credit Societies (PACS) slowed slightly in 2010-11 compared to 2009-10 (Chart V.21 read with Table V.21). Persistently low borrower-to-member ratio for PACS 5.43 The borrower-to-member ratio is a useful indicator of access to credit from PACS. This ratio has generally remained below 50 per cent since 2003, suggesting that only about half the members of PACS access credit during each year6. Moreover, among the backward groups, viz., Scheduled Castes and Scheduled Tribes (SCs/STs), the ratio generally ranged below 30 per cent. The ratio among small farmers too was relatively low when compared with the overall borrower-to-member ratio (Chart V.22).
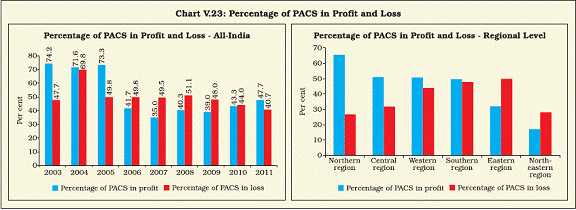
A trend of slow decline in the number of loss-making PACS 5.44 There was a slow decline in the percentage of loss-making PACS over recent years, particularly since 2008. Despite the decline, the percentage of loss-making PACS competed closely with the percentage of profit-making PACS (Chart V.23)7. 5.45 The percentage of loss-making PACS was much larger in the eastern and north-eastern regions (Chart V.23 read with Appendix Table V.6). Long-term rural credit co-operatives State Co-operative Agriculture and Rural Development Banks Expansion in the balance sheet of SCARDBs in 2010-11 5.46 The balance sheet of SCARDBs in 2010-11 reflected a high growth in borrowings, which accounted for about 60 per cent of the total liabilities of these institutions. On the assets side, the major driver of growth was credit, which also accounted for a little over 60 per cent of the total assets of these institutions (Table V.22). 5.47 A comparison of the balance sheets of apex-level institutions of the short-term and long-term co-operative structures distinctly brought out the dwindling asset and credit size and weakening capital position of SCARDBs in comparison with StCBs during recent years (Box V.2).
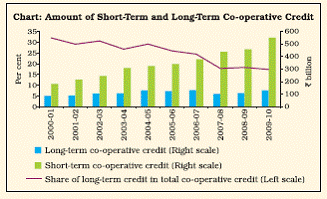
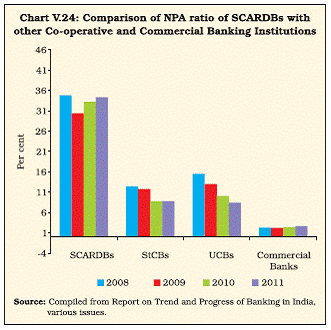
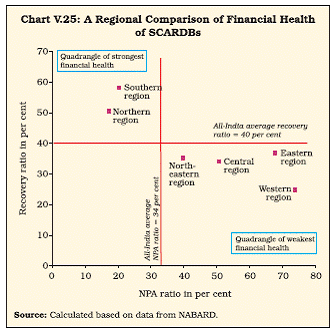
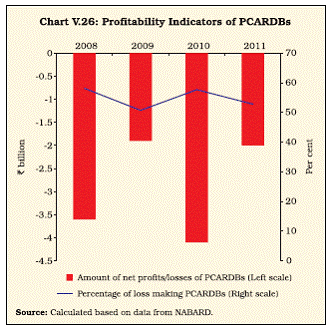
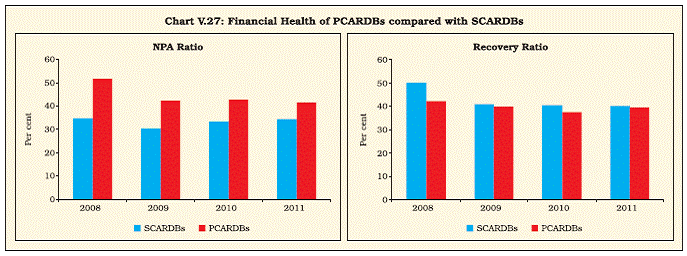
As in the past, SCARDBs reported losses in 2010-11 5.48 SCARDBs reported losses in 2010-11, as was the case in 2009-10. The loss-making position of SCARDBs was on account of a negative growth in total income coupled with increased growth in their total expenditure arising from a steep rise in interest as well as operating expenses (Table V.23). Weak asset quality of SCARDBs 5.49 The asset quality of SCARDBs has been poor, with the NPA ratio nearing 34 per cent (Table V.24). A comparison of SCARDBs with StCBs, UCBs and commercial banks brings out the dismal quality of assets of SCARDBs. Moreover, contrary to a declining trend in the NPA ratios of StCBs and UCBs, the NPA ratio of SCARDBs has fluctuated around a rising trend in recent years (Chart V.24). Asset quality of SCARDBs in the western region was the weakest 5.50 Similar to StCBs, the SCARDBs in the western region were observed to be financially the most fragile. At end-March 2011, SCARDBs in the western region had an abysmally high NPA ratio of 74 per cent. This implied that only one-fourth of the loan assets of these institutions were standard assets (Chart V.25 read with Appendix Table V.7). Primary Co-operative Agriculture and Rural Development Banks Marginal growth in the balance sheet of PCARDBs in 2010-11 5.51 There was negligible expansion in the balance sheet of Primary Co-operative Agriculture and Rural Development Banks (PCARDBs) in 2010-11. The major component of uses of funds of PCARDBs, namely credit, and that of sources of funds, namely borrowings, showed a negligible growth of less than 1 per cent in 2010-11, broadly in line with the trend during the previous year (Table V.25). Like SCARDBs, PCARDBs reported continued losses in 2010-11 5.52 Similar to SCARDBs, PCARDBs reported losses in 2010-11 at the aggregate level (Table V.26). The majority of these institutions were loss-making during the year (Chart V.26 read with Appendix Table V.8). Moreover, a disquieting feature is that there was no perceptible improvement in the profitability of PCARDBs in the recent past. In terms of financial health, PCARDBs were far weaker than SCARDBs 5.53 Although the long-term co-operative structure as a whole was weak, within this structure financial health deteriorated significantly as we moved from the higher tier to the lower tier. In other words, the financial health of PCARDBs was much more fragile than that of SCARDBs (Table V.27 read with Table V.24; Chart V.27). Box V.2: Weakening Long-Term Co-operative Credit Structure: A Comparative Analysis of Apex-Level Institutions Origin and rationale for long-term credit co-operatives Co-operatives were the first formal institution created to address the rural credit needs in the country in the early 20th century, following co-operative societies that had been very successful in some Western European countries. However, unlike other countries that experimented with credit co-operatives, in India two distinct sets of co-operatives viz., short-term and long-term co-operatives, were created with specific development objectives. While short-term co-operatives were created to meet the credit needs of farmers for seasonal agricultural activities and marketing of crops, long-term co-operatives in the form of land mortgage banks (LMBs) were created in order to meet the long-term credit needs of farmers for land development. Over time, these long-term co-operatives diversified their lending operations and were renamed - first, as Land Development Banks (LDBs) and then as Agriculture and Rural Development Banks (ARDBs) (GoI, 2004). Slowdown in disbursal of long-term co-operative credit In recent years, there has been a perceptible slowdown in the disbursal of long-term co-operative credit (Chart below). The share of long-term credit in total co-operative credit (disbursed) stood at 32 per cent in 2000-01, which almost halved to 17 per cent by 2009-10. Even in absolute terms, there was a decline in the amount of long-term credit disbursed through co-operatives for certain years in the 2000s. Dwindling asset size and capital base of SCARDBs relative to StCBs A comparison of apex-level institutions of long-term and short-term co-operatives, namely SCARDBs and StCBs, brings out the growing divergence between the growth of long-term and short-term structures (Table above). This analysis suggests that (a) For every `100 of total assets of StCBs, SCARDBs reported assets worth `26 in 2008. By 2011, the relative asset size of SCARDBs had declined to `22. (b) The contraction was even more striking when the size of the credit portfolio of SCARDBs was compared with that of StCBs. For every `100 of credit reported by StCBs, SCARDBs reported credit worth `37 in 2008. By 2011, the relative amount for SCARDBs had shrunk to `28. (c) The relative weakening of SCARDBs was particularly evident from the changes in the capital base of these institutions. For every `100 of capital of StCBs, the amount of capital for SCARDBs was `80 in 2008. By 2011, there was a steep reduction in the relative amount of capital for SCARDBs, reaching half its level in 2008.
The revival package, as recommended by the Vaidyanathan Committee of 2004, has been under implementation for short-term co-operatives since 2006 and, by 2012, 25 States have taken steps towards reviving their short-term co-operatives (refer to Section 5 of this chapter). However, as regards long-term co-operatives, the implementation of such a package is still awaited. Evidently, the sustainability of long-term co-operatives is under pressure, and these institutions are in need of an urgent revival through appropriate reforms. Reference: Government of India (2004), “Task Force on Revival of Rural Co-operative Credit Institutions (Long-term)” (Chairman: Prof. A. Vaidyanathan), New Delhi. 4. Progress on Licensing of Rural co-operatives 5.54 The Reserve Bank, the licensing authority for StCBs and DCCBs under the Banking Regulation Act, 1949 [As Applicable to co-operative Societies (AACS)], had drawn a roadmap to ensure that only licensed entities operate in the co-operative space. The Reserve Bank also issued revised guidelines in 2009, in consultation with NABARD, for granting licences to rural co-operative banks that had a CRAR of 4 per cent and above, as per the latest inspection report of NABARD, and that also complied with the CRR and SLR requirements during the past one year. The Reserve Bank has since granted licences to co-operative banks that complied with the above conditions and has been undertaking a periodic review of unlicensed banks in consultation with NABARD.
5.55 As on March 31, 2012, 43 banks, i.e., 1 StCB and 42 DCCBs, remained unlicensed. The compliance regarding unlicensed co-operative banks was once again reviewed in co-ordination with NABARD and it was decided that to ensure stability of the financial system and to protect the interest of depositors of the unlicensed banks and the public in general, unlicensed banks may be prohibited from accepting fresh deposits under Section 35A of the Banking Regulation Act, 1949 (AACS). 5.56 Further, it was decided to form a Task Force to closely monitor the progress of unlicensed DCCBs through a Monitorable Action Plan (MAP). This plan would be prepared by the concerned banks and approved by the Task Force. The aim of this Task Force would be to ensure that the DCCBs attained the eligibility for issue of a license in the shortest possible time. The Task Force would also examine alternative formal channels of credit in the regions where these banks were functioning to ensure that banking services in general and credit flow to important sections of the economy, and agriculture in particular, were not adversely affected, if the unlicensed banks were not in a position to acquire a licence.
5.57 Further, as suggested in the Annual Policy Statement for 2012-13, a Working Group [rechristened as an “Expert Committee” (Chairman: Dr. Prakash Bakshi) following induction of outside experts in the Working Group] was set up in July 2012 to review the short-term rural co-operative structure and examine alternatives including the feasibility of setting up a two-tier structure instead of the existing three-tier structure. The Committee would also examine the feasibility of merging weak/unviable DCCBs with financially strong DCCBs in adjacent districts. In places where DCCBs were financially defunct, the Committee would explore alternate channels of rural credit delivery, such as commercial banks lending to PACS. It would also examine the enhancement of CRAR by StCBs/DCCBs to 9 per cent and suggest ways to augment the capital of these institutions. 5. Progress relating to Revival of Rural Co-operatives Considerable progress has been made in reviving the short-term co-operative credit structure 5.58 A major development in the area of rural co-operatives has been their revival through a practical plan of action that follows the recommendations of the Task Force on Revival of Co-operative Credit Institutions (Short-term) (Chairman: Prof. A. Vaidyanathan) in 2004. The plan of action was finalised by the Government of India in consultation with the State Governments. The package broadly aimed at providing financial assistance to co-operatives and introducing legal and institutional reforms in these institutions. The current status of these reforms is discussed in Box V.3.
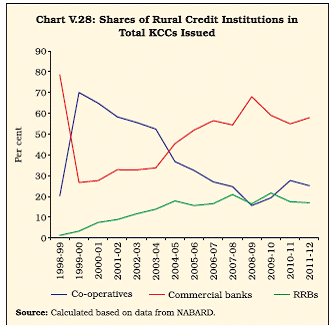
Box V.3: Reforms for the Revival of Short-term Rural Co-operatives The major components of the plan of action include providing recapitalisation assistance to rural co-operatives to bring them to an acceptable level of health. Further, it aims to introduce certain legal and institutional reforms in these institutions to ensure the democratic, self-reliant and efficient functioning of these institutions. Recapitalisation assistance An amount of `98.5 billion (including `90 billion as the Central Government’s share and `8.5 billion as the State Government’s share) was released up to March 31, 2012 to recapitalise 54,728 short-term co-operatives (54,715 PACS and 13 DCCBs) in 17 States to wipe out the accumulated losses prevailing as at end-March 2004 and to enable them to reach a minimum CRAR of 7 per cent by end-March 2004. Legislative reforms At end-March 2012, 21 States had amended their respective State co-operative societies’ acts. These included Andhra Pradesh, Arunachal Pradesh, Bihar, Gujarat, Haryana, Karnataka, Jammu and Kashmir, Jharkhand, Madhya Pradesh, Maharashtra, Manipur, Mizoram, Meghalaya, Nagaland, Odisha, Rajasthan, Sikkim, Tamil Nadu, Tripura, Uttar Pradesh and West Bengal. Further, the State Governments of Chhattisgarh and Assam accorded cabinet approval to the proposed amendments to their co-operative societies’ acts, pending the actual amendment, which would take a little longer. The amendments to the co-operative societies’ acts in Punjab and Uttarakhand are under consideration by their respective State Governments. The legislative reforms aimed at providing full functional autonomy to co-operatives including: (a) ensuring full voting membership rights to all users of financial services, including depositors; (b) removing state intervention in administrative and financial matters in co-operatives; (c) ensuring timely elections before the expiry of the term of the existing Boards; and (d) limiting the powers of the State Government to supersede elected boards. Training reforms NABARD has designed nine training modules for capacity building of functionaries of co-operatives besides Board of Directors and Chief Executive Officers. The programmes are being conducted by the training establishments of NABARD, along with the training partners of the States and the National Council of Co-operative Training (NCCT). Corporate Governance reforms The Reserve Bank has prescribed ‘Fit and Proper’ criteria for the appointment of Chief Executive Officers and professional Directors in StCBs and DCCBs. Following these prescriptions, all co-operative banks have been implementing these criteria. Technological reforms NABARD has finalised the core software and made it available to 20 States, viz., Arunachal Pradesh, Assam, Bihar, Chhattisgarh, Gujarat, Jammu and Kashmir, Jharkhand, Karnataka, Madhya Pradesh, Maharashtra, Manipur, Meghalaya, Mizoram, Nagaland, Odisha, Rajasthan, Sikkim, Tripura, Uttar Pradesh and West Bengal. The trial run of the software has been completed in 10 States, viz., Assam, Arunachal Pradesh, Chhattisgarh, Gujarat, Jharkhand, Maharashtra, Madhya Pradesh, Odisha, Uttar Pradesh and West Bengal, and is in progress in Karnataka, Rajasthan and Tripura. The remaining States have initiated steps for the trial run. 5.59 Since the finalisation of this plan of action, 25 States have entered into a Memorandum of Understanding (MoU) with GoI and NABARD to implement this plan. They include Andhra Pradesh, Arunachal Pradesh, Assam, Bihar, Chhattisgarh, Gujarat, Haryana, Jammu and Kashmir, Jharkhand, Karnataka, Madhya Pradesh, Maharashtra, Manipur, Meghalaya, Mizoram, Nagaland, Odisha, Punjab, Rajasthan, Sikkim, Tamil Nadu, Tripura, Uttarakhand, Uttar Pradesh and West Bengal, which covers more than 96 per cent of the short-term co-operatives in the country. Revival package for long-term co-operative credit structure is awaited 5.60 As in the case of short-term co-operative structure, the Task Force on Revival of Rural co-operative Credit Institutions (Long-term) was constituted by the Government of India in 2005 (Chairman: Prof. A. Vaidyanathan) to suggest an implementable action plan for reforming long-term co-operatives. The Central Government discussed the recommendations of the Task Force with the State Governments in October 2007, January 2008 and February 2008 in three specially convened meetings. In the Union Budget 2008-09, it was indicated that a consensus was reached with the State Governments on the modalities of the plan of action for revival of long-term co-operatives. 5.61 Subsequent to the implementation of the Agricultural Debt Waiver and Debt Relief Scheme and feedback received from the State Governments, the Central Government revised the reform package for long-term co-operatives. However, before announcing the package, the Central Government decided to relook at the viability and relevance of a separate package for long-term co-operatives in the backdrop of: (i) the implementation of a package for short-term co-operatives and (ii) the aggressive branch and business expansion by commercial banks and Regional Rural Banks in rural areas in recent years, as a consequence of the policy of financial inclusion. 5.62 Consequently, a separate Task Force was constituted in September 2009 (Chairman: Shri G. C. Chaturvedi). The Task Force submitted its report in 2010 and is under consideration by the Central Government. The announcement of the reform package by the Central Government for long-term co-operatives is, thus, awaited. 6. Progress relating to Rural Credit Measures that have Specific Implications for Co-operatives Kisan Credit Card 5.63 The Kisan Credit Card (KCC) scheme is being implemented through co-operatives, SCBs and RRBs to provide easy access to adequate, timely and cost-effective credit for farmers. Commercial banks leading in KCC distribution 5.64 Commercial banks were leading in the distribution of KCCs, accounting for 58 per cent of the total cards issued at end-March 2012. co-operatives had a share of about 25 per cent in the total cards issued, with RRBs accounting for the remaining 17 per cent (Chart V.28 read with Appendix Table V.9). 5.65 Since the inception of the KCC scheme in 1998-99, the shares of commercial banks and RRBs have witnessed a sharp increase in the total number of cards issued, while the share of co-operatives has slowed (Chart V.28). Although there has been a turnaround in the share of co-operatives since 2008-09, commercial banks have continued to be the most important means of KCC distribution in the country.
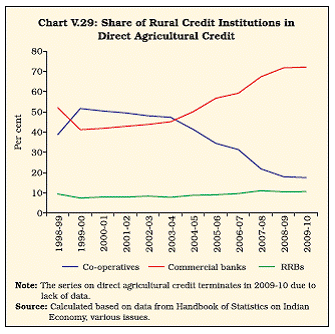
KCC emerging as a driver of agricultural credit in general, and agricultural credit supplied through commercial banks in particular 5.66 A comparison of the three institutions providing agricultural credit, viz., co-operatives, commercial banks and RRBs, in terms of their share in the total number of KCCs issued and amount of direct agricultural credit reveals a similarity in trends (Charts V.28 read with Chart V.29).
5.67 In the 2000s, total and direct agricultural credit in India showed sharp growth. This growth was primarily attributable to commercial banks, with commercial banks overtaking co-operatives and emerging as the most important source of agricultural credit in the country. Interestingly, the 2000s was also a period when the share of commercial banks in the total number of KCCs issued showed a rapid rise. Therefore, it can be deduced that KCCs, in some ways, were instrumental in stepping up agricultural credit in the country and raising the share of commercial banks in agricultural credit in the 2000s. 7. Overall Assessment A more profitable, sound and growing UCB sector, but with concerns relating to capital adequacy 5.68 Within the co-operative sector, UCBs present the story of a sector that has turned itself around to a considerable extent since the initiation of regulatory reforms in 2005. The sector, as a whole, has posted double-digit growth in assets along with an improvement in profitability and asset quality in 2011-12, as in the recent past. As a fall-out of consolidation, there has been growth in stronger entities and the exit of weaker entities from this sector. Concomitantly, there has been a rise in the degree of asset concentration within this sector. On the downside, though the level of capital adequacy of UCBs was satisfactory at the aggregate level, the capital position of scheduled UCBs appeared much weaker. A few of the scheduled UCBs even reported a negative CRAR. Financially weak short-term rural co-operative sector, with some signs of revival at the apex levels 5.69 Within rural co-operatives, short-term rural co-operatives at the apex levels showed some signs of revival in terms of profitability and asset quality in 2010-11, as in the recent past, which could be partly attributed to ongoing reforms in this sector. Though there was a slowdown in the growth of the balance sheet of State Co-operative Banks (StCBs) and District Central Co-operative Banks (DCCBs) in 2010-11, these institutions reported overall profits and showed a decline in their NPA ratios. Moreover, the improvement in profitability and asset quality could be seen broadly across all regions, but with the notable exception of the western region. 5.70 While there were signs of revival, financial health weakened as one moved to the lower tiers. The financial health of StCBs was better than that of DCCBs, which, in turn, was better than the financial health of Primary Agricultural Credit Societies (PACS). Thus, PACS still remained the weakest spot in the short-term co-operative credit structure, having very high levels of overdues and losses. Financial health of long-term rural co-operative sector continues to be fragile 5.71 In contrast to short-term rural co-operatives, long-term rural co-operatives continued to post losses and also exhibited weak asset quality in 2010-11, as in the past. The growth in the asset size of both State and Primary co-operative Agriculture and Rural Development Banks (SCARDBs and PCARDBs) remained much lower than their short-term counterparts in 2010- 11, as in the recent past. This led to a gradual decline in the share of long-term co-operatives in the total assets of the rural co-operative sector. 5.72 In sum, reforms pertaining to the urban co-operative and short-term rural co-operative sectors seem to have set in motion a process of revival in these sectors. As regards the urban co-operative sector, the improvement in financial performance and health is better established by now; for the short-term rural co-operative sector, the revival is more fragile and yet to spread across all regions in the country and all tiers of the sector. In the coming years, it needs to be seen whether the revival is sustained and broad-based. Further, it is imperative to pave the way for a revival of the long-term rural co-operative sector given the vital role played by these institutions in stepping up capital formation in Indian agriculture. 1 As at end-March 2011, the assets of rural and urban co-operatives taken together were about 12 per cent of the total assets held by Scheduled Commercial Banks (SCBs). 2 The data on grade-wise distribution of UCBs are not available for 2012 as this classification has been discontinued and a new rating-wise classification of UCBs has been introduced (see details later in the chapter). Grades were decided based on the financial performance of UCBs, which included parameters such as capital adequacy, level of NPAs and history of profit/loss. 3 Tier I UCBs were defined as UCBs with:
All other UCBs were defined as Tier II UCBs. 4 The section is based on the year 2010-11 given the lagged availability of data for rural co-operatives. 5 The details of the revival package for short-term credit co-operatives are discussed later in Section 5. 6 The ratio rose to a high of 60 per cent only in 2007-08 on account of a sharp rise by 65 per cent in the number of borrowers. However, going by the trend in the previous and subsequent years, this seems to be an outlier. 7 As regards the remaining PACS, either they broke even, reporting neither profit nor loss, or there was no information available on their financial health. |
|||||||||||||||||||||||||||||||||||||||||||||||||||||||||||||||||||||||||||||||||||||||||||||||||||||||||||||||||||||||||||||||||||||||||||||||||||||||||||||||||||||||||||||||||||||||||||||||||||||||||||||||||||||||||||||||||||||||||||||||||||||||||||||||||||||||||||||||||||||||||||||||||||||||||||||||||||||||||||||||||||||||||||||||||||||||||||||||||||||||||||||||||||||||||||||||||||||||||||||||||||||||||||||||||||||||||||||||||||||||||||||||||||||||||||||||||||||||||||||||||||||||||||||||||||||||||||||||||||||||||||||||||||||||||||||||||||||||||||||||||||||||||||||||||||||||||||||||||||||||||||||||||||||||||||||||||||||||||||||||||||||||||||||||||||||||||||||||||||||||||||||||||||||||||||||||||||||||||||||||||||||||||||||||||

Share this page:


Install the RBI mobile application and get quick access to the latest news!
Scan the QR code to install our app


Page Last Updated on:


