 IST,
IST,


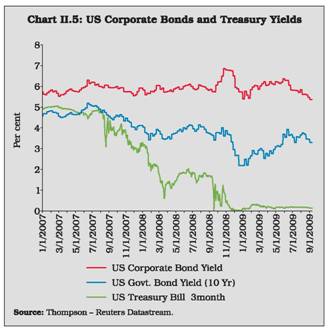
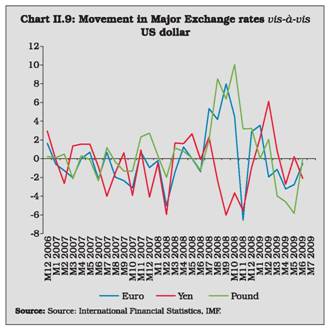
Global Banking Developments
September 2009 marked the first anniversary of the global financial crisis. It was September 2008 when America’s one of the biggest investment bank, Lehman Brothers, collapsed and triggered a chain reaction of economic, financial and psychological crisis which very soon engulfed the entire globe. The year 2008-09 turned out to be a year when hard-hit by the global financial crisis, the worldwide banking industry’s future development has been sharply drawn into focus. Recognising that repairing the financial system remains a key priority, the rescue measures were undertaken globally. These have contributed to an avoidance of “worst case scenarios”, in particular by reducing the default risk of major banks. From a period of volatility, the international financial markets are normalizing in Q2 of 2009. However, the global banking sector outlook remains difficult on both the sides of the Atlantic. Due to proactive and swift action of central banks and Governments and regulatory and supervisory policy initiatives, the adverse impact of the crisis remained under control. The global economy is slated to recover during 2010, which may facilitate revival of the global banking system. 1. Introduction 2.1 The global financial markets that remained under stress till Q1 of 2009, witnessed reduction in volatility and risk spreads in Q2 with rebound in activity in some market segments. Moderation in the pace of slowdown in real activity, better clarity in the rescue plans for the financial sector and on the extent of losses of some major banks, led to resumption of risk appetite and, hence, notable rally in stock prices in the advanced economies. Central banks across countries have continued with an easy monetary policy stance in Q1 2009, which has continued in Q2 2009. The well coordinated and concerted monetary measures by developed economies have begun to show results. Global credit spreads have tended to decline. There have been indications of moderation in negative growth rates in several countries, while growth in the credit to private sector has picked up. As per the Global Financial Stability Report, October 2009, the immediate outlook for the global financial system has improved markedly since its April 2009 outlook. 2.2 In this perspective, spread over six sections this chapter gives a bird’s eye view of global macroeconomic scenario in the Section 2. Section 3 analyses the global banking trends. Outlook on the global banking trends has been provided in the Section 4. Section 5 gives a brief description about the Indian Banking System in the global context followed by conclusion in Section 6. 2. Global Macroeconomic Scenario 2.3 The deterioration in the global outlook that started in the middle of 2008 continued through the second quarter of 2009, although signs of stabilisation have begun to emerge. According to the World Economic Outlook, October 2009 by IMF, the global economy has been projected to shrink by 1.1 per cent in 2009, a shade lower than the contraction of 1.3 per cent projected in April 2009 and 1.4 per cent projected in July 2009 update. The global economy is, however, projected to recover and expand by 3.1 per cent in 2010 (Table II.1). 2.4 The IMF's WEO October 2009 issue has projected real GDP of the US to shrink by 2.7 per cent in 2009, a slight deterioration from a contraction of 2.6 per cent projected in the July 2009 update of WEO. The main macroeconomic indicators continued to be adverse in Q2 of 2009 with the unemployment rate increasing to 9.3 per cent in June 2009 highest during last three decades. However, unprecedented monetary, financial and fiscal policy interventions are helping stabilise consumer spending and housing and financial markets, which points to renewed moderate growth in the second half of 2009. April-June 2009 output data of US shows the moderation in real GDP growth to decline of one per cent from decline in six per cent during first quarter of 2009. The outlook for the euro area is worse than that for the US. Euro area is expected to shrink by 4.2 per cent in 2009 and grow by 0.3 per cent in 2010 - an improvement of 0.6 per cent for both the years projected in July update of WEO. Improvement in growth prospects of euro area is mainly driven by the positive growth recorded by France and Germany. Measures of industrial production, consumption and export have improved in the second quarter of 2009. However, the recovery in the euro area may be subdued due to decline in private sector credit growth and rise in unemployment rate recorded during January-June 2009. Real GDP in Japan contracted by more than 10 per cent on an annualised basis in the two quarters following the Lehman Brothers bankruptcy in September 2008 due to the slump demand for durable goods faltered domestic demand, weakening labour markets, tightening financial conditions and rising spare capacity. However, subsequent data suggest that output is stabilising and consumer confidence is improving. The Japanese economy is projected to shrink by 5.4 per cent in 2009 before recovering by 1.7 per cent in 2010.
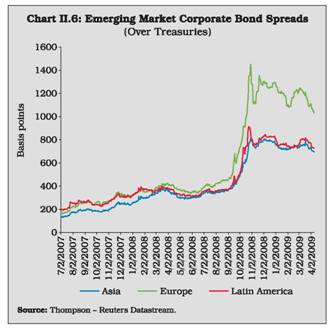
2.5 The IMF has projected the GDP growth of emerging and developing economies to decelerate to 1.7 per cent in 2009 from 6.0 per cent in 2008, before expanding to 5.1 per cent in 2010. The IMF, however, upgraded the growth outlook for developing Asia citing improved prospects in China, India and Asean-5 countries. In 2009 so far (up to July 2009), industrial production has picked up in a wide range of Asian economies. The most notable has been the strong recovery in China's industrial production following the very large increase in fixed capital investment by the public sector and strong credit growth. China has been able to at least partly neutralise the impact of contraction in exports by expanding domestic demand, especially Government investment demand. Industrial output in Korea and Taiwan also has recorded a significant upturn. 2.6 The October, 2009 issue of WEO further states that the global economy appears to be expanding again, pulled by the strong performance of Asian economies and stablisation or modest recovery elsewhere. A wide ranging public intervention has supported demand and lowered uncertainty and systemic risk in financial markets. The recovery is expected to be slow, as financial systems remain impaired, support from public policies will gradually have to be withdrawn, and households in economies that suffered asset price busts will continue to rebuild savings while struggling with high unemployment. International Financial Markets 2.7 The global financial markets had experienced one of the most severe shocks during the last couple of years. The global financial markets that remained under stress till Q1 of 2009, witnessed reduction in volatility and risk spreads in Q2 with rebound in activity in some market segments. The flow of new macroeconomic data indicating possible moderation in the pace of slowdown in real activity, better clarity in the rescue plans for the financial sector and on the extent of losses of some major banks, led to resumption of risk appetite and, hence, notable rally in stock prices in the advanced economies. The expected bottoming out of the slowdown in some of the EMEs and the global trends led to a quick rebound in the equity markets across these countries. The comfortable liquidity conditions in money markets along with the further reduction in the policy rates in some of the advanced economies led to continued moderation in the money market rates and restored a semblance of normalcy in the various segments of the market with narrowing spreads. The improving investor risk appetite towards the EMEs was reflected in the significant narrowing of bond spreads. The Government bond yields although moderated in response to ample liquidity in the system, the retreat from safe haven concerns and worries about the ballooning deficits and public debt led to hardening of the long-term bond yields. There has been signs of stabilisation in Q2 of 2009 and early part of Q3 2009 with rebound in activity in some of segments of international financial markets. A series of policy induced measures contributed to waning of market uncertainty and helped to stabilise the financial markets. These include further steps by the central banks to ease monetary conditions, the action plan of the G-20 announced in April 2009, publication of the specific rescue package plans for banks, particularly in the US and the UK, and the release of the results of US Fed’s bank stress-tests based action plan. 2.8 The EMEs, which showed considerable resilience in weathering the crisis up to September 2008, came under strain in the last quarter of 2008 through the spread of contagion mainly through three financial channels. The first was the exit of foreign portfolio equity investments, resulting in decline in stock markets which together with rapid decline in export demand, exerted significant pressures on the exchange rate. The second channel was the drying up of overseas lines of credit for banks and corporates, which shifted demand to the domestic credit market. Third, there was severe constraint on trade emanating from drying up of trade finance. Monetary policy actions by the EMEs, therefore, had to respond more to emerging problems of the real economy rather than financial sector problems. Credit Market 2.9 As per IMF’s estimates, the global credit crunch would be deep and long lasting as deleveraging accelerates in advanced economies with corresponding balance sheet adjustment till end-2010. The buildup of leverage that preceded the recent crisis was substantial. The current trajectories for UK, US and European Union appear to be similar to that of 1990s crisis in Japan (Chart II.1). IMF further estimates US and European private sector credit to contract at four per cent quarter on quarter annualised rate at its most negative reinforcing the deleveraging process (Chart II.2). Credit growth, while slowing remained in double digit (over year earlier levels) in many EMEs well in to the first quarter of 2009. In a number of EMEs, domestic bank credit remained stable or has been on an upward trend (Chart II.3) 2.10 In the credit market, investor risk tolerance increased in Q2 with US banks’ credit spreads declining upon public policy action and signs of stabilisation of markets EMEs. The spreads, however, continued to remain higher than the pre-Lehman level and weaknesses were evident in the asset backed securities (ABS) and commercial paper (CP) markets (Chart II.4). Corporate Bond Market 2.11 The corporate bond markets are functioning more normally in the US as reflected in the yield of corporate bonds, which increased significantly as compared to 3 months US Treasury bill as well as 10 year US Government bond yield during the Q1 of 2009. The gap has, however, narrowed down during late Q2 of 2009 (Chart II.5). 2.12 The emerging market corporate bond spreads (over Treasuries) also eased during early part of 2009. The spreads, however, continued to remain higher than the pre-Lehman level and weaknesses were evident in the ABS and CP markets. Improving outlook for defaults was reflected in narrowing CDS spreads in Q2 of 2009 across the developed markets (Chart 11.6). Stock Markets 2.13 The year 2008-09 was characterised by depressed equity valuations. Equity price indices in several advanced and emerging economies witnessed large corrections in the range of 30-66 per cent (Table II.2). The volatility in the markets during the year was high as the international equity markets oscillated between hope and despair - hope that the policies will succeed in stimulating the economies and despair that the problems during the current financial crisis continue to manifest themselves. However, the equity market have witnessed surge during 2009-10 so far (April–August) in emerging as well as developed countries. Indonesia, India, Russia, Singapore, Thailand led the emerging countries which experienced the surge in their equity market more than 50 per cent since end-March 2009.
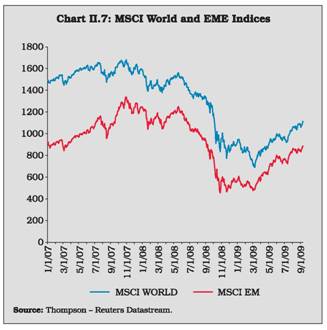
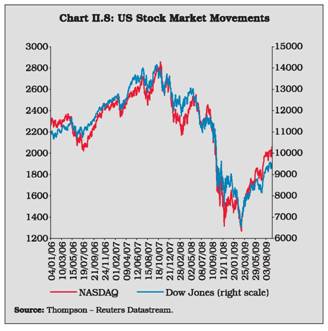
2.14 The equity markets in developed countries as well as EMEs witnessed perceptible recovery since March 2009, with intermittent decline on negative news. Although activity in most economies continued to remain weak with declining output, markets rallied on the macroeconomic data that indicated moderation in the pace of deterioration in economic activity and some early indications of bottoming out in some economies. Most of the developed markets have registered increase in indices to the tune of more than 25 per cent during April-August 2009. MSCI Emerging market indices and MSCI World has recorded increase of 47.3 per cent and 34.8 per cent, respectively, during the same period (Chart II.7) US Stock markets also witnessed noticeable recovery in post-March 2009 (Chart II.8). The rally in the stock markets was somewhat broad-based covering financials, industrials and consumer durables, underpinned by improved corporate earnings expectations and reduction in uncertainty in the financial sector due to clear public policy actions. Foreign Exchange Market 2.15 The US dollar generally appreciated against most of the currencies, except Japanese Yen and Chinese Yuan, during 2008-09. The US dollar commenced the year on a weak note, exhibiting depreciating trend against most of the currencies during April-July 2008 due to factors such as slowing growth, lowering consumer confidence, weaker equity markets and downward nonfarm payroll employment. However, from early August 2008, the US dollar started strengthening mainly on account of decline in the risk appetite of the US investors induced by the financial crisis in the US resulting in liquidation of their positions in overseas equity and bond markets as part of ongoing deleveraging process in the financial markets and repatriation of the proceeds back to the US on flight to safety considerations. During 2009-10 so far, the appreciating trend has been reversed because of declining safe haven flows to the US, large-scale quantitative easing undertaken in the US in the recent period and change in the market sentiment against the dollar. Between end-March 2009 and end-August, 2009, the US dollar depreciated by 6.8 per cent, 12.2 per cent and 5.5 per cent against the euro, the pound sterling and the Japanese yen, respectively. Among the Asian currencies, it depreciated against the Indian rupee, Indonesian rupiah, Malaysian ringgit, South Korean won and Thai baht. Over-the-Counter Derivatives 2.16 In the second half of 2008, the financial crisis resulted in a decline in the total notional amounts outstanding of Over-the-Counter (OTC) derivatives to US$ 592 trillion at end-year, an indication of reduced market activity. This is the first decline since 1998. Foreign exchange and interest rate derivatives markets both recorded their first significant contractions (Table II.3). 2.17 Despite the drop in amounts outstanding, significant price movements resulted in notably higher gross market values, which increased to US$ 34 trillion at end-2008. Gross market values, which measure the cost of replacing all existing contracts, can be used to capture derivatives related exposures. The higher market values were also reflected in gross replacement costs after taking into account bilateral netting agreements, also referred to as gross credit exposures, which grew by nearly one third to US$ 5 trillion. The market for interest rate derivatives contracted for the first time in the second half of 2008, with notional amounts outstanding of these instruments falling to US$ 419 trillion. Nonetheless, declining interest rates resulted in almost a doubling of the gross market value. The gross market value of interest rate swaps, by far the largest market segment, reached US$17 trillion. The most significant increase took place in the US dollar swap market, where the gross market value nearly tripled. 2.18 Notwithstanding the improvement in global financial markets, the international financial system still remains fragile on account of heavy dependence on the public support, rising concerns emanating from mounting debt burden of countries, and the lack of clarity about the future exit strategies from monetary easing and fiscal support. 3. Global Banking Trends 2.19 Some of the possible factors behind the current global financial crisis may be traced in to the deeply flawed institutions and practices of New Financial Architecture (NFA) – a globally integrated system of giant bank conglomerates and the so-called ‘shadow banking system’ of investment banks, hedge funds and bank- created Special Investment Vehicles. These institutions were lightly regulated an arrangement of financial economics theory of efficient capital markets. The NFA has generated a series of ever-bigger financial crises that have been met by larger and larger Government bailouts.
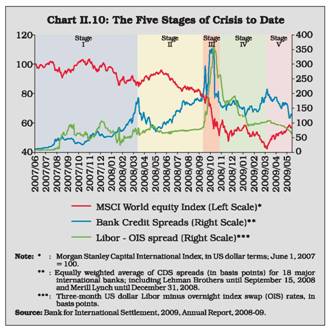
2.20 Some of the structural flaws of this architecture may be described as: 1) regulators have accepted very weak and seriously misleading the theoretical foundation of the NFA i.e. efficient capital market; 2) in built moral hazard problem due to incentives embedded in the NFA which led to the excessive risk-taking in the financial markets; 3) some of the innovative financial products like mortgage-backed securities were so complex and non-transparent that they could not possibly be priced correctly and they collapsed once the excessive optimism of the boom faded; and 4) the NFA generated high leverage and high systemic risk, with channels of contagion that transmitted problems in the US subprime mortgage market around the world. 2.21 Overall, the above mentioned factors reflect the greater role played by large investment banks, institutional investors, and other financial institutions, as well the extensive use of securitisation. The loss of capital valuation of financial assets world-wide may have reached well over US $ 50 trillion. This loss in capital stock has been very significant, amounting to about equivalent of one year of world GDP1. Global Financial Crisis: Evolution and Stages 2.22 Deregulation allowed financial assets to grow more rapidly than the real sector in the US starting in the early 1980s, a process accelerated by the stock market boom in the second half of the 1990s, the mortgage-housing boom that began in the late 1990s, and the rapid pace of financial innovation in the past decade. Following a recovery from the chaos of the 1980s, financial sector profits relative to GDP grew rapidly from the early 1990s through the end of the decade, then took off after 2002. 2.23 The recent global financial crisis which surfaced in second half of 2007, may be usefully characterised in terms of five stages viz. (1) the prelude, leading up to the March 2008 takeover of Bear Stearns; (2) the gradual deterioration in financial conditions from mid-March to the failure of Lehman Brothers on 15 September 2008; (3) from mid-September to late October, a global loss of confidence, a massive flight to quality and the near collapse of the financial system; (4) from late October, the severe decline in the global economy; and (5) beginning in mid-March 2009, the deepening downturn and the first signs of stabilisation (Box II.1) and (Chart II.10). Bank Profitability 2.24 The profitability of banks plunged last year owing to the realisation of losses on marked to market (securities) portfolios and the progressive deterioration of loan books as the economic slump deepened. Although the decline in bank profits was a global phenomenon, the way banks have been affected by the crisis has differed somewhat according to the circumstances in their respective home markets. 2.25 Banks in the United States saw their pretax profits in 2008 more than halved compared with the previous year (Table II.4). The full-year results, however, conceal the sharp deterioration in the second half. For example, one in three US banks lost money in the fourth quarter, and the sector as a whole recorded its first quarterly loss since 1990. Net interest margins also came under pressure, especially for smaller banks that found it hard to reduce their deposit rates. There was a surge in US bank failures in 2008. A total of 25 deposit-taking institutions failed, with combined assets of US$ 372 billion, about 10 times higher than during the previous peak in bank failures in 1993. The failure of Washington Mutual accounted for US$ 307 billion of the total and was the largest US bank failure in history. Besides the failed banks, the number of institutions on the US deposit insurer’s list of problem banks swelled to 252 with total assets of around US$ 159 billion. Further large failures were averted as weakened institutions were acquired by others with healthier balance sheets. 2.26 In Europe, the general picture of bank performance in 2008 was broadly similar to that in North America. Profits plummeted across the board, and as a group the largest banks in the Netherlands, Switzerland and the United Kingdom registered a net loss. The size of the earlier residential property boom in Ireland, Spain and the United Kingdom posed an especially large challenge to banks in those countries once real estate markets slowed. Certain German banks were also affected by real estate exposures, albeit mainly indirectly through securities positions and exposures to commercial property. French and Italian banks were less affected by losses on structured finance investments, given their stronger focus on the domestic retail market. The profitability of Japanese banks remained poor, partly because of their structurally narrow net interest margins. Consequently, their capital base remained weak. Composition of Bank Losses 2.27 As the macroeconomic situation worsened over the course of the past year, institutions faced increasing pressure on earnings and mounting losses on their credit risk exposures. The shifting composition of bank losses reflected the evolution in the character of the problems confronting the industry. During the first stage of the crisis, write downs were closely linked to traded portfolios of structured finance products and securitised exposures to the subprime mortgage market. Losses were exacerbated by illiquidity in the markets for those instruments, which led to substantial reductions in their marked to market valuations (Table II.5). While there was considerable uncertainty about the magnitude of the losses and their distribution across the system, they were perceived as being contained within a certain class of assets. 2.28 The general economic slowdown that ensued in the later stages of the crisis, in particular after the global crisis of confidence in September and October 2008, meant that bank losses became more closely connected to macroeconomic performance. In this period, the majority of write downs were more directly linked to a surge in borrower defaults and to anticipated defaults as evidenced by the increase in the amount and relative importance of provisioning expenses. Loan loss provisions as a fraction of bank assets were universally higher in 2008 than in previous years (Table II.5). Compared with 2007, the rate at least doubled for Australian, French, Swiss and US banks and jumped even higher in the case of German, Dutch and Swedish lenders. Credit costs are likely to continue on an upward trajectory as weakening economic activity will probably impair the private sector’s ability to service debt. Rating agencies expect corporate default rates to increase further. In addition, the performance of banks’ household credit portfolios will depend on the length and depth of the contraction in incomes. Initial signs of problems in US banks’ credit card portfolios indicate a stronger pass-through from unemployment to delinquencies than that suggested by historical experience. The close interdependency between financial sector performance, the supply of credit and the debt servicing capacity of borrowers implies greater uncertainty in the overall outlook for banks.
2.29 Modern financial system is immensely complex, where interconnections create systemic risks. The financial system is based on trust, and in the wake of the Lehman failure that trust was lost. Over the past few years, this essential and complex system of finance has been critically damaged. Evidence of serious trouble emerged when banks became less willing to lend to each other, because they were no longer sure how to value the assets held and the promises made – both their own and those of potential borrowers. For a time, central bank lending was able to fill the gap. But from August 2007 the stress in the financial system increased in waves. By March 2008, Bear Stearns had to be rescued; six months later, on September 15, Lehman Brothers went bankrupt; and by the end of September, the global financial system itself was on the verge of collapse. 2.30 While financial institutions in the US are at the heart of the problem, European banks face strikingly similar problems which shows how deeply interconnected national financial systems have become. European banks have been hit nearly as strongly as their American peers by losses from subprime mortgage investments, leveraged loans, failed financial hedges and, increasingly, by a surge in conventional credit losses. As per an estimate, banks on both sides of the Atlantic so far have had to cope with combined write-downs of more than US$ 1 trillion in this crisis; they may even have to take US$ 1.3 trillion more (Annex II.1). 2.31 Emerging countries have been increasingly integrated with the global financial markets but they have not developed the same complex financing structures as those in the US, but several countries have already suffered from severe external imbalances, caused by fiscal imbalances and/ or over-extended banking systems. These countries have become particularly vulnerable, as the crisis is transmitted through financial and trade channels (Table II.6). However, the specific channels of transmission may differ significantly across countries. The basic structure of the financial system is not expected to change significantly, as banks still play a dominant role and capital markets are generally less developed. 2.32 As per the BIS, in the wake of the failure of Lehman Brothers in mid-September 2008, the international banking trends are characterised by the following aspects:
2.33 Apart from monetary and fiscal stimulus measures countries implemented a wide range of crisis-management policies relating to the financial sector. Critical actions included the establishment of creditor protection programs and the injection of capital in banks (Appendix Table II.1). Additional actions included measures to address the deteriorating assets of the banks. The objective of policy measures evolved over the course of the crisis from an early emphasis on containment to subsequent restructuring and asset management. 2.34 In response to the crisis, since it intensified following the collapse of Lehman Brothers in September 2008, so far, policy responses by central banks and Governments to help money markets and financial institutions have been manifold and massive. Featured among them are monetary policy measures like liquidity injections, policy rate cuts, and changes to the structure of the financial safety net, such as increases in guarantees of private deposits and guarantees for bank loans or debt. While Central Banks across countries have continued with an easy monetary policy stance, financial sector rescue programmes have been undertaken by the Governments in advanced economies to provide support to banks and financial institutions, through both standalone actions directed at individual institutions and system-wide programmes. Governments became crucial during the crisis, as traditional sources of funding for financial institutions dried up. The measures introduced have consisted of: (i) capital injections to strengthen banks’ capital base; (ii) explicit guarantees on liabilities to help banks retain access to wholesale funding; and (iii) purchases or guarantees of impaired legacy assets to help reduce banks’ exposure to large losses. Measures have also included the establishment of funds to purchase commercial paper or mortgage bonds, and regulatory changes like bans or restrictions on short-selling. The objective of such intervention was to avoid widespread bankruptcies of financial intermediaries and to contribute to restoring a normal functioning of financial intermediation (Box II.2). 4. Outlook of the Global Banking System 2.35 The banking sector is undergoing significant changes as a result of the financial crisis. It is expected to become a less “fashionable” and even more heavily regulatedindustry with greater state involvement, increased investor scrutiny and substantially higher capital levels. This may lead to lower growth, lower profits and lower volatility for banks than during the past few decades – a trend that may be exacerbated in the medium term by the expected lack of major growth drivers. According to analysts, following the financial crisis, the global banking outlook is perceived to be uncertain. In the short-term, the outlook seems to be grim while the drivers for the long-term prospects show some sign of incipient recovery (Box II.3). Especially US banks might well face lean years due to low loan growth, higher credit losses and weaker revenues from capital-market activities. Secondly, while consolidation in banking may continue, there could be a possible reorientation towards domestic markets rather than financial globalisation and market integration. Thirdly, a more general effect could be the vast destruction of confidence in banks and of their reputation. Given that the demand for banking services is relatively inelastic even though this may not have adverse consequences in the short run in the longer run, banks could feel strong negative repercussions. It will, therefore, be one of the greatest challenges for banks – apart from adjusting to a profoundly changed business environment – to repair their public reputation as soon as possible and regain the trust of clients, policymakers and the general public. 5. Indian Banking in the Global Context 2.36 Keeping in view the global developments, and the diverse channels of transmission, the developments in Indian banking needs to be analysed. Table II.7 provides Indian banking trends in the context of cross-country set up. In a cross-country perspective, although Indian banking sector has displayed healthy trends, the significant aspect is that India has so far never witnessed a banking crisis. Some of the reasons for India’s insulation are: (1) the nascent stage of development of the credit derivatives market; (2) regulatory guidelines on securitisation do not permit immediate profit recognition; (3) perseverance of prudential policies which prevent institutions from excessive risk taking and financial markets from becoming extremely volatile and turbulent; and (4) close co-ordination between supervision of banks and their regulation. Box II.2: Financial Sector Rescue Programme - An Assessment The magnitude of the actions taken to support the banking system as a fall out of the global financial crisis has been unprecedented. As per a BIS estimate, the overall amount of resources committed to the various packages by eleven countries (namely, Australia, Canada, France, Germany, Italy, Japan, the Netherlands, Spain, Switzerland, the United Kingdom and the United States) totalled around euro 5 trillion or 18.8 per cent of GDP; the outlays have been euro 2 trillion or 7.6 per cent of GDP. The size of the interventions varies greatly across countries: it is higher in countries such as the United Kingdom and the Netherlands, where outlays have reached 44.1 per cent and 16.6 per cent of GDP, respectively). In these countries the banking system is large relative to the real economy and is dominated by large institutions that have been severely hit by the crisis. It is lower in countries such as Japan (0.1 per cent of GDP) and Italy (0.6 per cent) where banks are more focused on traditional credit activities and so far have been less affected by the crisis. Actions for addressing capital shortages and funding difficulties have been widespread and have mostly taken the form of system-wide programmes. Measures for improving the quality of bank assets have been less common and have mainly targeted individual large institutions. However, some of the most recent initiatives include comprehensive schemes for dealing with illiquid or “bad” assets. Among banks that participate in both recapitalisation and debt guarantee programmes, the intermediaries that have received more capital in relation to shareholder equity have also issued more liabilities under guarantee (in relation to total liabilities). Moreover, most instances of asset purchase/guarantee occurred after earlier capital injections, suggesting that this option was used after a first phase of Government support failed to fully restore confidence in troubled institutions. The average uptake rate by eligible institutions (i.e, the ratio of outlays under a given programme to total commitments) is higher for capital injections (around 50 per cent) than for debt guarantees (less than 20 per cent). The United Kingdom has the highest participation rate for both capital injections and debt guarantees, possibly reflecting the relatively small number of major banks and the tailoring of Government programmes to their needs. Governments around the globe have had to intervene to prevent a wholesale collapse of the financial system. They have injected more than US$ 200 billion in fresh capital into the top 20 banks alone besides the much larger asset and debt guarantees. It is clear that the developed countries’ banking sectors to a large extent now depend on massive Government support. If the immediate value destruction in the global banking industry seems large, the scale of the challenges ahead is even bigger in terms of loss in GDP. The effects of the financial sector rescue measures can be summarised as follows:
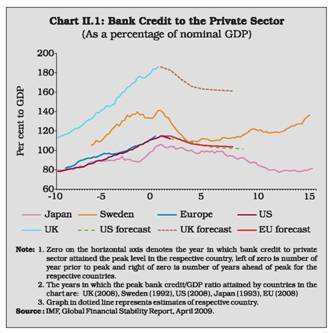
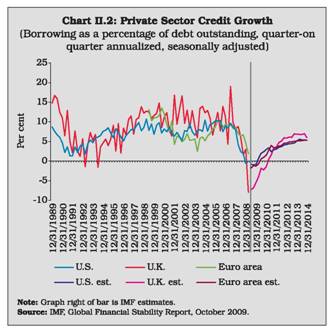
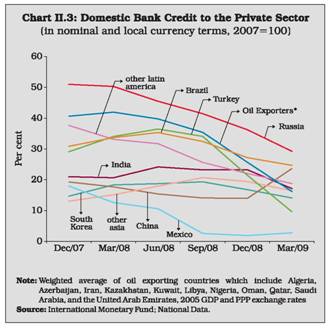
Important perceptions are emerging from these developments. First, Government intervention has not been sufficient, at least so far, to trigger a “virtuous circle” for banks, such as a mutually reinforcing increase in capital and borrowing on the one hand and lending and profits on the other. For example, between the first and the second quarter of 2009, the portion of overall bank funding provided or guaranteed by Governments sharply declined. Secondly, the rescue measures have been effective in stabilising the financial system, but this has come at a price, represented by distortions and inefficiencies. This is an example of the trade-off that exists between the stability and the efficiency of the financial system. Reference Bank for International Settlements (2009), An assessment of financial sector rescue programmes, BIS Paper 48, July.2.37 Other significant differences can be noted between the global and Indian banking trends. One significant aspect is that unlike other countries where the adverse loop operated from the financial to real sector, in India the banking sector has got an impact from the real sector. Secondly, the fact that so far, financial sector reforms have been calibrated with a progressive integration into the world economy has paid us rich dividends. A key consideration in the choice of pace and sequencing has been the management of volatility in financial markets and implications for the conduct of monetary operations. The nuanced approach to financial sector reform has served India well with an accent on conscious gradualism in the implementation of coordinated and sequenced moves on several fronts. What have been ensured are appropriate safeguards to ensure stability, while taking account of the prevailing governance standards, risk management systems and incentive frameworks in financial institutions in the country. Overall, these progressive but cautious policies have contributed to efficiency of the financial system while sustaining the growth momentum in an environment of macroeconomic and financial stability. The policy challenge is to continue to ensure financial stability in India during this period of international financial turbulence, while achieving high growth with price stability. Box II.3: Global Banking Outlook after the Financial Crisis - Perspectives from Deutsche Bundesbank Research The near-term prospects for US and European banks are apper to be grim with the global financial crisis bringing about significant changes to their operating framework. Growth and profitability of the banking sector as a whole are likely to decline with fundamental re-regulation of the industry, ownership structures shifting towards heavier state involvement and investor scrutiny rising strongly. Equity ratios will be substantially higher. Lacking major growth drivers: As of US banks, performance improvements during the last 15 years have been mainly due to strong lending growth and low credit losses. As private households reduce their indebtedness, revenue growth in some European countries and especially the US may remain depressed. With weak loan growth and a return of higher loan losses as well as a diminished importance of trading income and modern capital market activities such as securitisation, banks may be lacking major growth drivers. Consolidation may continue but with a different focus: While a considerable number of deals may be there, transaction volumes are likely to decline and restructuring rather than strategic Merger and Acquisition (M&A) may dominate. The probability of domestic deals has increased, while that of cross-border mergers has declined. Internationalisation of European banks likely to slow : Uncertainty about the future prospects especially of foreign markets and strictly national banking sector stabilisation programmes are triggering a re-orientation towards domestic markets. This is more relevant for European banks that have greatly expanded into other European countries recently, while American banks overall may continue to target the national market rather than going abroad. Following are the long term outlook on revenue and profit developments :
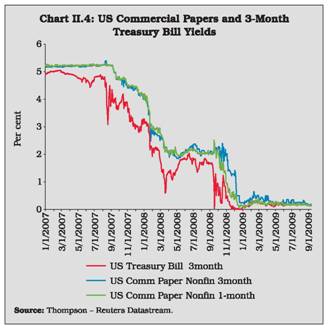
Reference: Deutsche Bank Research (2009), Global banking trends after the crisis, June, www.dbresearch.com
2.38 Government and central banks continued to provide direct support to the financial sectors. However, while support measures have been large, immediate impacts on Government financing needs have been limited as guarantees do not require upfront Government financing, and institutions providing other support are generally outside the Government sector. Upfront Government financing needs connected with financial support operations are estimated to be 5.5 per cent of GDP for the advanced G-20 countries and 0.4 per cent of GDP for the emerging G-20 countries (Table II.8). Financial sector support provided by Governments so far has generally been considerably less than originally announced. This outcome appears to reflect a variety of factors including the precautionary nature of initial announcements, indications of increasing stability and improved bank liquidity, and lags in implementation of programs for recapitalisation and purchase of assets. Central bank credit facilities appear also to have been taken up only to a limited extent in many countries, as conditions have turned out to be less dire than expected at the time of their announcement.
6. Conclusion 2.39 Notwithstanding critical financial sector rescue programme, which has its relative success as well as distortionary effects, the outlook on future global banking remains difficult being devoid of major structural growth drivers. Despite not being part of the financial sector problem, India has been affected by the crisis through the feedback loops between external shocks and domestic vulnerabilities by way of the financial, real and confidence channels. Impact on Indian banking, however, has been rather muted providing a relatively bright outlook way ahead if Indian banking can reap the structural drivers from within. 1 Loser, Claudio M (2009), Global Financial Turmoil and Emerging Market Economies: Major Contagion and a Shocking loss of Wealth?, Asian Development Bank. |
|||||||||||||||||||||||||||||||||||||||||||||||||||||||||||||||||||||||||||||||||||||||||||||||||||||||||||||||||||||||||||||||||||||||||||||||||||||||||||||||||||||||||||||||||||||||||||||||||||||||||||||||||||||||||||||||||||||||||||||||||||||||||||||||||||||||||||||||||||||||||||||||||||||||||||||||||||||||||||||||||||||||||||||||||||||||||||||||||||||||||||||||||||||||||||||||||||||||||||||||||||||||||||||||||||||||||||||||||||||||||||||||||||||||||||||||||||||||||||||||||||||||||||||||||||||||||||||||||||||||||||||||||||||||||||||||||||||||||||||||||||||||||||||||||||||||||||||||||||||||||||||||||||||||||||||||||||||||||||||||||||||||||||||||||||||||||||||||||||||||||||||||||||||||||||||||||||||||||||||||||||||||||||||||||||||||||||||||||||||||||||||||||||||||||||||||||||||||||||||||||||||||||||||||||||||||||||||||||||||||||||||||||||||||||||||||||||||||||||||||||||||||||||||||||||||||||||||||||||||||||||||||||||||||||||||||||||||||||||||||||||||||||||||||||||||||||||||||||||||||

Share this page:


Install the RBI mobile application and get quick access to the latest news!
Scan the QR code to install our app


Page Last Updated on:


