 IST,
IST,
Global Banking Developments
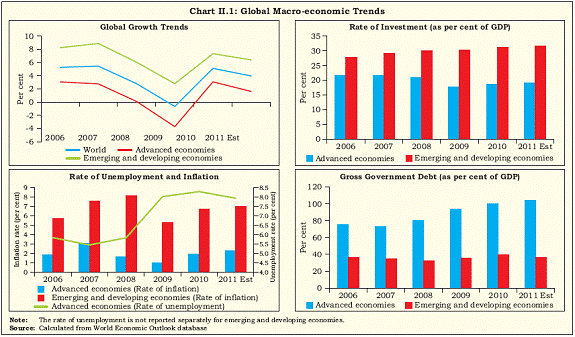
The year 2010, and 2011 so far, has been a difficult period for the global banking system, with challenges arising from the global financial system as well as the emerging fiscal and economic growth scenarios across countries. The Global Financial Stability Report in September 2011 has cautioned that for the first time since October 2008, the risks to global financial stability have increased, signaling a partial reversal in the progress made over the past three years. Banking systems in advanced economies have continued to be on uncertain grounds on account of a lacklustre economic revival and increasing sovereign credit strains. The US, despite riding on the QE2 wave, has witnessed its economic recovery losing steam and has experienced a downgrading of its sovereign. The US banking system, which showed signs of improvement in credit growth and profitability in 2010, now faces a serious question about whether this revival in the banking system would continue in the near future. The banking system in the Euro zone, as a whole, stands vulnerable to mounting credit, market and funding risks as a result of severe deterioration in public finances in certain European countries. Further, many of these banks require recapitalisation to cushion them from the risk of sovereign defaults. In the UK too, banking system continues to be beleaguered by high leverage and weak asset quality. In major emerging economies, credit growth has been at relatively high levels and is being regarded as a cause of concern given the growing inflationary pressures and increasing capital inflows. Further, concerns are also being expressed about the credit growth laying foundations for a weak asset quality in the years to come. On the positive side, both advanced and emerging economies, individually, and multi-laterally, have moved forward towards strengthening macro-prudential oversight of their banking systems. While it is important to keep up efforts towards strengthening the banking system from within, it is also equally important to develop effective solutions for containing fiscal and economic risks, which at the present juncture, threaten the stability of the global banking system from without. All such solutions need to be designed keeping in mind the larger interests of the global economy. 1. Introduction 2.1 For the global economy, the year 2010 was replete with a mixed sense of optimism and concerns. The optimism was attributed to a somewhat encouraging ‘two speed’ recovery, in advanced and emerging economies, after a major slump in economic growth in 2009 following the financial crisis. The concerns, however, were on account of escalating sovereign risks in the Euro zone and heightened inflationary pressures marked by uncertainty in the Middle East and North Africa (MENA) region. The beginning of 2011 has seen the optimism giving way to greater concerns on account of a projected slowdown of the global economy in general, and the US economy in particular, for 2011. Further, sovereign risks have strengthened even in the US with an increase in sovereign debt ceiling along with a downgrading of the rating of the US sovereign by the credit rating agency of Standard and Poor’s. 2.2 In this milieu, the performance of the global banking system too has been characterised by a mixed bag of a few positive developments and a number of shortfalls. The positive developments have been in terms of the efforts by countries towards revamping their regulatory and supervisory architecture learning from the crisis, along with an effort to step up capital adequacy of banks. The major shortfalls, however, have been the lack of a widespread revival of the global banking activity, which could be characterised by improved credit growth, profitability and asset quality, and lower leverage. 2.3 Against this setting, this chapter analyses the performance of the global banking system using major indicators of banking activity and soundness for select advanced and emerging economies. It also looks into the detailed individual performance of the banking systems in few advanced and emerging economies/ economy-groups. Finally, at the institutional level, it analyses the performance of the top-100 banks having major global presence. It then highlights the major regulatory and supervisory policy initiatives with regard to the global banking system during the year. 2. Global Banking Trends 2.4 The current global macro-economic situation is characterised by an unbalanced economic recovery across advanced and emerging economies, moderation in economic prospects in 2011, high levels of unemployment and inflationary pressures, and elevated levels of government debt (Chart II.1). Macro-economic risks have increased substantially 2.5 In its September 2011 World Economic Outlook, the International Monetary Fund (IMF) has estimated a growth of 4.0 per cent for the world economy as a whole during 2011, with emerging and developing economies growing at 6.4 per cent and advanced economies growing only at 1.6 per cent. The estimate for advanced economies of 1.6 per cent provided in September 2011 was lower than the estimate of 2.2 per cent provided in June 2011 in light of the lower quarterly GDP growth of leading advanced economies. The rate of unemployment in advanced economies has been little over 8 per cent in 2010 albeit with some moderation expected in 2011 as per the IMF estimates. Inflationary pressures, which had become stubborn in 2010, more so for emerging economies as a fallout of rising oil, food and commodity prices, are expected to aggravate further in 2011.
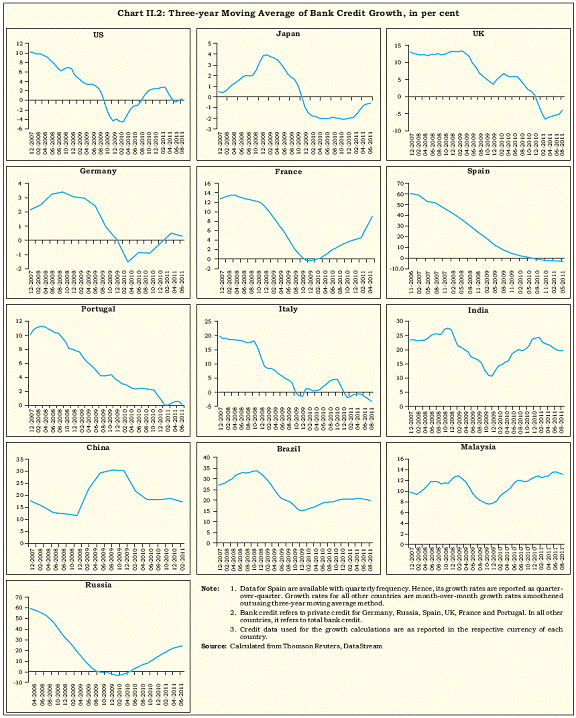
Uncertainty about credit revival continues 2.6 Against the macro-economic backdrop discussed in the foregoing section, banking business in some advanced economies showed signs of revival in 2010. An increase in the growth of bank credit was evident in the US, Germany and France in the first quarter of 2011 after entering into the negative growth zone after the crisis. However, there is an uncertainty about whether this credit revival would continue or not, given the picture of economic revival looking bleak in the US and now, even in Germany1. In fact, credit growth has again witnessed a slump in the second quarter of 2011 in the US. In the UK and Japan, bank credit growth, which had entered a downtrend since the beginning of 2009, has shown a recovery in 2011, but has remained in the negative zone. Other advanced economies from Europe, particularly countries with fiscal strains, namely Portugal, Spain and Italy, showed a steep fall in the growth in bank credit with no signs of revival by 2011 (Chart II.2). Return on Assets showed a moderate increase 2.7 Apart from the pickup in credit growth, Return on Assets (RoA), an indicator of banking system’s profitability and soundness, also showed a moderate increase in the US and France in 2010 (Table II.1). The RoA of US banks turned positive by 2010 after staying in the negative zone in 2008 and 2009; it showed a further increase in 2011 (March). In Russia, China and Malaysia, RoA of the banking system, which had dipped between 2008 and 2009, recovered between 2009 and 2010. In Russia and Malaysia, the trend of increase in RoA continued even in 2011 (March). The RoA of Indian banks too showed a modest rise between 2008 and 2010.
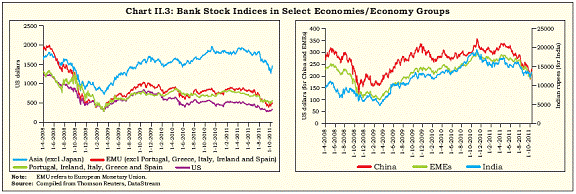
Disappointing performance of bank stocks 2.8 Changes in bank stock indices, which are generally associated with changes in balance sheet and profitability growth of banks, were globally on a path of slow recovery since the beginning of 2009. In the US, there was an upward movement in the prices of bank stocks but this was within a narrow range, reflecting weak confidence of investors in these stocks (Chart II.3). Moreover, there was a striking downtrend in bank stocks in the US since the beginning of 2011. A similar downtrend could also be seen in bank stocks of the fiscally strained economies. In EMEs as a whole, and in China, bank stock indices moved upwards very slowly since the beginning of 2009. Among EMEs, the upward movement in bank stocks since the beginning of 2009 was significant for India, resulting in the index overshooting its precrisis mark by the end of 2010.
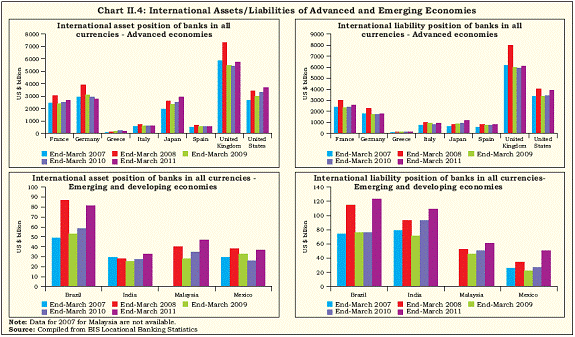
Revival in international banking business 2.9 In 2010-11 (March), there was considerable revival in international banking business (by location of reporting banks) continuing with the trend in 2009-10. During 2008-09, international assets and liabilities of banks had contracted significantly in the aftermath of the financial crisis (Table II.2). 2.10 In most advanced countries, the quantum of international assets and liabilities (in all currencies vis-à-vis all sectors) also showed a similar trend of increase between end-March 2010 and end-March 2011 (Chart II.4). Among advanced countries, the increase in international business was most striking for banks located in the US and UK. Even in the emerging economies, the increase in international banking business gained considerable momentum by the first quarter of 2011. Latin American banks increasingly resorted to the issuance of securities, leading to a sharp growth in the international liabilities of these banks. Financial soundness of banks 1. Increase in levels of capital adequacy 2.11 The level of capital adequacy across banks in most advanced economies was on a steady rise between 2008 and 2010 (Table II.3). By 2010, in the UK, US, Japan and Germany, Capital to Risk-weighted Assets Ratio (CRAR) was placed above 15 per cent. The ratio showed a further increase for US and German banks in the first quarter of 2011. Among the major emerging economies, however, the level of capital adequacy showed a moderate decline between 2009 and 2010, with the exceptions of China, India and Mexico. Both Mexican and Chinese banks showed a moderate decline in their capital positions by March 2011.
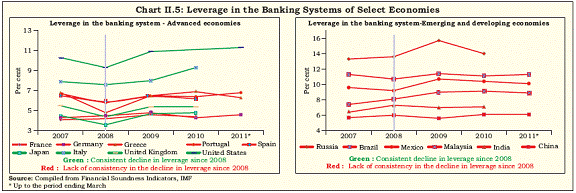
2. Uneven decline in leverage 2.12 There was unevenness in the decline in banking sector leverage across countries after the crisis; here, the percentage of total capital (and reserves) to total assets has been taken as an indicator of leverage in the banking system2. In the US, leverage in the banking system showed some moderation between 2008 and 2010 (Chart II.5). This trend for US banks continued further in the first quarter of 2011. A moderation in leverage could also be seen for UK banks between 2008 and 2010. Notwithstanding this moderation, the extent of leverage for UK banks continued to be at relatively high levels. Deleveraging had not gained any significant momentum in the banking systems of other advanced European economies, viz., France, Germany, Portugal, Greece and Spain, treating 2008 as the reference point.
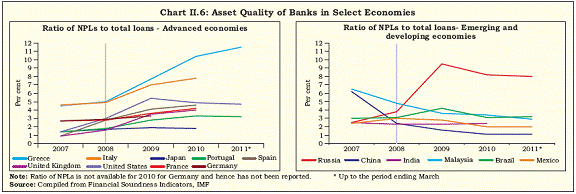
2.13 In major emerging economies, banking systems were generally less leveraged than most advanced economies. Moreover, the banking systems in these economies did not show signs of any perceptible increase in leverage during the crisis period. However, treating 2008 as the reference point, in many emerging economies, there was an increase in the leverage of their banking systems in the post-crisis period. The Global Financial Stability Report (GFSR) (September 2011) has in fact highlighted releveraging as a major concern for banking systems in emerging economies. 3. Weakening asset quality 2.14 Globally, there was little improvement in the asset quality of banks since the onset of the financial crisis. According to the GFSR (September 2011), credit risks have risen and continue to be the key potential risk to global financial stability. The Report went on to add that improvements in credit risks had lagged behind improvements in the real economy. There was a trend of increasing Non-Performing Loans (NPLs) ratio across most advanced economies between 2008 and 2010 with the exception of the US. In the US, there was a moderate improvement in asset quality between 2009 and 2010, which continued in the first quarter of 2011 (Chart II.6). In complete contrast to advanced economies, many of the major emerging economies showed considerable improvement in asset quality in the years following the crisis. Asset quality remained particularly robust in China.
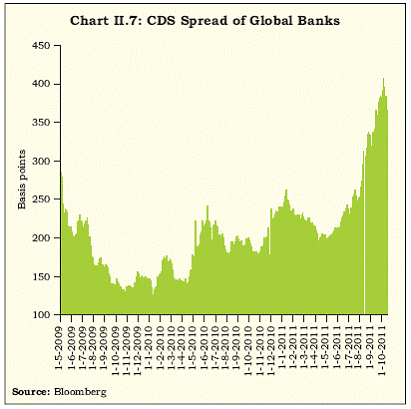
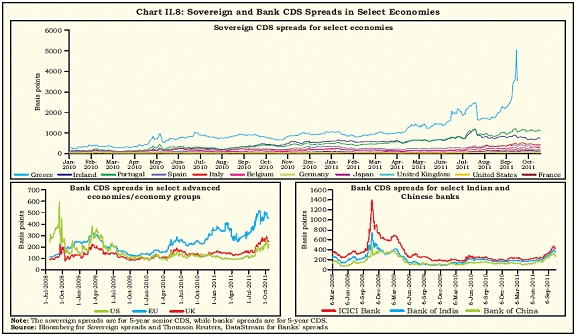
Rising CDS spreads indicating hardening risk perceptions 2.15 CDS spreads of global banks during 2010- 11 have been, in general, on the rise with intermittent periods of fall (Chart II.7). During 2011, CDS spreads fell till mid-April and rose subsequently. With solvency of sovereigns coming into serious question in the recent months, particularly for some Euro zone countries, CDS spreads of global banks have been on a rise with the increase in risks associated with sovereign debt. In the case of Greece, the sovereign CDS spreads had shot up to very high levels up to September 15, 2011, reflecting the severe elevation in sovereign risks (Chart II.8).
2.16 Across countries, bank CDS spreads had hardened significantly during September 2008 (Chart II.8). The spreads softened in the following months and continued to be low in 2010 and first half of 2011 across most advanced and emerging economies, except in the Euro zone. However, not just in the Euro zone but also in other parts of the world, CDS spreads for banks have been on a rise in the third quarter of 2011.
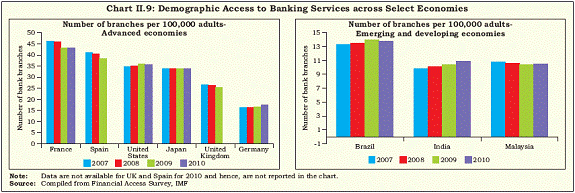
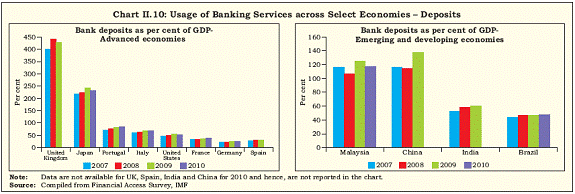
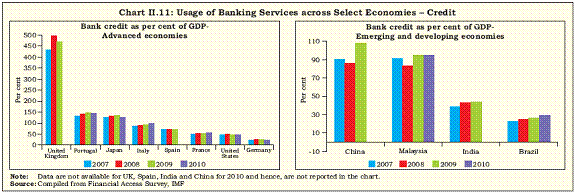
Trends in access and usage of banking services Possibility of an increase in financial exclusion following the crisis 2.17 Financial inclusion has become an important part of the banking policy in both advanced and emerging economies in the recent years. Moreover, it has attained centre stage particularly after the financial crisis. This is because there have been concerns about the possibility of an increase in financial exclusion following the crisis, particularly in the advanced economies. Recent data from the World Bank on the access and usage of banking services suggest that these concerns have not been misplaced. There was a contraction in the access to banking services in many of the advanced economies affected by the crisis, resulting from a closure of bank branches (Chart II.9). As noted in the report on “Financial Access” by the World Bank, slowing down of economic growth made an impact on the retail infrastructure in many advanced economies and bank branches were one of the causalities of this impact3. There was also a decline in usage of banking services. The decline in the usage of banking services was more striking in the advanced economies. The decline was more pronounced and widespread with regard to usage of credit services as compared to deposit services (Charts II.10 and II.11).
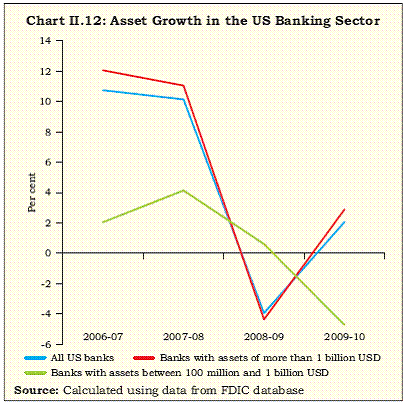
3. Banking Trends in Select Regions and Countries US banking system – Signs of a weak recovery 2.18 In 2010, the performance of the US banking system showed signs of recovery since the time of the financial crisis but by historical standards, this recovery continued to be weak. The assets of the US banking sector showed an overall growth of 2.1 per cent in 2009-10 from a negative growth of 3.9 per cent in 2008-09. This recovery was largely driven by the US banks with an asset size of more than US$ 1 billion, which constituted about 90 per cent of the total assets of the US banking sector (Chart II.12).
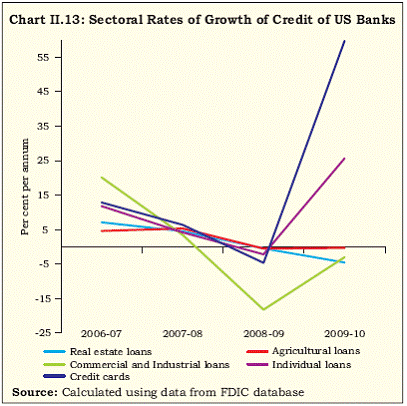
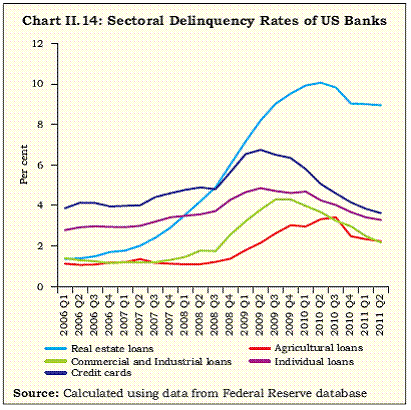
Credit continued to remain restricted to industrial sector 2.19 Among the major components of balance sheets of US banks, it was credit which was hit the hardest on account of the crisis. As already noted in earlier section, growth in credit of US banks turned negative since September 2009, and entered the positive zone only after a year in August 2010 but showed signs of slowing down again in 2011 (see Chart II.2 earlier). The sector that received the largest setback with the slowing down of both credit and economic growth as fallout of the crisis was the commercial and industrial sector in the US. For both commercial/industrial and real estate sectors, bank credit continued to remain restricted even in 2009-10, as personal credit, particularly credit cards, showed a significant revival on the back of low base and with some improvement in the confidence of US consumers about a better economic outlook (Chart II.13). High levels of non-performing loans 2.20 High levels of non-performing loans, particularly in the real estate sector, remained the weakest spot in the US banking system, as noted in the Annual Report of the Federal Reserve (2010). The delinquency rate for real estate loans hit a high of 10 per cent in the second quarter of 2010 (Chart II.14)4. In the subsequent quarters, this rate tapered off moderately but still remained at a stubbornly elevated level.
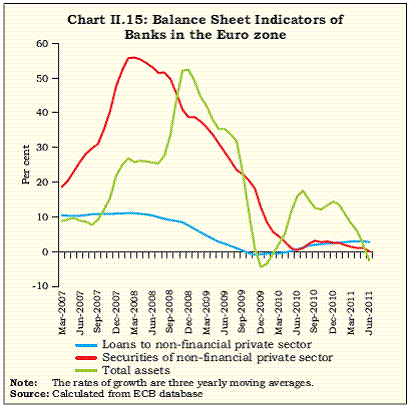
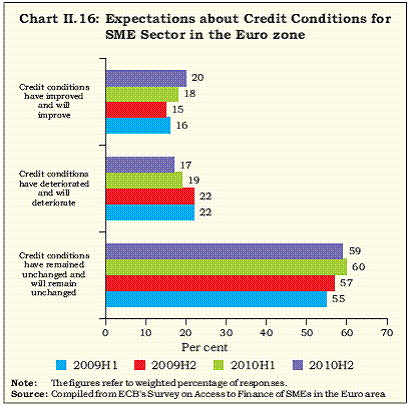
Euro zone banking system - Concerns remain with regard to revival in credit 2.21 At the aggregate level, banking conditions in the Euro zone showed signs of improvement in terms of revival in growth in private credit and banks’ investment in securities of the private sector in 2010 (Chart II.15). However, at the disaggregated level, concerns about credit revival continued to plague banks in the fiscally strained economies (Chart II.2 earlier). Also, concerns remained about revival in credit to small and medium enterprises (SMEs) in the Euro zone, a sector largely dependent on bank finance (Chart II.16).
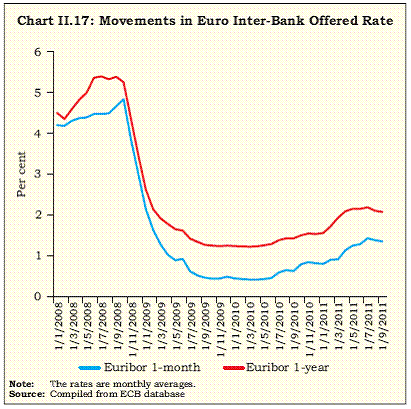
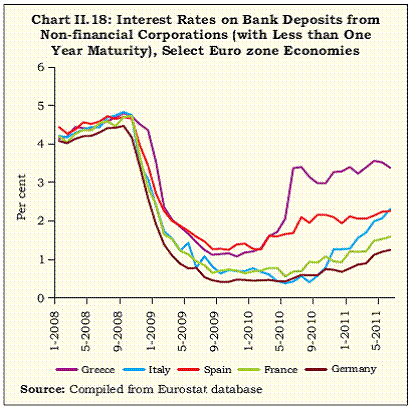
Impact of sovereign debt crisis on Euro zone banking system 2.22 Sovereigns, especially home sovereigns, are generally an important part of banks’ balance sheets. With downgrading of sovereigns and the resulting losses, banks’ balance sheets in the Euro zone countries, particularly in the countries which are fiscally challenged, have weakened significantly. Further, rising sovereign risks have also increased funding risks for Euro zone banks. This is evident from a rising trend in Euribor (Euro Inter-bank Offered Rate) since mid-2010 (Chart II.17). It is noteworthy that deposit rates in Spain, Italy and Greece – economies severely afflicted by the sovereign debt crisis – are at higher levels than the rates prevailing in other Euro zone countries, viz., France and Germany, again reflecting funding strains for banks in these economies (Chart II.18). Risks related to cross-border exposure of sovereign debt 2.23 With sovereign debt concerns coming to the fore in the Euro area, concerns have emerged over stability of banks having exposure to sovereign debt of Euro area countries, particularly on account of cross-border exposure of sovereign debt (Box II.1).
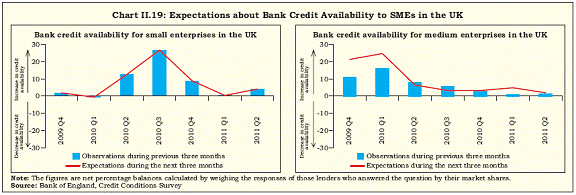
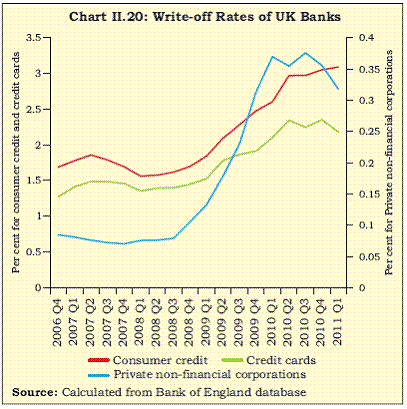
UK banking system – Leverage and credit risks at elevated levels 2.24 In 2010-11, the UK banking system showed moderate de-leveraging and reduced its reliance on wholesale funding, unlike its counterparts in the Euro zone. However, the UK banking system continued to be besieged by some concerns: First, despite de-leveraging, the level of leverage still remained high for UK banks. Secondly, private credit growth remained considerably weak, as already shown in Chart II.2. Moreover, the near to medium-term expectations about an improvement in credit availability have been on wane, particularly for medium term enterprises, as per the Bank of England Credit Conditions Survey (Chart II.19). Thirdly, credit risks continued to be at elevated levels, as illustrated earlier in Chart II.6. At the sectoral level, credit risks grew for the unsecured component of bank loans, namely, credit card loans (Chart II.20). Box II.1: European Banks’ Exposure to Euro Area Sovereign Debt Apart from their exposure to sovereign debt of their own country, cross-border exposure to sovereign debt is also high for banks in some of the Euro area nations (Table below). Illustratively, despite Germany’s sound fiscal position, its exposure to sovereign debt of other Euro area nations, some of which have debt sustainability issues, is relatively high. German and French banks are more exposed to the sovereign debt of Italy than other nations. Due to the high cross-border exposure to sovereign debt of banks, any haircut/restructuring could adversely affect the banks of countries with otherwise sound fiscal positions.
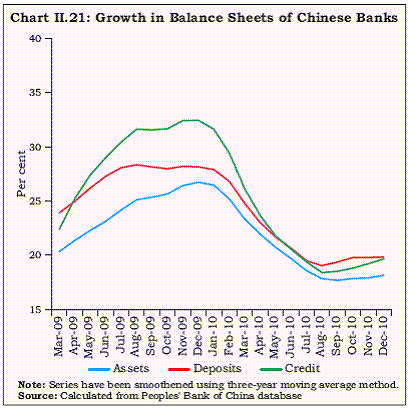
Chinese banking system - concerns about weakening of asset quality 2.25 Among the emerging economies, China exhibited a rapid expansion in the asset size of its banking system in 2009, at a time when banking sector assets in most advanced economies were in a phase of contraction following the financial crisis. The growth in bank assets and credit, however, peaked by the end of 2009 and posted a decline thereafter (Chart II.21). Yet, credit growth in China remained at a high level in 2010. With the high growth in credit, there are concerns being raised about a weakening of asset quality of Chinese banks in the near future. 4. An Analysis of the Performance of Top 100 Global Banks Considerable repositioning of banks at the top end of the asset spectrum 2.26 The rank correlation coefficient of the top- 20 global banks between 2009 and 2010 worked out to 0.83. The correlation coefficient increased steadily, as the sample of banks was expanded to top-50 and then to top-100 banks. The rise in the rank correlation coefficients with the increase in the sample size suggested that there was considerable repositioning of banks at the top end of the asset spectrum (Table II.4).
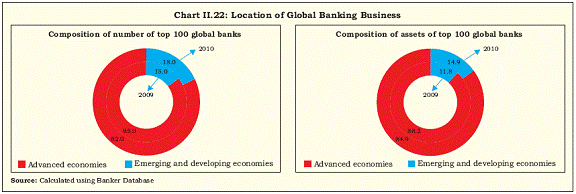
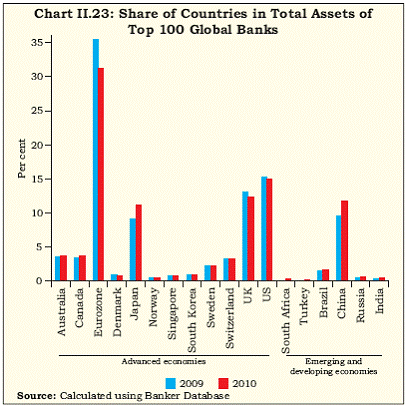
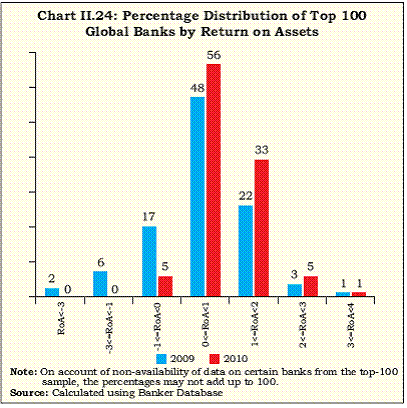
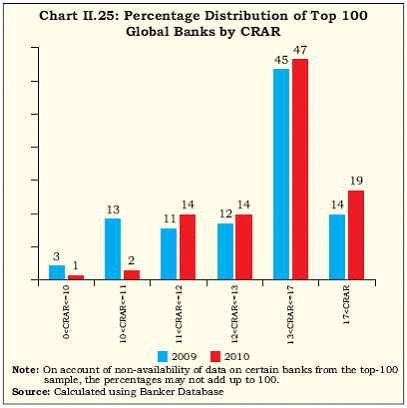
Moderate shift of the global banking business to emerging economies 2.27 An analysis of the location of incorporation of top 100 global banks (ranked by the strength of their Tier 1 capital) suggested a moderate shift of the global banking business from advanced economies to emerging economies in the aftermath of the crisis. This shift was attributable to bank failures as well as a weak growth in asset base of banks from the advanced economies. In terms of both number and total assets of the top 100 global banks, there was a fall in the share of advanced economies between 2009 and 2010 (Chart II.22). The decline in the asset share of advanced economies between 2009 and 2010 was concentrated in the US, UK, and more prominently, in the Euro zone economies (Chart II.23). Improvement in the profitability of global banks 2.28 There was a distinct improvement in the profitability of global banks between 2009 and 2010 as evident from an increase in RoA. The percentage of loss making global banks (reporting negative RoA) was down from 25 per cent in 2009 to only 5 per cent in 2010. Further, about 89 per cent of the global banks had a positive RoA of less than 2 per cent in 2010 as against a share of 70 per cent in 2009 (Chart II.24). Strengthening of capital adequacy of global banks 2.29 Apart from a turnaround in profitability of global banks, there was also strengthening of capital adequacy positions of these institutions between 2009 and 2010. There was an increasing concentration of banks between 2009 and 2010 in higher size classes based on CRAR. At end-December 2010, 47 per cent of the top 100 global banks had a CRAR ranging between 13 per cent and 17 per cent, far above the BCBS norm of 8 per cent under the Basel II framework (Chart II.25).
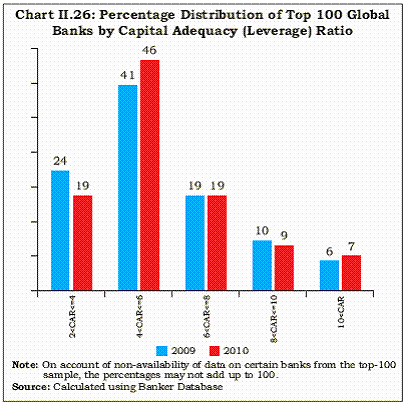
Slow process of deleveraging of global banks 2.30 Notwithstanding the improvement in CRAR, soundness of global banks remained a concern on account of a slow process of deleveraging and increasing levels of NPAs. At the end of 2009, about 24 per cent of the top-100 global banks were highly leveraged with a Capital Adequacy Ratio (CAR) – a measure of financial leverage – of less than four per cent; the percentage had come down moderately by 5 percentage points to 19 per cent at the end of 2010 (Chart II.26). As against this, the percentage of global banks with CAR ranging between 4 and 6 per cent had increased exactly by the same magnitude from 41 per cent to 46 per cent.
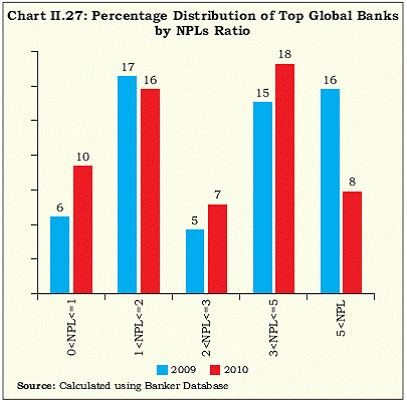
Weakening asset quality of global banks 2.31 Between 2009 and 2010, there was a decline in the proportion of banks reporting very high levels of NPLs ratio, suggesting some temperance of the acute credit strain on banks5. However, except this change at the extreme end of the spectrum, there was a general weakening of the asset quality of top global banks (Chart II.27).
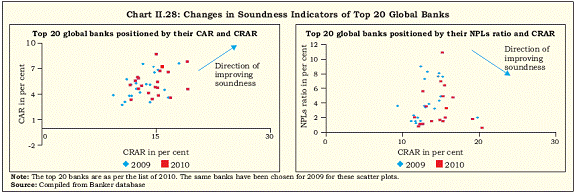
2.32 The scatter plots of top 20 global banks taking three indicators of CRAR, leverage and NPLs ratio, revealed that while banks were in the process of stepping up their CRAR between 2009 and 2010, there seemed to be little improvement in the leverage and NPLs ratios of banks during this period (Chart II.28). 5. Global Policy Reforms Significant increase in regulatory reforms 2.33 Various authoritative reports on the crisis so far, including that of the latest Financial Crisis Inquiry Commission of the US (2011), have attributed the eruption of a financial crisis of such vast magnitude and impact, to serious lacunae in the financial regulatory and supervisory framework6. Further, owing to the globalisation of finance, these reports have also underscored the need to increase interregulatory coordination both at the national and international level. A number of banking policy reforms are since then being contemplated; some of these, have even reached the stage of implementation.
Reforms in Capital and Liquidity Standards 2.34 The most significant development during the year was the announcement by the Basel Committee on Banking Supervision (BCBS) in December 2010 (followed by minor modifications with regard to capital treatment for counterparty credit risk in bilateral trades in June 2011) of the reform framework to strengthen the capital and liquidity standards. The framework provides details of the regulatory standards agreed to by the Governors and Heads of Supervision (GHOS) in September 2010, and endorsed by the G-20 Leaders in November 2010. This framework incorporates both micro-prudential and macroprudential approaches to regulation and supervision. It is much more comprehensive and counter-cyclical in approach as compared to Basel II7. It provides a set of collective minimum requirements, and is expected to be implemented in totality and not in parts8. The key objectives and features of the reform measures suggested in the Basel III framework are summarised in Box II.2. 2.35 In addition to the December 2010 capital rules, the BCBS also recommended the loss absorption by capital instruments at the point of non-viability in January 2011 as a measure to enhance the quality of regulatory capital. According to this recommendation, all regulatory capital instruments should be able to absorb losses in the event when a bank is unable to support itself in private market, including situations where recapitalisation by public sector is necessary to save the bank. 2.36 In December 2010, the Final Report of the Macro-economic Assessment Group (MAG) formed by Financial Stability Board (FSB) and BCBS concluded that the impact of higher capital standards on economic growth would be modest and would be much less in magnitude and spread over a longer time horizon than what was estimated by the MAG Interim Report in August 2010. Taking a median of national estimates, the MAG observed a decline in annual GDP growth rate of about 3 basis points from its baseline level for 35 quarters from the start of implementation of the standards. The Long-term Economic Impact (LEI) Group studied the costs and benefits of the new standards over the long run. The LEI noted that, while the costs in terms of permanent GDP foregone were expected to be small, the benefits of reducing crisis-related risks would be substantial9. Box II.2: Key Objectives and Features of the Basel III Framework Capital Standards I Raising capital base Objective - Ensuring quality, consistency in definition across jurisdictions and transparency in disclosure of capital base. Measures - I.1 Tier 1 capital predominantly held as common shares and retained earnings; I.2 Remainder of Tier 1 capital comprising of subordinated instruments with fully discretionary non-cumulative dividends and with no maturity date or incentive to redeem; I.3. Innovative hybrid instruments with an incentive to redeem would be phased out. II Enhancing risk coverage Objective - Strengthening risk coverage of capital framework especially for on- and off-balance sheet items and derivative exposures. Measures - II.1. Introduction of stressed Value-at-Risk (VAR) capital requirement based on a continuous 12-month period of significant financial stress; II.2. Higher capital requirements for re-securitisation in banking and trading book; II.3. Introduction of capital charge for potential mark-to-market losses related to credit valuation adjustment risks associated with deterioration in creditworthiness of counterparty; II.4. Strengthening standards for collateral management. Banks with large illiquid derivative position to a counterparty would have to apply longer margining periods for determining regulatory capital requirements. III. Supplement risk-based capital requirements with leverage measure Objective - Containing leverage in the banking sector thereby mitigating risk related to deleveraging. Measures - III.1. Introduction of a simple, transparent and independent measure of leverage, comparable across jurisdictions by adjusting for differences in accounting standards. IV. Reduce pro-cyclicality through counter-cyclical buffers Objective - Dampening pro-cyclical movements within the banking system by making it a “shock absorber” rather than a transmitter of risk to the real economy. Measures - IV.1. Movement to a relatively less pro-cyclical Expected Loss (EL) approach as against existing Incurred Loss (IL) and updation of supervisory guidance consistent with the EL approach; IV.2. Creation of capital conservation buffers above the minimum capital and adjust the buffer range during periods of excess credit growth. Liquidity Standards I. Minimum liquidity standards Objective - Introducing internationally harmonised and robust liquidity standards since stronger capital requirements may be necessary but not a sufficient condition for banking sector stability. Measures - I.1. Introduction of liquidity coverage ratio to ensure sufficient high quality liquid resources to cope with an acute stress scenario lasting one month; I.2. Introduction of net stable funding ratio, which has a longer time horizon of one year to provide sustainable maturity structure of assets and liabilities. II. Quantitative liquidity metrics Objective - Imparting consistency in quantitative metrics used by supervisors to capture liquidity risks. Measures - II.1. Introduction of metrics, which include among others, contractual maturity mismatch, concentration of funding, available unencumbered assets and liquidity coverage ratio by currency. Reference: “Basel III: A Global Regulatory Framework for More Resilient Banks and Banking Systems”, Bank for International Settlements, June 2011. Reforms for Systemic Risk Management 1. Reforms related to Macro-Prudential Regulatory Framework 2.37 The crisis showed that while most financial entities can be regulated at an individual level, the lack of an arrangement to supervise the system as a whole can create financial instability. Since the crisis, there has been an explicit focus on developing a macro-prudential framework for dealing with system-wide risks. 2.38 The G-20 regulatory reform agenda has turned its attention to macro-prudential regulation, calling on international bodies to develop such a framework10. The Basel III framework designed by the BCBS includes a number of provisions to dampen pro-cyclicality and increase the resilience of financial system. The most important macro-prudential measure under Basel III framework is the counter-cyclical capital buffer, which can address the time dimension of systemic risks; the details of the concept and working of this buffer are illustrated in Box II.3. 2.39 There are other provisions of Basel III, which can also address time dimension of systemic risks, though they are not exclusively designed to address the same. These include permanent capital conservation buffer; minimum leverage ratio; and new liquidity standards. As regards dealing with crosssectional dimension of systemic risks, the Basel III standards with increased bank capital and liquidity are expected to enhance the resilience of each individual institution to adverse shocks. Box II.3: Counter-Cyclical Capital Buffer: Concept and Working The introduction of a counter-cyclical capital buffer in Basel III framework is an important step towards improving the quality of regulatory capital as well as addressing its pro-cyclicality, thereby facilitating an improved macro-prudential surveillance of the banking system. In December 2010, the BCBS issued the guidance for national authorities for operating the counter-cyclical capital buffer. As per this guidance, national jurisdictions would determine how the buffer should vary within the range of 0-2.5 per cent of risk-weighted assets and also be ready to remove this requirement in a timely manner if the systemic risk crystallises. The common reference guide for calibrating the buffer, as given in the BCBS principles, is private sector creditto- GDP gap (deviations of credit-to-GDP ratio from its longterm trend). However, the BCBS notes that as this guide may not always work well in all jurisdictions at all times, judgment coupled with proper communications is an integral part of calibrating the buffer instead of relying mechanically on the guide. The BCBS has also suggested using other variables and qualitative information, such as asset prices, funding spreads, Credit Default Swap (CDS) spreads, credit condition surveys and real GDP growth, among others. These indicators can be useful in assessing the sustainability of credit growth and the level of system-wide risk. As per the BCBS guidance, any increase in the buffer should be pre-announced by up to 12 months to give banks time to meet the additional capital requirements before they take effect. The reductions, however, would take effect immediately to reduce the risk of credit supply being constrained by regulatory capital requirements. Moreover, it is necessary for authorities to review the information at their disposal and accordingly, review the counter-cyclical capital buffer decisions on a quarterly or more frequent basis. As the decision about setting the buffer needs to be taken by national jurisdictions, in India, a Working Group has been set up within the Reserve Bank. In the Indian context, one of the major issues for calibrating the buffer relates to the choice of the reference guide. The Indian economy has undergone structural changes and growth has not been even across all sectors. As a result, sectoral credit requirements tend to vary substantially making it difficult to assess the build-up of risk based on the credit/GDP guide alone. The Group is currently examining this and various issues involved in the operationalisation of the counter-cyclical capital buffer. Reference: Bank for International Settlements (2010), “Guidance to National Authorities for Operating the Counter-Cyclical Capital Buffer”, December. 2. Reforms related to Systemically Important Financial Institutions (SIFIs) 2.40 A major development during the year with regard to containing systemic risks was the agreement reached by the GHOS on a consultative document setting out regulatory measures for Global Systemically Important Banks (G-SIBs) in June 2011. The regulation of G-SIBs is instrumental in dealing with the crosssectional dimension of systemic risk by mitigating inter-connection and contagion risk. These measures included the methodology for assessing systemic importance, and the additional required capital and their phase-in arrangements. The assessment methodology for G-SIBs is indicator-based and comprises five broad categories viz., their size, interconnectedness, lack of substitutability in terms of the services they provide, global (crossjurisdictional) activity and complexity11. 3. Reforms for regulating Shadow Banking and extending the Regulatory Perimeter 2.41 As the framework for regulation, supervision and resolution of SIFIs is strengthened, there is a potential for increase in incentive for businesses to migrate to the shadow banking system. Shadow banking is described as “credit intermediation involving entities and activities outside the regular banking system”12. This segment is of concern because credit intermediation in this segment takes place in an environment where prudential regulatory/supervisory oversight is either not applied or applied in lesser degree than for banks engaged in similar activities. In an attempt to close regulatory gaps, the FSB has formed a Task Force, which has drafted a scoping paper entitled “Shadow Banking: Scoping the Issues”, on the basis of which it made recommendations for the consideration of G-20 in autumn 2011. The G-20, in its October 2011 meeting, agreed on the initial recommendations on oversight of shadow banking. The FSB has suggested surveillance of shadow banking system through (i) improved two-step monitoring from micro and macroperspectives and (ii) direct regulation of shadow banking entities and indirect regulation by regulating banks’ interactions with these entities. 2.42 Apart from these global reforms, there have been significant policy reforms across various advanced countries in the post-crisis period. There have been attempts to institutionalise collegial arrangements in the US, UK and EU, involving the Governments, central banks and other regulators with the primary responsibility to identify, monitor and address threats of systemic risk. 6. Conclusions Global banks are confronting multiple risks 2.43 Global banking system today stands at a juncture, where downside risks and challenges outweigh the positive efforts made by the banking system towards regaining growth and health since the outbreak of the financial crisis. The downside risks are manifold and arise not just from within the banking system but also from the financial system in general, fiscal conditions and state of the global economy. The risks arising from other segments impact the banking segment through an “adverse feedback” effect, to borrow the term used by the European Central Bank (ECB). Marginal improvement in capital adequacy and profitability of the global banking system 2.44 The growth and soundness of the global banking system, as discussed, stands marginally improved on two major counts since 2008. First, there are indications of modest improvements in profitability of banks in the US and UK in 2010. Second, there has been a steady effort by global banks to strengthen their capital base, which can prepare them to absorb future losses more effectively. Vulnerabilities persist 2.45 The global banking system, however, stands weak on many counts after the crisis. First, the system as a whole and most advanced economies, especially the fiscally strained economies in the Euro zone, still show very weak credit growth. There are concerns about the revival in credit growth in many advanced economies to sectors that rely heavily on bank financing and are crucial for revival in employment and growth, namely, small and medium enterprises. 2.46 Secondly, the onset of sovereign debt pressures since the early 2010 have given rise to renewed credit, market and funding risks in the Euro zone economies with troubled sovereigns, as well as the peripheral economies of Germany, France and the UK, whose banks are either directly or indirectly exposed to these sovereigns. Recapitalisation of banks in the Euro zone is also a major concern at the present juncture. Many of the Euro zone banks may require substantial pumping of capital given the capital shortfall in the event of a high Greek haircut. 2.47 Thirdly, despite attempts at de-leveraging, global banks in most advanced economies, especially in the Euro zone and UK, continue to be highly leveraged with dependence on wholesale funding markets. Fourthly, credit risks also continue to be at high levels, not just attributable to sovereign credit risks but also risks emanating from the unsecured component of bank credit in many advanced economies. Fifthly, the crisis has dampened the extent of financial inclusion in most advanced economies pushing people out of the ambit of financial system on account of both supply and demand side factors. Supply of banking facilities has been eroded with bank failures and decline in banking activity in advanced economies. Demand for banking services too has been affected with a dent on employment and income generation in these economies. 2.48 Finally, there has been a growing divergence between the performance of banking systems in advanced and emerging economies. While growth and soundness of banks in advanced economies are at low, the credit growth in major emerging economies has been high leading to concerns about overheating of these economies. In China, there are concerns about high credit growth leading to burgeoning of bad assets for banks. The high levels of inflation coupled with increasing short-term capital flows into these economies have further raised concerns about financial stability. Near-term outlook for the global banking system is fraught with many uncertainties 2.49 Given that global risks outweigh improvements, there is an urgent need for advanced economies to step up macro-economic action, especially for improving the fiscal situation. Further, both advanced economies and emerging economies need to work individually and collectively towards strengthening and reviving the global banking system. There has to be greater commitment from countries towards consistently implementing the banking regulatory reforms that have been already agreed upon while strengthening their macroprudential oversight. There is a need, however, to rightly calibrate the transition to this system in order to avoid any adverse impact on the global economy, particularly since the global economic recovery remains weak. The more recent intense formal consultations among European nations to finalise a Euro deal will have significant implications for European banks in terms of stiff haircuts to be accepted and to strengthen the capital bases of banks through recapitalisation. European banks, thus, need to brace for some such difficult exercises before they eventually stabilise. All in all, the near-term outlook for the global banking system is fraught with many uncertainties, some of which are beyond its direct control. In the present situation, Government agencies, central banks and banking institutions should collectively tread the risky path to enduring recovery and stability. 1 The US GDP growth in the first quarter of 2011 slowed down to 0.4 per cent and recovered, albeit moderately, to 1.3 per cent in the second quarter. In Germany, GDP growth was 1.3 per cent in the first quarter of 2011 but declined to 0.1 per cent in the second quarter of the year. 2 As per the baseline proposal for leverage ratio put forward by the BCBS under its Basel III rules text, (i) the capital measure should include Tier 1 capital and the predominant form of Tier 1 capital, while (ii) total exposure should include exposure net of provisions and other valuation adjustments. Hence, the measure of leverage used for the present analysis has been referred to as preliminary. It directly follows the measure provided by the IMF in its Financial Soundness Indicators (FSI) database. It is noteworthy, however, that the IMF while discussing this measure, refers to it as a “leverage ratio”; see “Concepts and Definitions” of FSI, <www.imf.org>. 3 Financial Access 2010 – The State of Financial Inclusion through the Crisis, CGAP, World Bank. 4 Delinquency rates are defined as loans past due for thirty days or more and still accruing interest as well as those in non-accrual status. They are seasonally adjusted. Hence, these rates do not compare with the NPL ratios given in Chart II.6 earlier. 5 On account of non-reporting of data by many banks, the present analysis of NPLs is based on a sample of only 59 banks instead of 100 banks. 6 For instance, see Turner Review (2009) and Larosiere Report (2009). 7 See Report on Trend and Progress of Banking in India – 2008-09 for a comparison of Basel III and Basel II norms of capital requirement and schedule for phase-in arrangements of Basel III. 8 See “Regulatory Reform: Remaining Challenges”, Speech by Jaime Caruana, BIS, July 2011. 9 “An Assessment of the Long-term Economic Impact of Stronger Capital and Liquidity Requirements”, BIS, August 2010. 10 See “The Basel Committee’s Response to the Financial Crisis: Report to the G-20", BIS, October 2010. 11 See “Global Systemically Important Banks: Assessment Methodology and Additional Loss Absorbency Requirement”, Consultative Document, BIS, July 2011. 12 See "Shadow Banking: Scoping the Issues", FSB, April 2011. |
||||||||||||||||||||||||||||||||||||||||||||||||||||||||||||||||||||||||||||||||||||||||||||||||||||||||||||||||||||||||||||||||||||||||||||||||||||||||||||||||||||||||||||||||||||||||||||||||||||||||||||||||||||||||||||||||||||||||||||||||
Page Last Updated on:


