RbiSearchHeader

Press escape key to go back

Past Searches

Theme
Theme
Text Size
Text Size
S2

RbiAnnouncementWeb

RBI Announcements
RBI Announcements

Asset Publisher

78915930

Households’ Inflation Expectations Survey

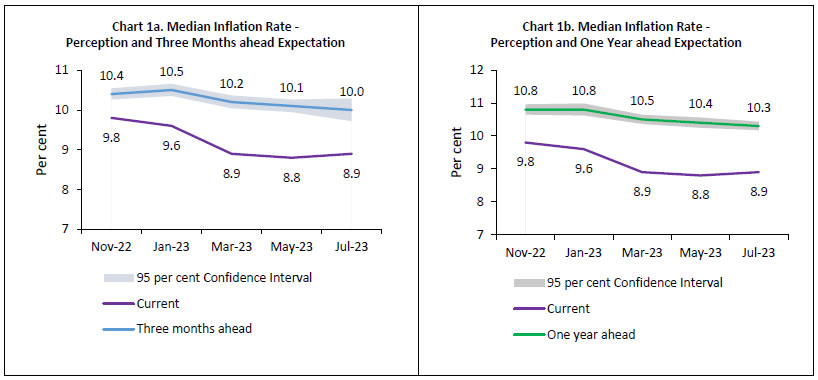
Today, the Reserve Bank released the results of July 2023 round of its bi-monthly inflation expectations survey of households (IESH)1 2. The survey was conducted during July 1-10, 2023 in 19 major cities, with responses from 6,025 urban households. Female respondents accounted for 50.6 per cent of this sample.

Highlights:

  1. Household perception of current inflation inched up by 10 basis points (bps) to 8.9 per cent in the latest round of the survey; their expectations of both three months and one year ahead inflation, however, moderated by 10 bps each to 10.0 per cent and 10.3 per cent, respectively [Charts 1a and 1b; Table 3].

  2. Among major consumption categories, the share of respondents expecting price rise over three months horizon is highest for the food group for sixth successive survey round; for one year ahead period, however, the pressure from housing group also remains high [Table 1(a) and Table 1(b)].

  3. General inflation expectation remained elevated in anticipation of firmer food prices over the next three months even as a lower share of respondents expected rise in inflation for other product groups [Table 1(a)].

  4. Inflation expectations of both female and male respondents stood a shade lower when compared to the previous survey round; the marginal easing was witnessed across a majority of centres [Table 2].

Chart 1a and 1b

Note: Please see the excel file for time series data.3

Table 1(a): Product-wise Expectations of Prices for Three Months ahead
(Percentage of Respondents)
Survey period ended Jul-22 Jan-23 Mar-23 May-23 Jul-23
General Estimate SE Estimate SE Estimate SE Estimate SE Estimate SE
Prices will increase 83.1 0.80 84.3 0.76 83.8 0.83 81.2 0.82 80.8 0.86
Price increase more than current rate 58.7 1.21 60.8 1.14 60.6 1.17 59.7 1.08 55.3 1.20
Price increase similar to current rate 21.1 0.97 20.2 0.86 19.8 0.87 17.9 0.77 21.8 0.93
Price increase less than current rate 3.3 0.36 3.4 0.36 3.5 0.36 3.5 0.41 3.6 0.39
No changes in prices 13.7 0.74 13.3 0.71 13.3 0.74 15.7 0.77 16.1 0.79
Decline in prices 3.2 0.38 2.3 0.30 2.8 0.41 3.1 0.35 3.1 0.41
Food Product                    
Prices will increase 83.7 0.77 84.6 0.72 84.0 0.75 82.7 0.73 84.0 0.77
Price increase more than current rate 59.6 1.13 61.1 1.08 62.1 1.12 61.8 1.00 63.5 1.04
Price increase similar to current rate 18.9 0.90 18.4 0.77 16.9 0.79 16.2 0.71 15.5 0.72
Price increase less than current rate 5.2 0.45 5.1 0.43 5.1 0.42 4.7 0.42 5.0 0.44
No changes in prices 10.1 0.64 10.2 0.59 9.7 0.59 11.0 0.61 9.0 0.60
Decline in prices 6.1 0.52 5.2 0.45 6.3 0.53 6.3 0.48 7.0 0.54
Non- Food Product                    
Prices will increase 80.8 0.84 81.8 0.77 81.3 0.79 78.4 0.84 75.5 0.92
Price increase more than current rate 55.7 1.14 56.4 1.08 58.6 1.10 57.1 1.08 52.2 1.16
Price increase similar to current rate 19.8 0.89 20.5 0.82 17.7 0.80 16.6 0.70 18.4 0.80
Price increase less than current rate 5.2 0.45 4.9 0.44 5.1 0.43 4.6 0.43 4.9 0.43
No changes in prices 13.2 0.72 13.4 0.67 13.3 0.67 16.2 0.74 18.3 0.80
Decline in prices 6.0 0.49 4.7 0.43 5.4 0.51 5.4 0.45 6.2 0.54
Household Durables                    
Prices will increase 68.7 0.95 72.4 0.90 67.9 0.92 68.2 0.90 65.8 0.97
Price increase more than current rate 46.6 1.11 50.3 1.07 47.8 1.09 49.5 1.06 45.3 1.12
Price increase similar to current rate 17.3 0.81 17.5 0.71 15.8 0.75 14.8 0.67 15.8 0.75
Price increase less than current rate 4.8 0.44 4.6 0.42 4.2 0.41 3.9 0.38 4.6 0.41
No changes in prices 23.7 0.88 21.2 0.84 22.4 0.85 24.6 0.86 25.0 0.88
Decline in prices 7.6 0.54 6.3 0.47 9.7 0.60 7.2 0.51 9.2 0.60
Cost of Housing                    
Prices will increase 74.8 0.88 78.0 0.86 78.2 0.92 78.1 0.82 76.8 0.94
Price increase more than current rate 54.2 1.10 58.4 1.08 57.7 1.14 59.4 1.06 56.0 1.14
Price increase similar to current rate 16.9 0.77 16.3 0.73 16.7 0.76 15.1 0.74 17.0 0.75
Price increase less than current rate 3.7 0.37 3.3 0.35 3.8 0.39 3.7 0.35 3.7 0.35
No changes in prices 20.3 0.82 18.9 0.84 18.1 0.83 18.7 0.79 20.2 0.88
Decline in prices 4.8 0.44 3.1 0.34 3.7 0.44 3.2 0.36 3.0 0.37
Cost of Services                    
Prices will increase 71.7 0.93 71.7 0.90 73.2 0.90 70.6 0.89 67.7 0.97
Price increase more than current rate 48.6 1.12 49.9 1.08 51.7 1.11 51.3 1.00 47.3 1.13
Price increase similar to current rate 19.0 0.88 17.6 0.71 17.8 0.76 15.8 0.69 15.9 0.72
Price increase less than current rate 4.1 0.41 4.1 0.40 3.6 0.37 3.5 0.37 4.5 0.40
No changes in prices 24.8 0.92 25.5 0.88 23.2 0.86 26.2 0.87 28.2 0.90
Decline in prices 3.4 0.38 2.7 0.30 3.6 0.40 3.2 0.34 4.1 0.43
Note:
1. The table provides estimates and standard errors for qualitative responses.
2. Constituent items may not add up to the corresponding total, due to rounding off.
 
Table 1(b): Product-wise Expectations of Prices for One Year ahead
(Percentage of Respondents)
Survey period ended Jul-22 Jan-23 Mar-23 May-23 Jul-23
General Estimate SE Estimate SE Estimate SE Estimate SE Estimate SE
Prices will increase 88.4 0.70 91.6 0.53 90.4 0.66 89.6 0.61 88.6 0.68
Price increase more than current rate 66.2 1.23 70.8 1.02 69.3 1.11 70.2 1.05 65.0 1.07
Price increase similar to current rate 19.3 1.00 17.9 0.81 18.1 0.87 16.7 0.77 20.5 0.86
Price increase less than current rate 2.8 0.32 3.0 0.33 3.0 0.33 2.7 0.32 3.1 0.33
No changes in prices 8.1 0.61 5.7 0.43 6.4 0.50 7.3 0.50 8.6 0.57
Decline in prices 3.4 0.41 2.6 0.31 3.2 0.43 3.1 0.35 2.8 0.35
Food Product                    
Prices will increase 83.5 0.76 88.0 0.64 86.3 0.71 86.9 0.66 84.7 0.75
Price increase more than current rate 58.1 1.18 62.7 1.07 63.7 1.16 64.6 0.99 60.6 1.11
Price increase similar to current rate 21.3 0.98 20.7 0.87 18.5 0.86 18.3 0.77 20.1 0.85
Price increase less than current rate 4.1 0.40 4.5 0.42 4.1 0.38 4.0 0.40 4.0 0.38
No changes in prices 10.5 0.65 7.6 0.50 8.1 0.53 8.0 0.51 9.3 0.59
Decline in prices 6.0 0.55 4.4 0.39 5.6 0.52 5.2 0.44 6.0 0.48
Non- Food Product                    
Prices will increase 83.6 0.78 86.7 0.67 85.4 0.73 84.1 0.72 81.6 0.85
Price increase more than current rate 58.9 1.16 62.0 1.09 62.9 1.12 62.0 1.05 57.1 1.16
Price increase similar to current rate 20.8 0.92 20.5 0.83 18.2 0.78 17.9 0.77 20.6 0.83
Price increase less than current rate 3.9 0.38 4.3 0.41 4.3 0.40 4.2 0.41 3.9 0.38
No changes in prices 10.9 0.68 9.1 0.54 9.4 0.55 11.1 0.61 13.5 0.72
Decline in prices 5.4 0.54 4.1 0.39 5.2 0.51 4.8 0.43 4.8 0.48
Household Durables                    
Prices will increase 75.5 0.84 80.8 0.77 76.5 0.85 76.9 0.83 75.8 0.88
Price increase more than current rate 52.2 1.12 57.2 1.08 55.8 1.15 57.0 1.07 53.2 1.10
Price increase similar to current rate 19.3 0.88 19.3 0.79 16.9 0.80 16.1 0.72 18.4 0.80
Price increase less than current rate 4.0 0.39 4.3 0.41 3.8 0.38 3.7 0.37 4.2 0.38
No changes in prices 18.3 0.78 13.8 0.65 15.4 0.70 16.7 0.71 17.7 0.76
Decline in prices 6.1 0.49 5.4 0.43 8.1 0.60 6.4 0.48 6.5 0.48
Cost of Housing                    
Prices will increase 83.4 0.75 87.4 0.63 87.4 0.65 87.9 0.63 86.8 0.69
Price increase more than current rate 61.4 1.14 66.8 0.98 66.6 1.06 67.4 1.00 64.6 1.05
Price increase similar to current rate 18.6 0.87 17.2 0.77 17.4 0.80 17.1 0.76 18.5 0.79
Price increase less than current rate 3.4 0.36 3.5 0.36 3.4 0.37 3.4 0.34 3.8 0.37
No changes in prices 12.4 0.67 9.8 0.57 9.2 0.54 9.1 0.54 10.4 0.60
Decline in prices 4.1 0.42 2.8 0.30 3.4 0.41 3.0 0.34 2.7 0.34
Cost of Services                    
Prices will increase 81.1 0.84 84.0 0.72 83.6 0.80 83.2 0.72 80.9 0.80
Price increase more than current rate 57.4 1.17 60.2 1.08 60.5 1.14 61.1 1.05 57.3 1.12
Price increase similar to current rate 19.9 0.95 19.7 0.80 18.8 0.83 18.2 0.81 19.6 0.83
Price increase less than current rate 3.9 0.39 4.2 0.41 4.3 0.39 3.9 0.36 4.0 0.39
No changes in prices 15.0 0.80 13.1 0.65 13.0 0.68 13.7 0.64 15.5 0.72
Decline in prices 3.8 0.45 2.8 0.33 3.4 0.44 3.1 0.34 3.5 0.37
Note:
1. The table provides estimates and standard errors for qualitative responses.
2. Constituent items may not add up to the corresponding total, due to rounding off.
 
Table 2: Inflation Expectations of Various Groups: Jul-23
  Current Perception Three Months ahead Expectation One Year ahead Expectation
Mean Median Mean Median Mean Median
Estimate SE Estimate SE Estimate SE Estimate SE Estimate SE Estimate SE
Overall 9.3 0.09 8.9 0.14 10.2 0.09 10.0 0.15 10.0 0.11 10.3 0.07
Gender-wise                        
Male 9.5 0.13 8.9 0.18 10.3 0.13 9.9 0.21 10.0 0.16 10.2 0.11
Female 9.3 0.12 8.9 0.19 10.2 0.13 10.0 0.15 10.1 0.15 10.3 0.08
Category-wise                        
Financial Sector Employees 9.7 0.52 8.7 0.76 10.3 0.54 9.3 0.60 10.2 0.60 10.3 0.77
Other Employees 9.5 0.18 9.0 0.28 10.3 0.19 10.0 0.24 10.0 0.22 10.2 0.12
Self Employed 9.4 0.19 8.8 0.28 10.2 0.21 9.5 0.41 9.7 0.25 10.0 0.24
Homemaker 9.2 0.14 8.9 0.24 10.1 0.15 9.9 0.20 10.0 0.17 10.3 0.09
Retired Persons 10.5 0.51 10.1 0.54 11.0 0.48 10.6 0.57 10.5 0.53 10.6 0.64
Daily Workers 9.3 0.23 9.0 0.37 10.4 0.23 10.1 0.24 10.2 0.29 10.4 0.16
Other category 9.3 0.22 8.6 0.25 10.3 0.22 9.9 0.31 10.3 0.26 10.4 0.17
Age Group-wise                        
Up to 25 years 8.8 0.18 8.3 0.24 9.8 0.18 9.4 0.29 9.9 0.23 10.1 0.17
25 to 30 years 9.0 0.18 8.5 0.25 10.1 0.18 9.5 0.30 10.0 0.24 10.3 0.15
30 to 35 years 9.3 0.19 8.8 0.23 10.3 0.21 9.9 0.30 10.0 0.24 10.2 0.13
35 to 40 years 9.4 0.19 8.9 0.31 10.2 0.20 10.0 0.25 10.1 0.23 10.4 0.13
40 to 45 years 9.4 0.20 9.0 0.41 10.1 0.22 9.8 0.35 9.8 0.26 10.2 0.18
45 to 50 years 9.6 0.22 9.2 0.43 10.3 0.23 10.1 0.22 9.7 0.29 10.1 0.26
50 to 55 years 9.5 0.27 9.0 0.52 10.3 0.29 9.6 0.50 9.8 0.35 9.9 0.48
55 to 60 years 9.7 0.30 9.5 0.45 10.4 0.31 10.1 0.39 9.7 0.40 10.2 0.38
60 years and above 10.3 0.34 10.0 0.36 11.2 0.33 10.8 0.41 10.7 0.36 10.7 0.49
City-wise                        
Ahmedabad 8.3 0.32 7.1 0.37 10.0 0.35 9.3 0.52 9.7 0.45 9.2 0.59
Bengaluru 8.1 0.28 6.9 0.72 9.4 0.29 8.6 0.60 9.7 0.36 10.0 0.42
Bhopal 8.1 0.91 6.9 1.33 8.9 0.78 8.1 1.38 7.7 0.68 6.9 0.99
Bhubaneswar 8.3 0.63 7.5 1.39 9.8 0.70 9.1 1.16 9.3 0.86 9.6 0.96
Chennai 8.9 0.32 9.2 0.81 10.4 0.39 10.4 0.25 11.3 0.37 11.1 0.55
Delhi 10.6 0.23 10.2 0.12 11.1 0.25 10.6 0.19 10.6 0.28 10.7 0.28
Guwahati 8.6 0.51 9.0 1.02 9.4 0.53 9.6 0.76 9.6 0.68 10.0 0.61
Hyderabad 8.8 0.39 8.5 0.85 9.6 0.33 9.0 0.67 9.3 0.43 9.8 0.54
Jaipur 8.7 0.33 8.5 0.43 9.2 0.38 8.9 0.39 7.9 0.63 8.2 0.75
Jammu 10.9 0.61 10.5 0.15 10.2 0.50 10.1 0.57 8.5 1.05 9.6 1.59
Kolkata 11.0 0.32 10.4 0.20 11.9 0.32 11.6 0.94 11.8 0.34 12.7 1.09
Lucknow 9.5 0.50 9.7 0.68 10.0 0.47 10.0 0.53 9.1 0.53 9.3 0.92
Mumbai 9.1 0.19 8.4 0.15 9.9 0.21 9.2 0.30 9.5 0.24 10.0 0.25
Nagpur 9.5 0.46 8.6 0.62 10.6 0.45 9.7 0.61 10.3 0.56 10.4 0.36
Patna 7.6 0.34 7.5 0.47 8.1 0.37 7.9 0.46 6.9 0.51 7.4 0.45
Thiruvananthapuram 6.9 0.79 5.6 0.27 8.3 0.82 7.2 0.75 9.5 0.95 9.0 1.28
Chandigarh 9.4 0.77 8.8 1.38 9.4 0.68 8.7 1.24 8.6 0.62 8.5 1.06
Ranchi 9.3 0.37 8.8 0.34 9.7 0.36 9.5 0.47 9.8 0.48 10.1 0.42
Raipur 9.8 0.49 9.8 0.42 10.5 0.54 10.2 0.63 11.1 0.63 11.5 0.79
Note: The table provides estimates and standard errors for quantitative responses.
 
Table 3: Household Inflation Expectations – Current Perception, Three Months and One Year Ahead Expectations
  Current Perception Three Months ahead Expectation One Year ahead Expectation
Mean Median Mean Median Mean Median
Estimate SE Estimate SE Estimate SE Estimate SE Estimate SE Estimate SE
Jul-22 9.8 0.10 9.3 0.24 10.7 0.11 10.3 0.08 10.3 0.13 10.5 0.08
Jan-23 9.7 0.09 9.6 0.30 10.8 0.10 10.5 0.08 10.8 0.11 10.8 0.09
Mar-23 9.5 0.10 8.9 0.17 10.5 0.10 10.2 0.08 10.4 0.11 10.5 0.07
May-23 9.3 0.09 8.8 0.13 10.3 0.10 10.1 0.08 10.2 0.11 10.4 0.08
Jul-23 9.3 0.09 8.9 0.14 10.2 0.09 10.0 0.15 10.0 0.11 10.3 0.07
Note: The table provides estimates and standard errors for quantitative responses.
 
Table 4: Households Expecting General Price Movements in Coherence with Movements in Price Expectations of Various Product Groups: Three Months Ahead and One Year Ahead
(Percentage of Respondents)
Survey period ended Food Non-Food Households durables Housing Cost of services
Three Months Ahead
Jul-22 66.9 67.8 62.3 63.7 66.9
Jan-23 65.6 67.3 62.6 66.2 66.5
Mar-23 67.4 68.8 60.9 65.9 68.0
May-23 67.4 68.6 63.4 67.1 69.1
Jul-23 63.1 65.5 60.9 64.5 65.7
One Year Ahead
Jul-22 74.3 75.5 69.2 73.2 75.8
Jan-23 75.2 74.8 68.4 74.7 74.0
Mar-23 75.7 75.7 69.6 74.9 75.7
May-23 75.6 75.3 70.7 76.1 76.4
Jul-23 73.4 73.0 66.9 73.4 73.6
Note: Figures are based on sample observations
 
Table 5(a): Cross-tabulation of Number of Respondents by Current Inflation Perception and Three Months Ahead Inflation Expectations: Jul-23
Three Months Ahead Inflation Rate (per cent)
Current Inflation Rate (per cent)   <1 1-<2 2-<3 3-<4 4-<5 5-<6 6-<7 7-<8 8-<9 9-<10 10-<11 11-<12 12-<13 13-<14 14-<15 15-<16 >=16 No idea Total
<1 4 3 0 0 0 0 0 0 0 0 0 0 0 0 0 0 0 0 7
1-<2 4 15 16 4 0 0 0 1 0 0 0 0 0 0 0 0 0 0 40
2-<3 0 9 73 44 39 16 0 0 0 0 2 0 0 0 0 0 0 0 183
3-<4 0 2 12 56 42 48 12 0 2 1 3 0 1 0 0 0 0 0 179
4-<5 0 0 7 15 86 69 29 5 8 4 3 0 0 0 0 0 0 0 226
5-<6 0 1 11 21 19 353 143 189 85 30 105 4 10 3 0 10 6 0 990
6-<7 0 0 0 5 6 11 195 98 69 19 19 2 2 1 0 2 2 1 432
7-<8 0 0 0 2 6 10 10 213 159 48 66 6 3 0 1 2 2 0 528
8-<9 0 0 0 2 5 6 4 7 230 93 122 17 22 2 0 4 4 0 518
9-<10 0 0 1 2 1 30 7 15 7 101 85 33 24 7 4 4 2 0 323
10-<11 0 0 2 3 4 49 5 23 37 14 494 98 158 44 12 222 99 2 1266
11-<12 0 0 0 0 0 0 0 0 0 0 1 15 10 6 6 2 6 0 46
12-<13 0 0 0 0 0 1 1 2 1 1 3 1 41 14 15 27 14 0 121
13-<14 0 0 0 0 0 0 0 0 1 0 0 0 0 8 7 2 6 0 24
14-<15 0 0 0 0 0 1 0 0 0 0 0 0 0 0 9 6 8 0 24
15-<16 0 0 0 0 1 6 0 1 0 0 5 0 2 1 1 98 132 0 247
>=16 0 0 5 1 0 7 2 3 0 0 19 0 1 0 0 16 804 13 871
Total 8 30 127 155 209 607 408 557 599 311 927 176 274 86 55 395 1085 16 6025
Note: Figures are based on sample observations
 
Table 5(b): Cross-tabulation of Number of Respondents by Current Inflation Perception and One Year Ahead Inflation Expectations: Jul-23
One Year Ahead Inflation Rate (per cent)
Current Inflation Rate (per cent)   <1 1-<2 2-<3 3-<4 4-<5 5-<6 6-<7 7-<8 8-<9 9-<10 10-<11 11-<12 12-<13 13-<14 14-<15 15-<16 >=16 No idea Total
<1 1 1 4 0 0 1 0 0 0 0 0 0 0 0 0 0 0 0 7
1-<2 9 8 10 6 0 4 1 0 0 1 0 0 0 0 0 0 0 1 40
2-<3 36 3 28 26 31 28 11 10 2 1 5 0 1 0 0 1 0 0 183
3-<4 30 3 2 26 23 31 17 11 13 8 11 1 1 0 0 2 0 0 179
4-<5 34 0 1 5 54 46 38 21 15 2 8 0 2 0 0 0 0 0 226
5-<6 116 0 2 4 15 182 90 157 111 35 199 9 16 6 2 30 16 0 990
6-<7 45 0 0 0 4 5 102 86 83 28 51 2 14 0 0 6 6 0 432
7-<8 50 0 0 1 2 5 6 108 104 80 117 15 21 2 2 4 11 0 528
8-<9 55 0 0 0 0 4 4 6 129 52 157 33 46 10 2 11 9 0 518
9-<10 31 0 1 0 1 21 3 6 10 62 74 34 43 10 9 11 7 0 323
10-<11 131 0 0 1 0 10 2 12 18 12 326 45 156 43 25 252 232 1 1266
11-<12 1 0 0 0 0 0 0 0 0 0 0 6 11 6 11 4 7 0 46
12-<13 12 0 0 0 0 0 0 0 0 0 0 0 26 7 15 36 25 0 121
13-<14 2 0 0 0 0 0 0 0 0 0 0 0 0 5 3 6 8 0 24
14-<15 2 0 0 0 0 0 0 0 0 0 0 0 0 0 5 7 10 0 24
15-<16 28 0 0 0 0 2 0 0 0 1 5 0 3 0 2 49 157 0 247
>=16 112 0 0 0 0 4 1 0 0 0 12 0 1 0 0 12 720 9 871
Total 695 15 48 69 130 343 275 417 485 282 965 145 341 89 76 431 1208 11 6025
Note: Figures are based on sample observations

1 The survey results reflect the respondents’ views, which are not necessarily shared by the Reserve Bank. Results of the previous survey round were released on the Bank’s website on June 08, 2023.

2 The survey is conducted at bi-monthly intervals by the Reserve Bank and it provides directional information on near-term inflationary pressures as expected by the respondents and may reflect their own consumption patterns. Hence, they should be treated as households’ sentiments on inflation. All estimates of inflation expectations are given in the form of medians, unless stated otherwise.

3 Unit-level data for previous rounds of the survey are available on the Database on Indian Economy (DBIE) portal of the Bank (weblink: https://dbie.rbi.org.in/DBIE/dbie.rbi?site=unitLevelData).

RbiTtsCommonUtility

PLAYING
LISTEN

Related Assets

RBI-Install-RBI-Content-Global

RbiSocialMediaUtility

Install the RBI mobile application and get quick access to the latest news!

Scan Your QR code to Install our app

RbiWasItHelpfulUtility

Was this page helpful?