 IST,
IST,
I Overview (Part 2 of 2)
Financial Sector
Global Economic Situation
External Sector
1.55 Financial markets remained calm over most of the year except for a brief period of volatility witnessed during the middle of September 2001 after the terrorist attack on the US. The call money rates were range-bound as the liquidity conditions were comfortable. The foreign exchange market exhibited stable conditions with capital inflows creating conditions of comfortable supply. There was a fall in the yields across all maturities in the Government securities market. Reflecting the general economic conditions and the growing cross-border integration, the capital market was subdued during the first half of the year, with signs of moderate recovery emerging only during the third quarter of 2001-02.
Call Money Market
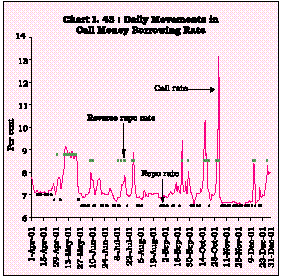
1.56 The money market conditions remained comfortable during 2001-02 (up to December) with the Reserve Bank continuing to modulate liquidity appropriately in tune with underlying real and financial developments. The transition to the second stage of the LAF, introduced with effect from May 8, 2001 was smooth and barring a few exceptions, the overnight call money rate remained around 7.0 per cent, well within the repo-reverse repo corridor (Chart I.42). Ample liquidity conditions prevailed on account of the strong mobilisation of bank deposits without any commensurate off-take of non-food credit. The reduction in the CRR also enhanced liquidity in the system.
1.57 The current financial year commenced with the usual comfortable liquidity conditions up to May 8, 2001 reflecting seasonal easing of liquidity. The weighted average call money borrowing rate hovered slightly above 7.0 per cent during April 2001 edging beyond only in the first week of May 2001. The repo and reverse repo cutoff rates declined by 25 basis points each to 6.75 per cent and 8.75 per cent, respectively, reflecting easy conditions. The weighted average call money borrowing rate spurted to 9.13 per cent on May 9, 2001 and remained above the ceiling of the repo-reverse repo corridor till May 19, 2001 under the second stage of LAF as a result of the floatation of State government loans and the rally in the Government securities market. A series of liquidity injections in the form of reverse repos (averaging an outstanding amount of around Rs.3,340 crore during May 8-25, 2001) as well as a cut in the CRR by 50 basis points to 7.5 per cent of net demand and time liabilities, effective May 19, 2001 could nudge the call rates back to the corridor by May 21, 2001 (Chart I.43).
1.58 The liquidity conditions remained comfortable throughout June-December barring stray spurts in the call money rate. The repo cut-off rate was further reduced by 25 basis points to 6.5 per cent on May 28, 2001 and the reverse repo cut-off rate was also reduced by 25 basis points to 8.5 per cent on June 7, 2001. Low advance tax outflows enabled the average of weighted average call money borrowing rates to remain comfortable around 7.2 per cent during June 2001, contrary to the usual seasonal pattern. The Reserve Bank absorbed excess liquidity through repos. Redemption payments augmented market liquidity and ensured easy call rates in July-August 2001. Excess liquidity was absorbed through repos as well as open market sales.
Notwithstanding the uncertainty created by the external disturbance of September 11, 2001, the weighted average call money rates remained within the repo-reverse repo corridor during the month, hardening somewhat to 9.4 per cent on September 21, 2001 in consonance with turbulence experienced in equity and foreign exchange markets. There was some tightness in liquidity experienced during October 16-19, 2001. The weighted average call money rates moved above the reverse repo cut-off rate mainly on account of a series of outflows (Rs.8000 crore on account of the twin gilt auctions held on October 15, 2001 and T-bills auctions) and the usual pressures from fulfilling the reporting requirements for maintenance of the CRR in the second week of the reporting fortnight. Thereafter, the average of the call money borrowing rate (weighted average) remained within the informal corridor.
1.59 The money market conditions were strained in the second week of the fortnight ending November 2, 2001 as market participants rushed to fulfill their reporting requirements. The call money borrowing rate shot up to an intra-day high of 22.0 per cent with the weighted average-rate also peaking for the year to 13.1 per cent as on November 2, 2001. Liquidity was injected with the outstanding amount of reverse-repo averaging at Rs.5,917 crore during October 30-November 2, 2001. Liquidity conditions improved with the first CRR cut becoming effective and the weighted average call money borrowing rate dropped to 6.9 per cent on November 3, 2001. Liquidity was further augmented in the system with inflow of funds in the form of coupon and redemption receipts as well as unsterilised expansion in the net foreign exchange assets of about Rs.8000 crore (net of revaluation). Heavy subscriptions in the repo auctions reflected considerable easing of liquidity conditions and the weighted average call money borrowing rate hovered mostly around 6.6 per cent.
1.60 The call money rates remained generally comfortable during December 2001. There was, however, a spurt during December 12-14, 2001 as well as some hardness in the call rates towards the end of the month. The liquidity conditions tightened in the first instance on account of outflows towards the twin gilt auctions in the first week of December 2001 amounting to Rs. 6,000 crore and open market sales (gross) of around Rs. 7,863 crore during the first fortnight of December 2001. The pressure of fulfilling the reporting requirements towards the second week of the reporting fortnight ended December 14, 2001 took the intra-day high rate beyond the repo-reverse repo corridor prompting some liquidity injection through reverse repos. After reverting to the corridor with the commencement of the new reporting fortnight, call rates hardened towards the end of December 2001 due to advance tax outflows and the intra-day high touched 12.0 per cent on December 28, 2001. As the second cut of 25 basis points in the CRR became effective from fortnight beginning December 29, 2001, the call rates declined. The weighted average call money rates remained, however, within the corridor during December 2001.
Foreign Exchange Market
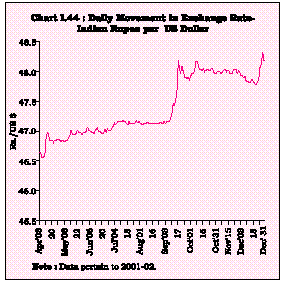
1.61 The foreign exchange market generally exhibited stable conditions during April-December, 2001-02 on account of comfortable supply position due to inflows on account of FIIs, FDI, non-resident deposits and raising of resources from abroad through ADR/GDRs by Indian corporates. The exchange rate of the rupee moved within a range of Rs.46.56-Rs.48.34 per US dollar during this period, abstracting from minor episodes of sporadic volatility mainly on account of uncertain market sentiment, high oil prices and political events. The exchange rate of the rupee which stood at Rs.46.64 per US dollar as at end-March 2001 depreciated marginally by 1.1 per cent to Rs.47.15 per US dollar at end-August 2001. The downgrading of India's sovereign outlook in August 2001 from stable to negative by two international rating agencies, however, failed to have any significant impact on the market (Chart I.44).
1.62 The foreign exchange market witnessed some uncertainty during September 2001, after the terrorist attacks in the US on September 11, 2001. The market sentiment was adversely affected by fears of US reprisal, deceleration in FII inflows after the attack and a further slowdown in India's exports. As a result, the Indian rupee experienced a depreciation from Rs.47.45 per US dollar on September 11, 2001 to Rs.48.18 per US dollar on September 17, 2001. Normalcy soon returned in the foreign exchange market. In October and November 2001, the foreign exchange market witnessed stable conditions amidst steady supply of dollars and modest corporate demand. Net FII investment, which turned negative during September 2001, resumed since October 2001 buoyed by the decision to increase the FII investment limit up to the sectoral cap/ statutory ceiling of FDI, as applicable. The foreign exchange market witnessed heightened activity during the last week of December 2001, which led to depreciation of rupee by 0.4 per cent to close the month of December 2001 at Rs.48.18 per US dollar.
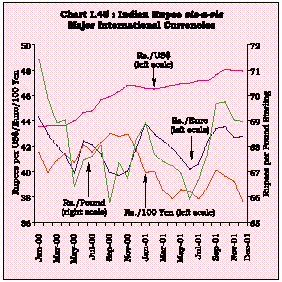
1.63 Against other major currencies like euro, pound sterling and Japanese yen, the exchange rate of the rupee appreciated since October 2001; the rupee had depreciated significantly against these currencies during the period July to September 2001 (Chart I.45).
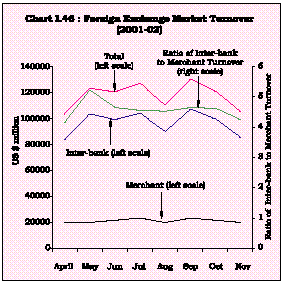
1.64 In the foreign exchange market, the average monthly total turnover increased to US $ 119 billion during 2001-02 (April-September 2001), from US $ 116 billion in 2000-01. Monthly turnover in the merchant segment of the foreign exchange market moved within the range of US $ 19.8-23.1 billion, while in the inter-bank segment, the turnover moved in a range of US $ 83.5-107.6 billion during the first two quarters of the year 2001-02. There was some decline in the market turnover during October and November 2001. The ratio of inter-bank to merchant turnover, an indicator of hedging activity in the market hovered around 4, indicating orderly conditions (Chart I.46).
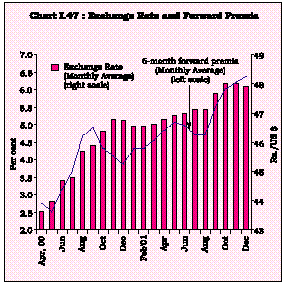
1.65 The forward premia ruled easy for the first five months of 2001-02. The market tightened in the aftermath of the terrorist attack in the US and the disturbances in Afghanistan, with the 3-month and the 6-month forward premia hardening to 6.02 per cent and 6.03 per cent, respectively, in October 2001 from 4.5 per cent and 4.7 per cent, respectively, in August 2001 (Chart I.47). The 3-month and 6-month forward premia further hardened to 6.34 and 6.36 per cent, respectively, during December 2001.
Government Securities Market
1.66 The Government securities market was driven by easy liquidity conditions facilitated by monetary easing. Furthermore, the series of interest rate cuts in the developed economies fuelled expectations of similar interest cuts in India and turned the domestic gilt market sentiment buoyant. Gilt prices surged across the spectrum with the yields of dated securities of 5-year, 10-year, 15-year and 20-year maturity declining by 226 basis points, 217 basis points, 217 basis points and 234 basis points, respectively, to 7.14 per cent, 7.91 per cent, 8.23 per cent and 8.36 per cent, respectively, during 2001-02 (up to November 30). However, the gilt market exhibited considerable volatility in December 2001. The yields across the entire maturity spectrum hardened by end-December 2001. The comfortable liquidity conditions enabled the Central Government to complete net market borrowings of Rs.79,002 crore (around 102 per cent) and gross market borrowings of Rs.1,16,002 crore (around 98 per cent) by December 28, 2001 with a sizeable amount raised in the early part of the year itself in the face of sluggish demand for non-food credit.
1.67 In the primary market, the Central Government completed around a quarter of its budgeted gross market borrowing programme for 2001-02 during April 2001 itself with ratio of bid amount/notified amount (BA/NA) of 1.7 reflecting favourable market response. The BA/ NA ratio remained more than unity at each of the auctions during 2001-02 (upto December). About 25 per cent of the Centre's fresh gross borrowing was privately placed with /devolved on the Reserve Bank. In order to neutralise the monetary impact of private placements, the Reserve Bank conducted outright OMO sales (net) of Rs.30,187 crore (up to December 28). The Central Government was able to elongate its weighted average maturity of borrowing to 14.1 years so far in 2001-02 (up to December) from 10.6 years last year. The Central Government auctioned a security with the longest tenor of 25-year on September 11, 2001 for a notified amount of Rs.2,000 crore which received a bid of Rs.3,844 crore. Apart from lengthening the maturity, the Government was able to reduce its cost of borrowing with the weighted average yield on borrowings being lower by more than 100 basis points at 9.7 per cent as against around 11.0 per cent last year. The Central Government auctioned Floating Rate Bonds 2006 for the first time on November 21, 2001 for Rs.2,000 crore with the interest rate of the bond having two components, viz., a variable base rate linked to the 364-day Treasury Bill rate (average implicit yield in the immediate previous six auctions held prior to the relative half-year coupon period) and a fixed mark-up decided in the auction. A substantially high bidding amount in this auction reflected market propensity to a floating interest rate paper.
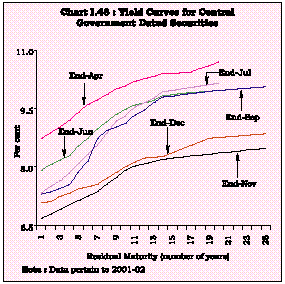
1.68 In the secondary gilt segment, there was a persistence of the rally in prices except for brief halts in July, September and December 2001 (Chart I.48). The easy liquidity conditions coupled with a softer interest rate environment enabled a reduction in the yields throughout the maturity spectrum, more prominently at the short-end, during April-June 2001. The rally was, however, arrested by the Reserve Bank's open market sales auction on July 12, 2001. Sentiment turned bearish for the securities at the long-end and there was a switch towards securities of short-tenor. During July 2001 the yield curve steepened with yields of gilts of 5-year and 10-year residual maturities moving down by 46 basis points and 18 basis points, respectively, while those of 15-year and 20-year residual maturities hardened by 11 basis points and 18 basis points, respectively. The easing of liquidity conditions and expectations of an interest rate cut amidst a softer international interest rate environment resumed the rally in the gilt market in August 2001.
1.69 The gilt market continued to evince interest for securities of short and medium-tenors in early-September with some uncertainty in the foreign exchange market adding a note of caution. Subsequent to the terrorist attack in the US, the gilt market turned bearish. A series of open market purchases amounting to Rs.5,084 crore were conducted to provide support to the gilt prices throughout the maturity spectrum and ensured stability in gilt prices during the month.
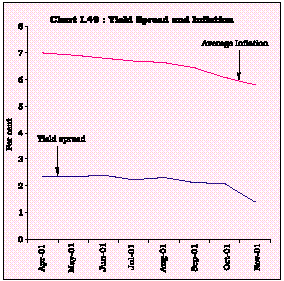
1.70 International interest rates continued to soften in October, 2001. Measures announced in the mid-term review of monetary and credit policy for 2001-02 fuelled a resurgence in the gilt prices throughout the maturity spectrum in October and November 2001. Amidst easy liquidity conditions, the yield level of the security of the longest tenor, i.e., 25-year, declined by 127 basis points to 8.5 per cent during November 2001. The yield on the benchmark 10-year paper touched a historic low of 7.8 per cent on December 5, 2001. Subsequently, the OMO sales checked further rally and made the gilt prices range-bound. The bid-ask spread in the government securities market widened and turnover in the dated securities market fell sharply from Rs. 74,888 crore during the week ended December 7 to Rs. 22,161 crore during the week ended December 21, 2001. The yield curve shifted up by end-December 2001 in relation to a month ago with the yields moving up especially for short and long-tenors. While the yields of the securities with 5-year and 20-year tenors hardened sharply by 31 basis points and 40 basis points, respectively, the yield on the 10-year benchmark security moved up by 9 basis points during December 2001. During 2001-02 (up to November), the yield spread (difference between yields of 10-year Government securities on residual maturity basis and 91-day Treasury Bills) has moved synchronously with the path of the average inflation rate (Chart I.49).
Capital Market
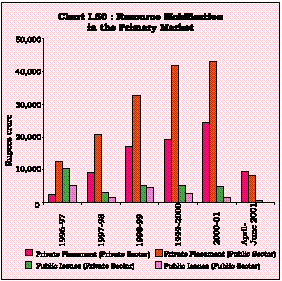
1.71 The capital market remained subdued for the greater part of 2001-02, reflecting the general economic conditions as well as the co-movement with international stock exchanges. Resource mobilisation from the new issues market continued to be depressed in line with recent trends. The private placement market, which has witnessed a manifold increase over the public issues market in recent years, continued to record substantial growth. During 2001-02 (up to June), the private placement market witnessed increased activity as Rs.17,657 crore was raised, registering a growth of 91.7 per cent as compared with Rs.9,213 crore raised during the comparable quarter of the previous year (Chart I.50).
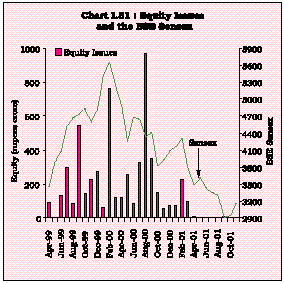
1.72 The public issues market witnessed depressed conditions during 2000-01 (up to November) as only nine issues aggregating Rs.2,023 crore were floated by the non-Government public limited companies (private sector) as compared with Rs.3,266 crore raised through 116 issues during April-November 2000 and Rs.4,924 crore raised through 142 issues during the full year 2000-01. There were only three equity issues aggregating Rs.21 crore during 2001-02 (up to November) as compared with 110 equity issues aggregating Rs.2,261 crore during the corresponding period of the previous year, reflecting the downturn in capital market conditions (Chart I.51). Despite lower resource mobilisation, the average issue size increased sharply to Rs.225 crore from Rs.28 crore during the corresponding period of the previous year. Five bond issues from the ICICI of Rs.400 crore each constituted 98.9 per cent of the total resource mobilisation during April-November 2001. There was no issue from the public sector as against three issues aggregating Rs.772 crore during April-November 2000 and five issues aggregating Rs.1,472 crore during the full financial year 2000-01.
1.73 With a view to containing risks arising out of non-SLR investments' portfolio of banks and FIs, the mid-term review of monetary and credit policy for the year 2001-02 proposed to introduce further guidelines covering such aspects as strengthening of the internal rating system, fixing of prudential limits with separate sub-limits for unrated, unquoted and privately placed instruments, review by board in respect of issuers and non-performing investments and disclosures regarding issuer composition and non-performing investments, etc.
1.74 According to the SEBI, net resource mobilisation by mutual funds, at Rs.8,744 crore during April-November 2001, increased by 28.6 per cent as compared with Rs.6,800 crore during the comparable period of the previous year and Rs.9,128 crore during the full year 2000-01, mainly due to the substantial funds raised by the debt-oriented schemes. The Unit Trust of India (UTI), however, witnessed a net outflow of Rs.5,046 crore during the year. The share of resource mobilisation as well as assets under management by the private sector increased during the second half of the 1990s, while that of UTI declined.
1.75 Financial assistance sanctioned and disbursed by the term-lending institutions at Rs.52,123 crore and Rs.37,367 crore, respectively, declined sharply by 26.9 per cent and 9.7 per cent, respectively, during April-November 2001 as compared with 12.3 per cent and 12.0 per cent growth, respectively, during the corresponding period of the previous year, largely reflecting the persistence of the industrial slowdown.
Secondary Market
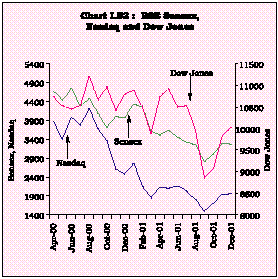
1.76 The equity markets began the year on a depressed note with the BSE Sensex sliding below the 3500 mark by June 2001 and declined further to touch 3245 by end-August 2001 (Chart I.52). Market sentiment was dampened by certain adverse developments in domestic stock exchanges including apprehensions of payment difficulties (in March 2001) notwithstanding a market-friendly Union Budget 2001. The market was also adversely affected by the continuing decline in the Nasdaq, recessionary global conditions and the domestic economic slowdown. The ban announced by the UTI on the sale and repurchase of US-64 units in July 2001 also had a dampening effect on the market.
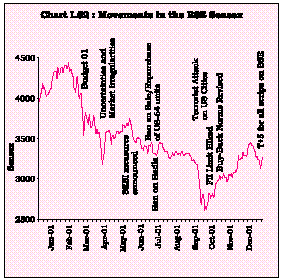
1.77 The markets witnessed a sharp downturn in September 2001 mirroring global reactions to the September 11, 2001 terrorist attacks on the US (Chart I.53). The BSE Sensex declined by 17.5 per cent to 2600 on September 21 - the lowest level since September 8, 1993. The Reserve Bank permitted banks to extend finance to stockbrokers for margin trading on September 18, 2001 and hiked FII investment limit from 49 per cent to sectoral limits allowed for FDI.
1.78 The stock markets recovered somewhat in October 2001 (with the BSE Sensex crossing the psychological 3000 mark for the first time on October 16, 2001 in intra-day trading) and November 2001, especially as fears relating to the disturbances in Afghanistan were discounted. Besides, the stronger-than-expected second quarter results of some major corporates, especially in the software sector, improved the market sentiment. Policy measures such as the Government's long awaited move to relax share buy-back up to 10 per cent with board approval instead of the shareholders’ approval needed earlier, monetary easing (in October 2001) and introduction of stock futures in 31 scrips by the SEBI (in November 2001) also buoyed markets. The BSE Sensex showed a steady rise to 3288 by end-November 2001 and 3443 as on December 10, 2001. Reflective of this, the turnover in the BSE rose to Rs.24,402 crore in November 2001 from Rs.21,593 crore in September 2001. However, the rally was somewhat arrested in December 2001 in the wake of a weakening market sentiment.
1.79 The monthly average of BSE Sensitive Index, which stood at 5262 during March 2000 declined to 3808 during March 2001 and declined further to 2918 during September 2001 but thereafter recovered to 3315 during December 2001. The volatility in share prices as measured by the coefficient of variation, at 7.6 per cent during April-December 2001, was lower than 9.0 per cent during the corresponding period of the previous year.
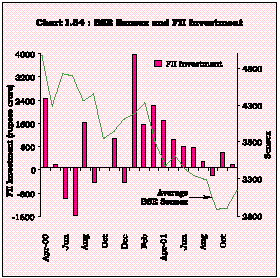
1.80 Foreign Institutional Investors’ (FIIs) investments increased to Rs.5,116 crore during April-November 2001 as compared to Rs.2,394 crore during the corresponding period of the preceding year (Chart I.54). Net FII inflows in equity markets remained positive during 2001 so far with the exception of September 2001. In contrast, the mutual funds remained net sellers in equity markets during 2001 so far, with the exception of September 2001.
1.81 On May 14, 2001 the SEBI announced a ban on all deferral products in the cash segment including badla from July 2001 with a view to segregating the cash and futures market and introduced rolling settlement in the active scrips along with some other significant changes in the capital market in keeping with the international practices. On December 19, 2001, the SEBI announced that the T + 5 rolling settlement cycle would further be shortened to T + 3, effective April 1, 2002. On December 31, 2001 all the scrips listed on the BSE moved to compulsory rolling settlement mode.
Scheduled Commercial Banks (SCBs)
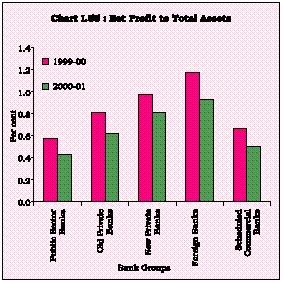
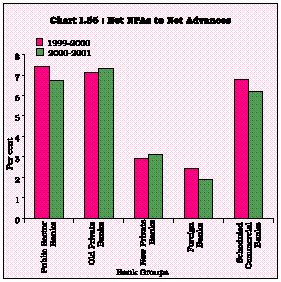
1.82 During the financial year 2000-01, SCBs recorded a 7.9 per cent increase in operating profits which went up to Rs.19,747 crore as on March 31, 2001. Net profits, however declined by 11.3 per cent to Rs.6,424 crore as on March 31, 2001, driven by the increase in provisions partly offset by higher operating profits. The ratio of net profit to total assets of SCBs declined from 0.66 per cent in 1999-2000 to 0.50 per cent in 2000-01 (Chart I.55). As at end-March 2001, gross non-performing assets (NPAs) as a percentage of total assets for SCBs declined to 4.9 per cent from 5.5 per cent as at end-March 2000. As a share of gross advances, gross NPAs of SCBs declined to 11.4 per cent as at end-March 2001 from 12.7 per cent in the previous year. The ratios of net NPAs to total assets and net advances declined to 2.5 per cent and 6.2 per cent, respectively, as at end-March 2001 from 2.7 per cent and 6.8 per cent, respectively, as at end-March 2000 (Chart I.56).
1.83 As at end-March 2001, 84 out of 100 SCBs recorded capital to risk-weighted asset ratio (CRAR) in excess of 10 per cent. Eleven banks had CRAR between 9 per cent and 10 per cent, while five banks had CRAR below the 9 per cent mark.
Co-operative Banks
1.84 At the end of March 2001, the number of urban co-operative banks (UCBs) stood at 2,084, of which 90 were salary earners' banks. Information on the financial performance relating to profits/losses during 1999-2000 are available for 1,747 banks, which roughly cover 84 per cent of the total UCBs. Of these UCBs, 1,499 banks registered profits while the rest incurred losses.
Scheduled UCBs
1.85 Total deposits and advances of the 51 scheduled UCBs as at end-March 2001 were Rs.33,164 crore and Rs.21,511 crore, respectively. The total income increased by 17.2 per cent during the financial year 2000-01. Interest income contributed 93.3 per cent of the total income of the scheduled UCBs. The total expenditure of the scheduled UCBs increased by 49.7 per cent in 2000-01.
Financial Institutions
1.86 The profitability analysis of the 10 FIs indicates that the combined net profits of these institutions registered a decline of 35.1 per cent during the year 2000-01. The ratios of net NPA to net loans as on March 31, 2001 in respect of ICICI, Small Industries Development Bank of India (SIDBI) and EXIM Bank were below 10 per cent, while that of Industrial Finance Corporation of India (IFCI), Industrial Development Bank of India (IDBI), Industrial Investment Bank of India (IIBI), and Tourism Finance Corporation of India (TFCI) ranged between 14-23 per cent. The CRARs of all the financial institutions (except IFCI) were well above the benchmark minimum of 9.0 per cent.
Non-Banking Financial Companies (NBFCs)
1.87 As at end-March 2000, the total quantum of outstanding public deposits reported by 1,005 reporting companies, was Rs.19,342 crore, equivalent to 2.2 per cent of the aggregate deposits (Rs.8,96,696 crore) of scheduled commercial banks. The aggregate assets of the NBFC sector increased to Rs.51,324 crore as on March 31, 2000, from Rs.47,049 crore, as on March 31, 1999. Some of the companies have converted themselves into non-deposit-holding companies by repaying the deposits held by them. At the disaggregated level, public deposits with the hire purchase companies and residuary non-banking companies (RNBCs) increased by 22.3 per cent and 3.4 per cent, respectively.
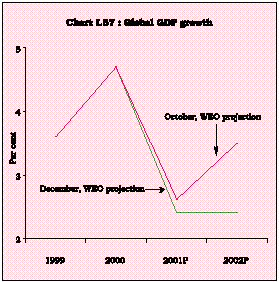
1.88 The deceleration in the global economy which started during the second half of 2000 deepened during 2001 with all the major regions of the world (excluding Africa) exhibiting a synchronised slowdown. The IMF revised downwards growth projections for the global economy in 2001 for the third time in December 2001 from 3.2 per cent (in May 2001) to 2.6 per cent (in October 2001) and finally, after incorporating the impact of the terrorist attack on the US on September 11, 2001, to 2.4 per cent i.e., half the level of growth recorded in 2000 (4.7 per cent) (Table 1.10 and Chart I.57). The recovery is now expected to be delayed well into the second half of 2002 with the uncertainties associated with the terrorist attack further compounding the existing risks to the global economy.
(Annual percentage change) | ||||||||
December Projections | Difference from October | |||||||
| | | | | 2001 Projections | ||||
| | 1999 | 2000 | 2001 | 2002 | 2001 | 2002 | ||
1 | 2 | 3 | 4 | 5 | 6 | 7 | ||
World Output | 3.6 | 4.7 | 2.4 | 2.4 | -0.2 | -1.1 | ||
Advanced Economies | 3.3 | 3.9 | 1.1 | 0.8 | -0.2 | -1.3 | ||
Developing Countries | 3.9 | 5.8 | 4.0 | 4.4 | -0.4 | -0.9 | ||
World Trade (Volume) | 5.4 | 12.4 | 1.0 | 2.2 | -1.8 | -3.1 | ||
Oil Prices (US dollar) | 37.5 | 56.9 | -14.0 | -23.7 | -9.1 | -15.1 | ||
Non-Oil Commodity Prices (US dollar) | -7.0 | 1.8 | -5.5 | 1.7 | -2.8 | -2.7 | ||
Source : World Economic Outlook, IMF, December 2001. | ||||||||
1.89 The impact of the global slowdown has been manifested in several associated developments: (i) growth in world trade volume (goods and services) which was projected in October 2001 to decelerate from 12.4 per cent in 2000 to 2.7 per cent in 2001 may suffer a further deceleration following the terrorist attack to 1.0 per cent (WEO, December 2001) owing to increased cost of transportation of goods and the expected further deceleration in economic activity; (ii) the positive effect of declining international interest rates on capital flows to emerging markets has been more than off-set by rising risk aversion of investors and deteriorating economic fundamentals in some of the emerging markets; (iii) there has been an accumulation of large scale macroeconomic imbalances with exchange rate misalignments; and (iv) there are distinct prospects of some deterioration in the terms of trade of developing countries.
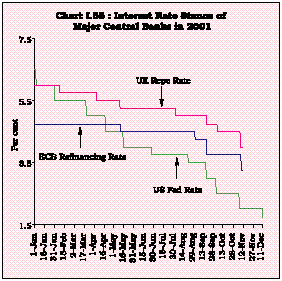
1.90 A number of steps to counter the slowdown have been taken. Monetary policy in industrial countries has been eased considerably. The US Federal Reserve has lowered the federal funds rate eleven times during 2001 by 475 basis points (four times -cumulatively by 175 basis points after September 11) and is now at its lowest level (1.75 per cent). Similarly, the European Union and the UK have lowered the key policy rates (main refinance rate and repo rate, respectively) by 150 basis points and 200 basis points, respectively, during 2001 (100 basis points each in the post-terrorist attack phase) (Chart I.58). Japan has also lowered its official discount rate to near zero level (0.10 per cent) after the attack.
1.91 Emerging Asian economies have exhibited sharp slowdown in industrial production and exports since mid-2000. Besides the impact of global slowdown and the electronics cycle, political uncertainties and weakening confidence on account of slow paced structural reforms have contributed to the deceleration. The possibilities of a prolonged downturn in the US, a lagged recovery in the technology sector and the recession in Japan could further worsen emerging market growth prospects. Net capital flows to the emerging markets are projected to remain weak with modest recovery in 2001 (Chart 1.59)
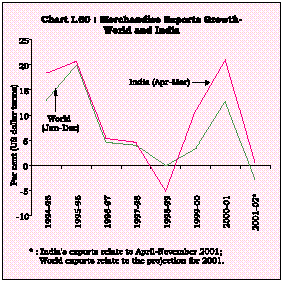
1.92 Reflecting the downturn in global economic activity, India's exports, which recorded a strong growth of 21.0 per cent in US dollar terms during 2000-01, increased marginally during the current fiscal year so far (April-November 2001) (Chart I.60). Provisional data of the Directorate General of Commercial Intelligence and Statistics (DGCI&S) for April-November 2001 show that exports at US $ 28.9 billion increased by 0.5 per cent as against an increase of 21.0 per cent during the comparable period of the previous year (Table 1.11).
(US $ Million) | ||||||||
1999-2000 | 2000-01 | 2000-01* | 2001-02* | |||||
Item | | (April-March) | (April-November) | |||||
1 | | 2 | 3 | 4 | 5 | |||
Exports | 36,822 | 44,560 | 28,729 | 28,864 | ||||
(10.8) | (21.0) | (21.0) | (0.5) | |||||
(a) Oil | 39 | 1,870 | 993 | 1,443 | ||||
(-56.5) | (4709.7) | (3205.2) | (45.2) | |||||
(b) Non-Oil | 36,784 | 42,691 | 27,735 | 27,421 | ||||
(11.0) | (16.1) | (17.0) | (-1.1) | |||||
Imports | 49,671 | 50,536 | 34,317 | 34,718 | ||||
(17.2) | (1.7) | (7.4) | (1.2) | |||||
(a) Oil | 12,611 | 15,650 | 11,361 | 9,844 | ||||
(97.1) | (24.1) | (71.3) | (-13.4) | |||||
(b) Non-Oil | 37,059 | 34,886 | 22,956 | 24,874 | ||||
(3.0) | (-5.9) | (-9.3) | (8.4) | |||||
Trade Balance | -12,848 | -5,976 | -5,588 | -5,854 | ||||
(a) Oil | -12,573 | -13,780 | -10,368 | -8,401 | ||||
(b) Non-Oil | -276 | 7,804 | 4,779 | 2,547 | ||||
* Provisional | |||||
Note | :Figures in brackets relate to percentage variation over | ||||
the corresponding period of the previous year. | |||||
Source | :DGCI & S. | ||||
1.93 Imports at US $ 34.7 billion during April-November 2001 showed a lower order of increase of 1.2 per cent as compared with that of 7.4 per cent during the corresponding period of the previous year, reflecting the decline in oil imports (13.4 per cent) as also the subdued overall domestic demand. The trade deficit increased to over US $ 5.8 billion during April-November 2001 from that of about US $ 5.6 billion during the corresponding period of the previous year.
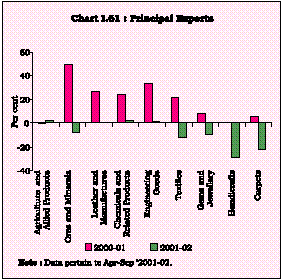
1.94 Detailed commodity/country-wise trade data are available only for the period April-September 2001. Although a general decline in the exports was observed across most of the commodity-groups, some of the major groups such as 'agriculture & allied products', 'chemicals and related products', and 'engineering goods' recorded positive growth (Chart I.61 and Table 1.12).
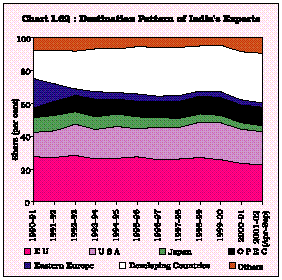
1.95 Destination-wise data on exports clearly brings out the role of external demand in shaping India's export performance. Given the severe recession in several advanced economies, India's exports to the OECD group declined by 12.6 per cent during April-September 2001 as against an increase of 16.9 per cent recorded during the corresponding period of the previous year. Within the OECD group, exports to the USA and Japan fell by 15.1 per cent and 16.3 per cent, respectively, during April-September 2001.
(Per cent) | ||||||||
Item | (April-March) | (April-September) | ||||||
| | | | 1999-00 | 2000-01P | 2000-01 | 2001-02P | ||
| | | 1 | 2 | 3 | 4 | 5 | ||
I. | Primary Products | -5.8 | 9.8 | 5.6 | 0.1 | |||
(a) | Agriculture and Allied Products | -7.1 | 7.0 | -0.7 | 1.7 | |||
(b) | Ores and Minerals | 2.5 | 26.4 | 49.4 | -7.5 | |||
II. | Manufactured Goods | 15.2 | 16.1 | 20.5 | -6.4 | |||
of which: | ||||||||
(a) | Leather and Manufactures | -4.2 | 22.7 | 27.2 | -0.1 | |||
(b) | Chemicals and Related Products | 17.4 | 25.1 | 24.0 | 2.5 | |||
(c) | Engineering Goods | 15.4 | 33.2 | 33.8 | 1.3 | |||
(d) | Textiles | 9.9 | 17.9 | 21.9 | -12.4 | |||
(e) | Handicrafts | 5.6 | 0.0 | 0.5 | -28.7 | |||
(f) | Gems and jewellery | 26.5 | -1.5 | 8.3 | -9.4 | |||
(g) | Carpets | 18.7 | -9.8 | 5.7 | -22.3 | |||
III. | Petroleum Products | -56.5 | 4709.7 | 1814.8 | 89.7 | |||
| | Total Exports | 10.8 | 21.0 | 21.2 | -2.0 | |||
P :Provisional | ||||||||
Source :DGCI & S. | ||||||||
Exports to Eastern Europe also declined by 6.1 per cent during this period. Exports to other regions, however, showed positive growth. Exports to the developing countries, which have gained considerable prominence over the years as a destination of India's exports, recorded a growth of 7.6 per cent during April-September 2001 (Chart I.62). The growth rates of exports to some of the Asian countries showed sharp improvement during April-September 2001 vis-a-vis the corresponding period of the previous year.
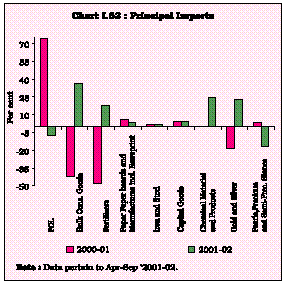
1.96 Commodity-wise data on imports reveal that the overall 2.0 per cent increase in imports during April-September 2001 was mainly on account of the sharp 22.2 per cent increase in the imports of gold and silver, which accounted for as much as 10.1 per cent of total imports during this period. Non-oil imports, excluding gold and silver, increased by 4.2 per cent during this period. Among the major import items, sharp declines occurred in respect of cashew nuts (67.1 per cent), 'pearls, precious and semi-precious stones' (16.7 per cent) and fertilisers (18.1 per cent). The imports of some of the industry-related items, however, showed sharp increases; 'metalliferrous ores and metal scraps' (60.9 per cent), 'electrical machinery except electronics' (40.8 per cent), 'textile yarn, fabrics etc.' (28.3 per cent), 'non-metallic mineral products' (27.0 per cent), and 'chemical materials and products' (24.1 per cent). The import of bulk consumption goods rose by 36.9 per cent, mainly on account of the substantial increase in the import of pulses (550.8 per cent) reflecting the shortfall in domestic production vis-a-vis growing demand (Chart I.63 and Table 1.13).
(Per cent) | ||||||||
Item | April-March | April-September | ||||||
| | | 1999-00 | 2000-01* | 2000-01 | 2001-02* | |||
| | 1 | 2 | 3 | 4 | 5 | |||
1. | Petroleum, Crude and Products | 97.1 | 24.1 | 74.6 | -7.1 | |||
2. | Bulk Consumption Goods | -4.3 | -40.7 | -42.4 | 36.9 | |||
3. | Fertilisers | 30.0 | -46.7 | -48.4 | -18.1 | |||
4. | Non-Ferrous Metals | -8.5 | -3.8 | 6.5 | 17.6 | |||
5. | Paper, Paperboards, Manufactures including Newsprint | -3.8 | 0.7 | 5.7 | 3.1 | |||
6. | Crude Rubber including Synthetic and Reclaimed | -1.5 | 5.4 | 24.2 | 6.8 | |||
7. | Pulp and Waste Paper | 8.3 | 9.3 | 9.8 | -5.6 | |||
8. | Metalliferrous Ores and Metal Scrap | 20.8 | -14.3 | -3.9 | 60.9 | |||
9. | Iron and Steel | -10.5 | -18.7 | 2.0 | 2.1 | |||
10. | Capital Goods | -10.9 | -2.0 | 4.1 | 3.8 | |||
11. | Pearls, Precious and Semi-Precious Stones | 44.6 | -11.5 | 3.4 | -16.7 | |||
12. | Chemicals, Organic and Inorganic | 6.8 | -14.9 | -9.9 | 6.5 | |||
13. | Textile Yarn, Fabrics, etc. | 17.9 | 10.8 | 36.4 | 28.3 | |||
14. | Cashew Nuts, Raw | 20.1 | -23.8 | -0.9 | -67.1 | |||
15. | Gold and Silver | -7.2 | -5.9 | -18.9 | 22.2 | |||
16. | Artificial Resins and Plastic Materials | 6.5 | -23.0 | -21.4 | 5.2 | |||
17. | Coal, Coke and Briquittes etc. | 2.9 | 9.4 | 20.8 | -3.1 | |||
18. | Medicinal and Pharmaceutical Products | -2.9 | -0.1 | -0.4 | 0.5 | |||
19. | Chemical Materials and Products | -7.4 | -8.7 | -0.8 | 24.1 | |||
20. | Non-Metallic Mineral Manufactures | 2.2 | 5.3 | 11.6 | 27.0 | |||
Total Imports | 17.2 | 1.7 | 11.0 | 2.0 | ||||
* | : Provisional | |||||||
Source : DGCI & S. | ||||||||
1.97 The recently concluded Ministerial Conference of the World Trade Organisation (WTO) at Doha represents a major landmark in the progress towards equitable and multilateral rules for international trade. The deliberations of the Conference are expected to have important implications for developing countries including India (Box I.1).
1.98 Invisible earnings continued to provide significant support to India's balance of payments during the first half of 2001-02, though such earnings in net terms were marginally lower at US $ 5.3 billion during April-September 2001 as compared with US $ 5.6 billion during the corresponding period of the previous year. Private transfers from nonresident Indians were at US $ 5.9 billion as against US $ 6.7 billion in April-September 2000. Software exports rose by about 16.1 per cent to US $ 3.6 billion from US $ 3.1 billion in the first half of 2000-01. The sizeable increase in earnings from communication services, construction services, financial services, software services, management services etc., however, was partly offset by higher payments on account of financial services, management services, office maintenance, royalties, license fees etc., resulting in a lower net miscellaneous earnings to the tune of US $ 705 million during April-September, 2001 as compared with US $ 1,341 million during the corresponding period in the previous year (Table 1.14).
The Doha Ministerial Conference - An Indian Perspective
The Fourth Ministerial Conference of the World Trade Organisation (WTO), took place during November 9-14, 2001 at Doha, Qatar. During the run-up to the Conference and during the actual deliberations at Doha, India’s stand on the principal issues was:
- The high level of protection provided to trade in agriculture by many developed countries be removed as they hurt the farm exports of developing countries. Adequate flexibility should also be provided to developing countries to take care of their concerns relating to food and livelihood security and rural development.
- Implementation issues of concern to the developing countries be satisfactorily addressed and non-trade related issues to be kept out of the agenda for negotiation.
- New issues (or Singapore issues) like investment, competition policy, trade facilitation and transparency in government procurement should not be brought under the fold of the WTO.
- India opposed the broadening of the jurisdiction of the WTO on issues relating to trade and labour standards and trade and environment. According to India, the existing WTO rules are adequate to deal with all legitimate environment issues.
- The TRIPs Agreement to be interpreted and implemented in a manner supportive of WTO member’s right to protect public health and ensure access to medicines for all. WTO provisions on geographical indications for wines and spirits should be extended to other products and there should not be any misuse of the biological and genetic resources and traditional knowledge of the developing countries.
- The development deficit in various WTO Agreements to be recognised and necessary remedial action taken.
- Regarding market access, the issue of significant trade barriers in the form of tariff peaks and tariff escalation in the industrialised countries to be addressed as it affects exports of many developing countries.
The Doha Ministerial Declaration explicitly recognised that for effective functioning of the WTO it is crucial to safeguard the interests of the developing and least-developed countries. The Declaration also recognised the crucial role of the special and differential treatment extended to developing and least-developed countries within the WTO framework. Agreement has been reached to strengthen such provisions for more precise, effective and operational implementation. While upholding the right of the members to take measures to protect environment, it has been emphasised that such measures should be within the scope of the existing norms of the WTO. Similarly, the Declaration took note of the work in progress at the International Labour Organisation (ILO) for implementation of the core labour norms. Explicit cognizance has been taken of the concerns of the developing countries on the implementation issues. The Declaration also calls for removal of protectionism in trade in agricultural products and at the same time, recognises the non-trade concerns of the developing countries relating to agriculture. The Declaration on TRIPs also mirrors the concerns raised by the developing countries in the context of government action for maintenance of public health, extension of the scope of norms on geographical indicators and protection of traditional knowledge.
After the next Ministerial Conference, negotiations may take place in some of the issues relating to investment, competition and transparency in government procurement on the basis of explicit consensus among the members. The Declaration states that there would be negotiations on trade and environment without prejudging the existing WTO rules and specific trade obligations set out in multilateral environmental agreements. On the basis of the recommendations of the WTO Committee on Environment, the next Ministerial Conference would decide the future action including the desirability of negotiations on trade and environment. The Declaration has resolved to maintain the customs tax-free status of electronic commerce through electronic transmission.
Some of the implementation concerns raised by India have been adequately addressed in the Doha Declaration and the remaining items have been referred either to negotiations or to subsidiary bodies for further examination. The Declaration reaffirmed that that the International Labour Organisation (ILO) is the appropriate forum to address the core labour standards. The key concerns of India in agriculture have been adequately safeguarded in the Declaration.The special and differential treatment for developing countries including recognition of food security and rural development have now become an integral part of the mandated Agricultural Negotiations. In services, the movement of natural persons has been given primary focus apart from reaffirmation of the guidelines and procedures of negotiations. On the four Singapore issues, it was decided that the study process would continue until the fifth Ministerial Conference and decision regarding any negotiation would be based on explicit consensus. Negotiations have also been mandated under the Anti-dumping and Subsidies Agreements. The various implementation proposals on these subjects will also become part of the negotiations. There is a clear commitment to review the provisions for Special and Differential treatment for developing countries in various WTO agreements to see how these provisions can be strengthened, made more precise, effective and operational.
Reference
- Government of India, (2001), Statement by Shri Murasoli Maran, Minister of Commerce and Industry, Press Release dated November 22.
- World Trade Organisation, (2001), Preparations for the Fourth Session of the Ministerial Conference: Communication from India, WT/GC/W/459 (November 6).
- _________________(2001), India: Statement by Shri Murasoli Maran, Minister of Commerce and Industry, WT/ MIN(01)/ST/10, (November 10).
- _________________(2001), Ministerial Declaration, WT/ MIN(01)/DEC/1, (November 20).
(US $ million) | ||||||||
2000-2001 | 1999-2000 | April-September | ||||||
| | | | | 2001 | 2000 | |||
| | 1 | 2 | 3 | 4 | 5 | |||
Invisibles (Net) | 11,791 | 13,143 | 5,316 | 5,569 | ||||
a) | Services | 2,478 | 4,064 | 524 | 845 | |||
Travel | 294 | 897 | 101 | 50 | ||||
Transportation | -1,257 | -703 | -411 | -748 | ||||
Insurance | 135 | 109 | 19 | 70 | ||||
G.n.i.e | 316 | 312 | 110 | 132 | ||||
Miscellaneous | 2,990 | 3,449 | 705 | 1,341 | ||||
b) | Transfers | 13,134 | 12,638 | 6,046 | 6,791 | |||
Official | 336 | 382 | 111 | 122 | ||||
Private | 12,798 | 12,256 | 5,935 | 6,669 | ||||
c) | Income | -3,821 | -3,559 | -1,254 | -2,067 | |||
Investment income | -3,918 | -3,695 | -1,304 | -2,122 | ||||
| | Compensation to Employees | 97 | 136 | 50 | 55 | |||
G.n.i.e : Government not included elsewhere | ||||||||
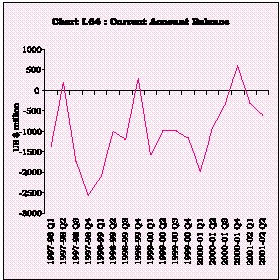
1.99 The current account deficit stood at US $ 0.9 billion during the first half of 2001-02 as against US $ 2.9 billion in April-September 2000 (Chart I.64).
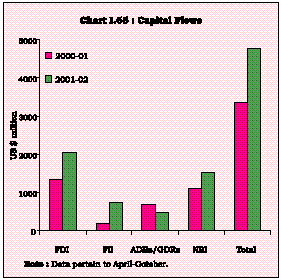
1.100 Capital account developments in April-October 2001 were indicative of continuing international confidence in the fundamentals of the Indian economy. Total foreign investment inflows during April-October 2001 stood at US $ 3.3 billion as against US $ 2.3 billion during the corresponding period of the previous year. Foreign direct investment (FDI) inflows during April-October 2001 were US $ 2.0 billion as compared with US $ 1.4 billion during the corresponding period of 2000-01. FII inflows amounted to US $ 0.7 billion during the first seven months (April-October) of 2001-02 as against US $ 0.2 billion during the corresponding period of 2000-01 (Table 1.15). Net inflows under NRI deposits during April-October, 2001 amounted to US $ 1.5 billion, as against US $ 1.1 billion during the corresponding period of the previous year (Chart I.65 and Table 1.16). The increase in capital inflows noticed during the first seven months of the current financial year is an encouraging development in the face of a global slowdown and subdued international capital mobility.
(US $ million) | ||||||||
Item | 2000-01P | 1999-2000 | April-October (P) | |||||
| | | | | 2001-02 | 2000-01 | |||
| | 1 | 2 | 3 | 4 | 5 | |||
A. | Direct Investment | 2,339 | 2,155 | 2,049 | 1,355 | |||
a) Government (SIA/FIPB) | 1,456 | 1,410 | 1,240 | 845 | ||||
b) RBI | 454 | 171 | 501 | 221 | ||||
c) NRI | 67 | 84 | 30 | 46 | ||||
d) Acquisition of shares * | 362 | 490 | 278 | 243 | ||||
B. | Portfolio Investment | 2,760 | 3,026 | 1,245 | 959 | |||
a) GDRs/ADRs # | 831 | 768 | 477 | 696 | ||||
b) FIIs @ | 1,847 | 2,135 | 729 | 189 | ||||
c) Off-shore funds and others | 82 | 123 | 39 | 74 | ||||
Total (A+B) | 5,099 | 5,181 | 3,294 | 2,314 | ||||
P | Provisional. | |||||||
* | Relates to acquisition of shares of Indian companies by non-residents under Section 5 of FEMA 1999. | |||||||
# | Represents the amount raised by Indian corporates through Global Depository Receipts (GDRs)/ American Depository Receipts (ADRs). | |||||||
@ | Represents net inflow of funds by Foreign Institutional Investors (FIIs). | |||||||
India’s External Debt
1.101 According to provisional data, India’s external debt at US $ 98.3 billion as at the end-June 2001 declined by 2.1 per cent from US $ 100.4 billion at end-March 2001. Componentwise analysis reveals that all components of external debt, except long-term non-resident deposits declined during the the first quarter of 2001-02. The consolidation of external debt was carried further during the quarter as indicated by key indicators of debt sustainability.
(US $ million) | ||||||||
Scheme | Variation @ | |||||||
April-October (P) | ||||||||
| | | 2000-01 | 1999-2000 | 2001-02 | 2000-01 | |||
1 | | 2 | 3 | 4 | 5 | |||
1. | FCNR(B) | 904 | 337 | 387 | 166 | |||
2. | NR(E)RA | 860 | 885 | 780 | 569 | |||
3. | NR(NR)RD | 553 | 318 | 355 | 390 | |||
Total | | 2,317 | 1,540 | 1,522 | 1,125 | |||
P | Provisional. | |||||||
@ | All the figures are inclusive of accrued interest | |||||||
and valuation arising on account of fluctuations | ||||||||
in non-dollar currencies against the US dollar. | ||||||||
The concessional debt as a proportion to total debt continued to be significant with a marginal increase to 36.5 per cent at end-June 2001 from 35.9 per cent at end-March 2001. The size of short-term debt remained modest both in regard to total debt and reserves. While the proportion of short-term to total debt declined to 3.2 per cent at end-June 2001 as against 3.4 per cent at end-March 2001; the ratio of short-term debt to foreign exchange reserves declined significantly from 8.2 per cent at end-March 2001 to 7.2 per cent at end-June 2001. (Table 1.17)
Item | At the end of | |||||||
June 2001 | March 2001 | Variation | ||||||
Amount | Share in | Amount | Share in | during the | ||||
(US $ million) | total debt | (US $ million) | total debt | quarter | ||||
(April- | ||||||||
June 2001) | ||||||||
| | | | | | | (per cent) | ||
1 | | 2 | 3 | 4 | 5 | 6 | ||
1. Multilateral | 31,035 | 31.6 | 31,104 | 31.0 | -0.2 | |||
2. Bilateral | 15,810 | 16.1 | 16,624 | 16.6 | -4.9 | |||
3. IMF | 0 | 0.0 | 0 | 0.0 | 0 | |||
4. Commercial Borrowings | ||||||||
(including trade credits)# | 29,309 | 29.8 | 30,041 | 29.9 | -2.4 | |||
5. NRI Deposits (long-term) | 15,729 | 16.0 | 15,432 | 15.4 | 1.9 | |||
6. Rupee debt | 3,230 | 3.3 | 3,693 | 3.7 | -12.5 | |||
7. Long Term-Debt (1to 6) | 95,113 | 96.8 | 96,894 | 96.6 | -1.8 | |||
8. Short-Term Debt * | 3141 | 3.2 | 3462 | 3.4 | -9.3 | |||
9. Total Debt (7+8) | 98,254 | 100.0 | 100,356 | 100.0 | -2.1 | |||
# | Includes net investment by 100 % FII debt funds. | |||||||
* | Excludes suppliers’ credit of up to 180 days. | |||||||
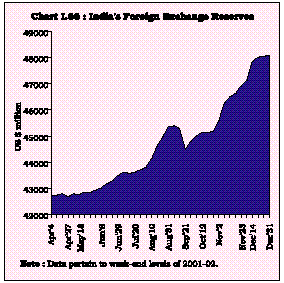
1.102 During the year 2001-02 (April-December),there has been an accumulation of foreign exchange reserves of the order of US $ 5.8 billion. As a result, India's foreign exchange reserves increased from US $ 42.3 billion as at end-March 2001 to US $ 48.1 billion as at the end of December 2001 (Chart I.66) The import cover of reserves improved from 8.6 months of imports at the end of March, 2001 to around 10 months of imports at the end of December 2001. The overall approach to the management of India's foreign exchange reserves in recent years has reflected the changing composition of balance of payments, and has endeavoured to reflect the 'liquidity risks' associated with different types of flows and other requirements. The policy for reserve management is thus judiciously built upon a host of identifiable factors and other contingencies. Taking these factors into account, India's foreign exchange reserves are at present comfortable.
1 AL = Reserve Bank’s net claims on the Government (adjusted for net open market (including repo) operations) + Claims on banks (other than credit to scheduled commercial banks) + Credit to the commercial sector (other than credit to PDs) + Net foreign assets – Notes in circulation – ‘Other’ deposits – Net non-monetary liabilities, in flow terms.
DL = Net open market (including repo) operations + Credit to scheduled commercial banks and primary dealers netted for cumulative changes in reserve requirements, in flow terms.
Page Last Updated on:


