 IST,
IST,
I. Output
The Indian economy, which had exhibited a sharp recovery in the second half of 2009-10, witnessed further consolidation of growth in the first quarter of 2010-11. With a normal monsoon, lead data on the kharif sowing and production estimates suggest an above trend rate of growth in the agriculture sector in 2010-11. Industrial growth remains robust, albeit, with greater volatility. Lead indicators of services activities point to a continuation of the momentum. Going forward, while the growth rates in the services sector and agriculture are likely to remain elevated, sustainability of the recent buoyancy in the industrial sector would require alleviation of supply constraints, particularly in the infrastructure sector and sustained momentum in private demand. I.1 As per the estimates released by the CSO, real GDP growth was placed at 8.8 per cent during the first quarter of 2010-11, which is the highest quarterly growth recorded so far since the third quarter of 2007-08. Although part of the increase in growth during the first quarter of 2010-11 is due to a favourable base effect, it largely reflects consolidation of the recovery. Real GDP growth was broad based, with robust performance in all the major sectors (Table I.1). Agriculture and allied activities witnessed a strong pick-up over the previous four quarters, led by higher growth in allied activities. The growth in the industrial sector, though lower than in the previous two quarters, continued to be in double digits, primarily reflecting robust capital goods and consumer durables production. The services sector growth gathered further momentum during the first quarter of 2010-11.
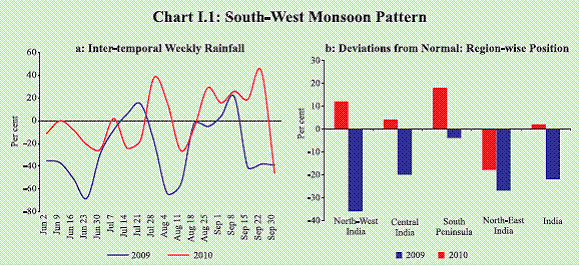
Agricultural Situation I.2 The cumulative actual area weighted rainfall during the South-West monsoon season (June to September 30, 2010) was 2 per cent above Long Period Average (LPA), as against 22 per cent below LPA during the previous year. Of the 36 meteorological subdivisions, the cumulative rainfall was excess/normal in 31 subdivisions (13 sub-divisions last year). The rainfall, however, was deficient in North- East India (Chart I.1). As on October 21, 2010, the total live water storage in 81 major reservoirs of the country was 74 per cent of the Full Reservoir Level (64 per cent during the corresponding period last year). I.3 Following a normal monsoon, the area sown during kharif 2010-11 (as on October 22) turned out to be higher than in the corresponding period of the previous year for all crop categories, except soyabean and sesamum (Table I.2). The increase in area coverage during 2010-11 kharif season relative to 2008-09, however, turns out to be marginal. Since 2009-10 had witnessed a significant deficiency in rainfall, a comparison of 2010-11 performance with 2008-09 provides a better picture of growth in the agriculture sector. Acreage under pulses, cotton, sugarcane and soyabean during kharif 2010-11, has been more than the normal area sown.
I.4 The increase in total area sown is manifested in the First Advance Estimates of kharif production, which show increase in production across all crops, barring jute, sesamum and soyabean. The total kharif foodgrains production during 2010-11 is estimated to increase by 10.4 per cent over the previous year. The increase, however, is on a lower base of last year, which happened to be a drought year. The estimated kharif foodgrains production during 2010-11 (114.6 million tonnes), still remains lower than the level attained in 2007-08 (120.9 million tonnes) and 2008-09 (118.1 million tonnes). I.5 Owing to drought in some States, particularly Jharkhand, Bihar and West Bengal, kharif rice production during 2010-11, though estimated higher than the preceding year, would fall short of the record level achieved in 2008-09. Floods in Punjab and Haryana and delayed replanting of paddy could also have affected the rice productivity. Total cereals production, hence, may lag behind the levels attained in 2007-08 and 2008-09. Notwithstanding the likely increase in kharif production, the demand supply gap in the case of oilseeds and pulses is likely to remain. Among commercial crops, only cotton has posted an all-time high production. This has not helped in moderating domestic prices since international cotton prices have spiked after floods in Pakistan, which is a major producer and exporter of cotton. I.6 The demand supply gap in the case of important food items like fruits and vegetables and protein based products continue to persist due to near stagnant supply, owing to lower yields and increase in demand due to factors like increase in population and income levels and changing food habits of the people. This exerts pressure on the prices. Moreover, increase in input costs has also led to spurt in prices in the case of protein items like milk, eggs and meat.
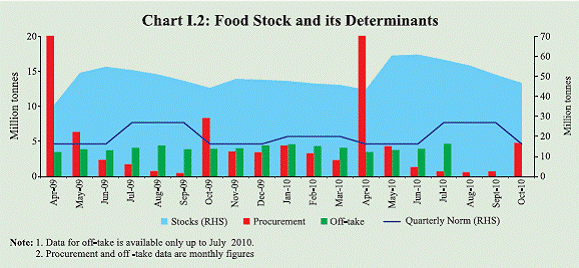
Food Management I.7 The procurement of foodgrains (rice
and wheat) during 2010-11 (up to October
23) was lower than that in the corresponding
period of the previous year. Average monthly
procurement during April-September 2010
was 4.8 million tonnes as against 5.4 million
tonnes during the corresponding period of
last year. The average monthly off-take
during the period April-July 2010 (up to
which data are available), was 4.0 million tonnes as against 3.8 million tonnes during
the corresponding period of last year. This
had been reflected in declining stocks in
recent months. The total stock of foodgrains
with the Food Corporation of India (FCI) and
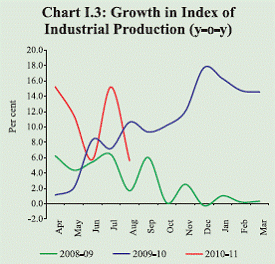
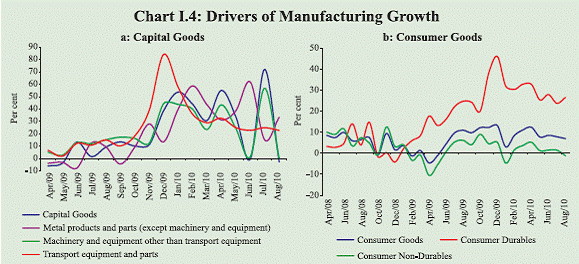
Industrial Performance I.8 Growth in industrial output has exhibited volatility in the recent period, notwithstanding double-digit growth during October 2009 to July 2010 (except June 2010) (Chart I.3). Index of Industrial Production (IIP) recorded a lower growth of 5.6 per cent in August 2010 compared with 10.6 per cent in August 2009, mainly on account of negative growth in capital goods and consumer nondurables. The volatility in capital goods as measured by coefficient of variation during April 1994 to August 2010 was placed at 1.1, the highest recorded among the use-based industries. The volatile IIP growth can also be partly attributed to a base effect. I.9 During April-August 2010, consumer non-durables growth remained subdued at 1.6 per cent compared with (-) 1.1 per cent during the same period last year. Improved kharif production (particularly sugar) is expected to have a favourable impact on the production of consumer nondurable goods in the coming months.
I.10 Despite some moderation in recent
months, IIP grew by 10.6 per cent during
April-August 2010, as compared to 5.9 per
cent during the corresponding period of last
year. The manufacturing sector which
accounts for 79.4 per cent of weight in IIP, still recorded double digit growth. The
manufacturing sector growth was propelled
by high growth in capital goods and
consumer durables segments (Chart I.4 a and
b and Table I.3). The capital goods sector
has recorded high double digit growth since
December 2009, except in June and August
2010 when it turned negative. The growth pattern, however, has been volatile, with a
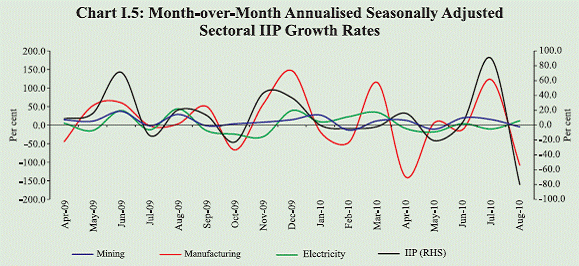
I.11 The month-over-month seasonally adjusted annualised growth rates show deceleration in all sectors of the IIP during August 2010 (Chart I.5).
I.12 Growth in the manufacturing sector
is yet to become broad-based although
eleven out of seventeen industries,
accounting for about 51 per cent of the
weight in the IIP, recorded higher growth
during April-August 2010 than
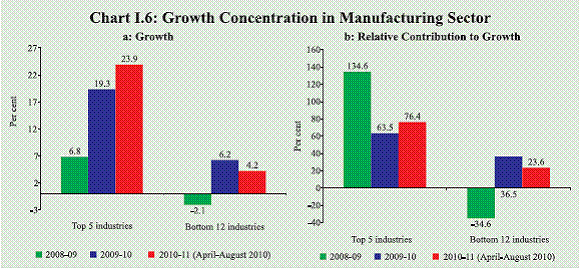
corresponding period of last year. The top
five manufacturing industries, with a
combined weight of 24.6 per cent in the IIP,
grew at around 24 per cent, contributing
I.13 During the period April-August 2010, capacity utilisation levels in the infrastructure sector showed a mixed trend. While fertiliser and petroleum refinery production sectors recorded slightly higher utilisation, finished steel and cement witnessed lower utilisation as compared to the same period last year (Table I.4). I.14 The Order Books, Inventories and
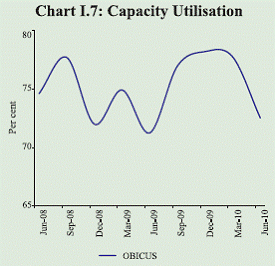
Capacity Utilisation Survey (OBICUS) of
the Reserve Bank indicates that capacity
utilisation, which had remained rangebound
since Q2 of 2009-10, declined
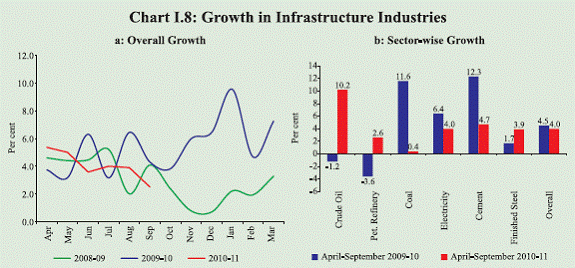
during Q1 of 2010-11 (Chart I.7). I.15 The infrastructure sector comprising six core industries (accounting for 26.6 per cent of the total weight in IIP) recorded a growth of 4.0 per cent during April- September 2010-11, which represents some moderation as compared to the corresponding period of the preceding year (4.5 per cent) (Chart I.8 a and b). The growth in the infrastructure sector during the period was led by crude oil, petroleum refinery and finished steel, while there was lower growth in cement, electricity and coal production as compared to April-September 2009-10. Core infrastructure growth continued to la behind the pace of industrial growth. Preliminary evidence suggests that this break-down of relationship between core infrastructure industries and IIP capital goods is partly due to increase in imports of crude oil, steel and coal. The current level of growth momentum in infrastructure industries, especially electricity generation, needs to improve substantially in order to sustain a robust growth in industry.
I.16 The electricity generation during April–September 2010 has recorded a growth of 4.0 per cent as compared with 6.4 per cent during the same period last year. Thermal generation achieved a growth of 2.7 per cent, mainly due to higher growth in gas based generation (8.5 per cent). Growth in thermal generation was constrained by shortage of coal. Natural gas production, which is not reflected in the core infrastructure index, increased by 25.2 per cent during April-September 2010 as against 28.2 per cent growth in the same period last year on account of higher production from D6 block in the Krishna- Godavari (KG) basin.
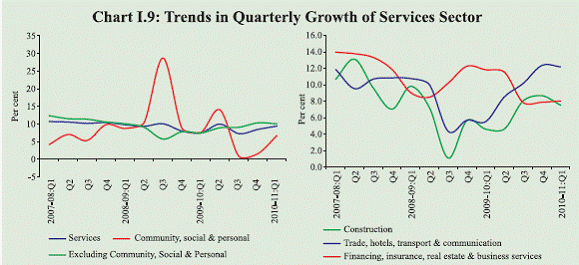
Services Sector I.17 The services sector growth recorded further acceleration in Q1 2010-11 relative to both the previous quarter and the corresponding quarter of last year (Chart I.9). Growth in the ‘trade, hotels, restaurants, transport, storage and communication’ segment has been robust in recent quarters. I.18 Lead indicators of services sector like commercial vehicles production, cell phone connections, air cargo, and passengers handled at domestic and international terminals have increased at a robust pace during the year so far (Table I.5). Cement production, a lead indicator of construction activities, seemed to be weaker than last year. I.19 To sum up, on the supply side, although agricultural production during kharif season 2010-11 is estimated to post a stronger positive growth over the previous year, it may still trail behind the levels attained in 2008-09 and 2007-08, while the demand continues to grow. The increase in overall demand and also shifts in the consumption pattern would require higher production of protein-based food items as well as manufactured food items to contain inflation. With growing demand supply mismatches, the expected dampening impact of a normal monsoon on food inflation may not materialise, unless the rabi production improves substantially and the policy on food management focuses on better supply management. To contain high inflation emanating from key food items like milk, meat, fish and eggs, the livestock and allied sector would have to show sustained improvement The industrial sector shows volatile trends in growth rates, which raises questions about sustainability of the double digit trend. Trends in capacity utilisation also show some moderation. Going forward, the sustainability of current buoyancy in industrial sector would require significant boost to infrastructure industries, particularly, electricity, coal, oil and gas. Cheaper imports, given the current external environment, could also compete with domestic manufacturing activities. Services sector continued to show acceleration and the lead indicators remain supportive of further momentum.
|
||||||||||||||||||||||||||||||||||||||||||||||||||||||||||||||||||||||||||||||||||||||||||||||||||||||||||||||||||||||||||||||||||||||||||||||||||||||||||||||||||||||||||||||||||||||||||||||||||||||||||||||||||||||||||||||||||||||||||||||||||||||||||||||||||||||||||||||||||||||||||||||||||||||||||||||||||||||||||||||||||||||||||||||||||||||||||||||||||||||||||||||||||||||||||||||||||||||||||||||||||||||||||||||||||||||||||||||||||||||||||||||||||||||||||||||||||||||||||||||||||||||||||||||||||||||||||||||||||||||||||||||||||||||||||||||||||||||
Page Last Updated on:


