 IST,
IST,
II. Aggregate Demand
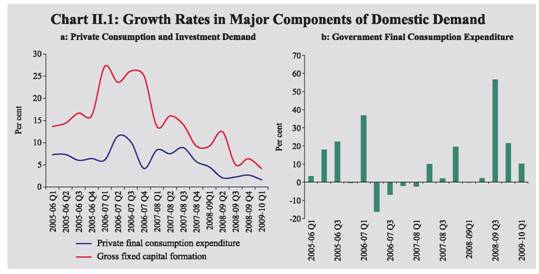
Aggregate demand, which had moderated considerably in 2008-09, remained sluggish during the first quarter of 2009-10. Private consumption and investment demand continued to decelerate during the first quarter of 2009-10, with the former registering the lowest quarterly growth in recent years. Government consumption expenditure growth, which had risen sharply in the third and fourth quarters of 2008-09, moderated during the first quarter of 2009-10, but continued to remain in double-digits. During April-August, 2009 the key deficit indicators of the Central Government, viz., revenue deficit and fiscal deficit, were significantly higher than during the corresponding period of the previous year, reflecting the combined impact of slowdown induced decline in revenue receipts and increase in public expenditure consistent with expansionary fiscal stance. Corporate sector data indicate modest decline in sales growth during the first quarter of 2009-10, although profit margins improved. II.1 The contagion from the global crisis operating through the confidence channel has dampened the private consumption and investment demand and the impact persisted even in the first quarter of 2009-10, when the growth in private consumption demand fell to one of the lowest levels. While the real GDP growth measured from the demand side was higher during the first quarter of 2009-10, at 6.0 per cent, than the preceding two quarters, the improvement largely resulted from a sharper contraction in imports than in exports, which led to a reversal in the share of net exports in GDP from negative to positive. The domestic component of demand continued to remain weak during the first quarter of 2009-10. Private consumption demand decelerated sharply to 1.6 per cent, which is the lowest growth in recent years. This deceleration is significant in the context of the high share of private consumption demand in the aggregate demand (i.e., 55.6 per cent during the first quarter of 2009-10). The growth in investment demand, as could be inferred from the behavior of gross fixed capital formation, was less than half of that registered in the corresponding period of the preceding year. Growth in government consumption expenditure continued to remain in double digits, but was substantially lower than the high growth that was witnessed in the third and fourth quarters of 2008-09. In view of its lower share in aggregate demand, government final consumption expenditure could not fully compensate for the adverse impact of private consumption and investment demand on the overall consumption expenditure. Key deficit indicators of the Central Government, viz., the revenue deficit and the gross fiscal deficit during April-August 2009 were lower, as proportions to budget estimates, than in the corresponding period of the previous year. Corporate performance remained subdued, and the impact of moderation in demand was visible in the decline in sales growth in the first quarter of 2009-10. Gross profits, however, increased after two consecutive quarters of decline, mainly due to lower input and operating costs and higher non-core income. Net exports turned positive despite the continued decline in exports, mainly on account of the sharper contraction in imports1. Domestic Demand II.2 Domestic demand in the form of private consumption expenditure and investment, which had moderated in 2008-09, continued to decelerate in the first quarter of 2009-10, reflecting weak domestic demand as a constraint to faster recovery. According to the data released by the Central Statistical Organisation (CSO) for the first quarter of 2009-10, private final consumption expenditure (PFCE) and gross fixed capital formation (GFCF) witnessed sharp deceleration in growth as compared with the corresponding period in 2008-09 (Table 2.1 and Chart II.1). The deficient monsoon could have further weakened private consumption demand since the first quarter of 2009-10, through the adverse effect on rural demand. The decline in credit card and consumer durables related credit also point to persistence of weak consumption demand.
II.3 Growth in government final consumption expenditure which had increased considerably in response to policy driven fiscal stimulus aimed at cushioning the impact of contraction in other sectors in 2008-09, registered a double digit growth in the first quarter of 2009-10, which though represents a deceleration over the previous two quarters. II.4 In terms of share, the private final consumption expenditure decreased to 55.6 per cent from 58.0 per cent during the corresponding period of 2008-09 (Table 2.1). Combined Budgeted Finances: 2009-10 II.5 An overview of the combined finances of the Central and State Governments budgeted for 2009-10 indicates that the key deficit indicators as per cent of GDP would remain at the elevated levels as in 2008-09 (Table 2.2). This increase in the combined deficits reflects the continuation of expansionary fiscal stance adopted by both the Central and State Governments to contain economic slowdown. Though the growth in total expenditure would moderate somewhat from the previous year, the non-developmental component is budgeted to increase substantially. The total expenditure as a per cent of GDP is thus slated to increase further. Growth in tax collections, on the other hand, would decelerate further on account of indirect tax cuts and the continued moderation in economic growth. As a result, the combined revenue receipts as a per cent of GDP is budgeted to decline in 2009-10 over 2008-09, even though the non-tax receipts as a percentage of GDP would increase to 4.2 per cent from 3.8 per cent. Consequently, the combined revenue deficit and fiscal deficit as percent of GDP in 2009-10 would increase by 1.1 and 1.3 percentage points to 5.5 per cent and 10.2 per cent, respectively.
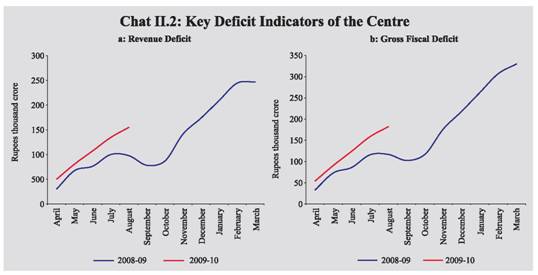
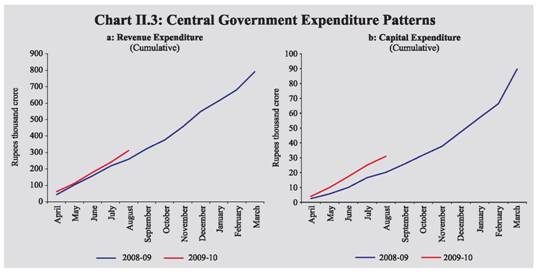
Central Government Finances II.6 Available information on Central Government finances for the first five months of 2009-10 (April-August) from the Controller General of Accounts indicates that both revenue deficit and gross fiscal deficit (GFD) were substantially higher, in absolute terms, than the corresponding period of previous year, but were lower as proportions of budget estimates (Chart II.2a and b and Table 2.3). II.7 The pattern of Central Government finances during April-August 2009 showed that net tax revenue as a proportion of budget estimates was lower than in April-August 2008, due to a sharp decline in gross tax revenue in each of the five months, as against an increase in the corresponding period of the previous year. Reflecting the impact of economic slowdown, collections under direct taxes such as corporation tax and income tax decelerated to single digit growth in April-August 2009 as compared with significantly high growth registered during April-August 2008. While revenue from customs declined over the same period due to the sharp fall in imports, revenue from excise duties declined due to tax cuts and fall in domestic sales. Non-tax revenue registered a growth of nearly 40 per cent over the corresponding period of the previous year, with the transfer of surplus from the Reserve Bank accounting for about 50 per cent of the total non-tax revenue. Despite the substantial increase in the growth of non-tax revenue, revenue receipts recorded a decline in April-August 2009 over the corresponding period of the preceding year. II.8 Revenue expenditure increased at a higher rate during April-August 2009 than during April-August 2008, mainly on account of higher expenditure on interest payments, food subsidies, defence revenue expenditure and pensions (Chart II.3a). While higher interest payments were mainly due to the large borrowing undertaken in 2008-09, increased salary payout under the Sixth Pay Commission Award raised the expenditure under defence and pensions. Total revenue expenditure as a proportion of budget estimates was, however, lower than the corresponding period of the previous year. Thus, revenue deficit during the first five months of 2009-10 was substantially lower at 54.9 per cent of budget estimates as compared with 177.4 per cent during the corresponding period of the previous year. II.9 During April-August 2009, capital expenditure registered a high double-digit growth (Chart II.3b). While defence capital expenditure registered nearly a three-fold increase, non-defence capital outlay was high in railways. Aggregate expenditure during April-August 2009 accelerated over April-August 2008 but accounted for a lower share of budget estimates. GFD during the same period was 45.5 per cent of the budget estimates as compared with 87.7 per cent during April-August 2008. The Centre recorded a large gross primary deficit of 62.8 per cent of budget estimates during the first five months of 2009-10. II.10 According to the latest available data, direct tax collections during the current financial year (up to end-September 2009) registered a growth of 3.7 per cent over the same period of last fiscal year. While corporate tax collections grew by 5.6 per cent, collections under personal income tax (including security transaction tax) increased by 0.38 per cent. Advance tax collections were reported to have been higher during the second quarter of 2009-10 than the preceding quarter of the year. State Finances: 2009-102 II.11 The fiscal correction and consolidation witnessed till 2007-08 reversed somewhat during 2008-09 on account of the economic slowdown. The consolidated revenue account of the State Governments is budgeted to turn into deficit of 0.6 per cent of GDP during 2009-10, after being in surplus in the previous three years, due to the sluggishness in own tax collections and devolution from the Centre along with higher expenditure commitment to implement recommendations of the Sixth Pay Commission by many of the State Governments. As a result, GFD is budgeted to be higher at 3.4 per cent of GDP as compared with 2.7 per cent in 2008-09 (RE). The consolidated primary deficit is budgeted to increase to 1.4 per cent of GDP in 2009-10 from 0.7 per cent in 2008-09 (RE) (Table 2.2). II.12 Keeping in view the need for spurring aggregate demand in the economy, the Central Government allowed the States to raise additional market borrowings of 0.5 per cent of Gross State Domestic Product (GSDP), thus increasing the limit of GFD to 4.0 per cent of GSDP during 2009-10 (3.5 per cent of GSDP during 2008-09). However, the aggregate expenditure of States at consolidated level is budgeted to rise by 12.2 per cent in 2009-10 (BE) as compared with 26.0 per cent during 2008-09 (RE). Corporate Performance II.13 An analysis of the performance of select non-financial non-government companies showed that the sales growth, that had been substantial in the first and second quarters of 2008-09, witnessed sharp deceleration post-September 2008 on account of falling demand and confidence. Sluggishness in demand and lower commodity prices affected sales growth, which turned negative in the first quarter of 2009-10 (Table 2.4). Despite a fall in revenues, corporates on an aggregate were able to improve their performance largely on account of higher profit margins, which, in turn, were driven primarily by lower input costs, significant deceleration in interest payments, lower foreign exchange related losses and high growth in non-core other income. Improved margins in the first quarter of 2009-10 also reflected the corporate sector’s cost reduction initiatives in response to the slowdown in economic conditions that helped in controlling operating expenses. The subdued sales and improved profit performance in first quarter was also partly on account of base effects, as private corporate sector had posted around 7 per cent profit growth during the corresponding period last year, on the back of 29.3 per cent growth in sales.
II.14 In terms of sectoral breakdown, the slowdown in sales and profits performance for companies in manufacturing sector was more evident vis-à-vis those in information technology and other services sectors. The aggregate sales of manufacturing companies that had decelerated sharply in third quarter of 2008-09 in relation to increases in sales in first two quarters, witnessed a modest fall in the first quarter of 2009-10, reflecting sluggishness in product prices and subdued demand growth. The net profit margin, measured as net income to sales ratio, which was the lowest for manufacturing sector and had declined to less than 5.0 per cent in the third quarter of 2008-09, recovered to 9.2 per cent in the first quarter of 2009-10, as operating conditions improved and interest outflow decelerated considerably. In comparison, companies in services sector more or less maintained profit margins despite the sales deceleration in the first quarter of 2009-10. II.15 Select non-financial listed government (oil and non-oil) companies recorded 20.1 per cent rise in net profits despite 24.3 per cent decline in sales in the first quarter of 2009-10. The overall performance was driven by the performance of oil companies, for which the net profit margin improved considerably due to fall in interest payments, raw material and staff costs, on the one hand and sizeable rise in other income, on the other. The operating margin for non-oil government companies, however, declined as expenditure outpaced sales. External Demand II.16 External demand continued to remain adverse on account of the global recession and decline in world trade volume, notwithstanding the recent signs of recovery. In the first quarter of 2009-10, India’s imports of goods and services contracted faster than exports, and as a result net exports, which had negative contribution to GDP in the previous quarters, turned positive (Table 2.1). Information on net exports beyond the first quarter of 2009-10 could be partially inferred from the behavior of merchandise trade. Merchandise trade deficit during April-August 2009 stood at US $ 38.2 billion, which was lower by 37.1 per cent than US $ 60.7 billion in April-August 2008, due to relatively larger year-on-year decline in imports than exports during the period. A detailed discussion on the external demand conditions is set out in Chapter III. II.17 On balance, aggregate demand continues to remain weak, notwithstanding the role of policy stimulus in providing support to private demand. Growth in private consumption demand decelerated so sharply during the first quarter of 2009-10 that it could be reasonable to expect considerable revival from that level in subsequent quarters. Consumption could also be expected to improve in the current fiscal year on account of continuation of the expansionary fiscal policy, particularly higher expenditure under the National Rural Employment Guarantee Scheme (NREGS) and disbursement of remaining arrears of Sixth Pay Commission award which could stimulate private consumption. The drought could adversely affect agricultural income and hence rural spending but higher minimum support price announced by the Government in August 2009 could help in moderating any deceleration in rural demand. Investment demand could pick up in the near term with a lag, in line with the improved domestic business sentiments, favourable domestic capital market conditions, signs of revival in global capital markets and reduced risk premia. 1 Net exports data reported in the GDP for the first quarter of 2009-10 (at constant prices) differ from net exports in the balance of payments (BoP) data for the first quarter because of : (a) release of BoP data after the GDP data and hence use of estimates of services in the GDP data and (b) use of deflators for arriving at net exports at constant prices, as at current prices the differences are primarily because of (a). 2 Based on the budget documents of 27 State Governments, of which two are vote on account. |
||||||||||||||||||||||||||||||||||||||||||||||||||||||||||||||||||||||||||||||||||||||||||||||||||||||||||||||||||||||||||||||||||||||||||||||||||||||||||||||||||||||||||||||||||||||||||||||||||||||||||||||||||||||||||||||||||||||||||||||||||||||||||||||||||||||||||||||||||||||||||||||||||||||||||||||||||||||||||||||||||||||||||||||||||||||||||||||||||||||||||||||||||||||||||||||||||||||||||||||||||||||||||||||||||||||||||||||||||||
Page Last Updated on:


