 IST,
IST,
II. Fiscal Situation
Combined Government Finances: 2005-06
Key fiscal ratios of combined finances are budgeted to improve in 2005-06, primarily through higher revenue mobilisation, especially direct taxes and supported by expenditure management with an emphasis on outcomes than mere outlays (Table 11). Fiscal policy for 2005-06 seeks to continue with the process of fiscal consolidation while aiming to build the spirit of cooperative fiscal federalism by enhanced transfer of resources to States.
Centre’s Fiscal Situation
The available information on finances of the Central Government for the first eight months of 2005-06 (April-November) indicates an improvement in key fiscal variables due to a continued buoyancy in the tax collections and containment of growth in non-Plan expenditure. Although revenue deficit, as per cent of budget estimates, was lower in April-November 2005 than a year ago, fiscal deficit and primary deficit were higher than a year ago (Table 12). Adjusting for debt swap receipts of Rs. 32,066 crore in April-November 2004, fiscal deficit and primary deficit, as proportion to budget estimates, were, however, lower in April-November 2005 than a year ago. The surplus cash balance with the Reserve Bank has been higher during 2005-06 so far, which is expected to provide flexibility to the Central Government in managing its expenditure flows for the remaining part of the year.
|
Table 11: Key Fiscal Indicators |
||||
|
(Per cent to GDP) |
||||
|
Year |
Primary Deficit |
Revenue Deficit |
Gross Fiscal Deficit |
|
|
1 |
2 |
3 |
4 |
|
|
Centre |
||||
|
2002-03 |
1.1 |
4.4 |
5.9 |
|
|
2003-04 |
-0.03 |
3.6 |
4.5 |
|
|
2004-05 RE |
0.4 |
2.7 |
4.5 |
|
|
(0.05) |
(2.6) |
(4.1) |
||
|
2005-06 BE |
0.5 |
2.7 |
4.3 |
|
|
States |
||||
|
2002-03 |
1.3 |
2.2 |
4.1 |
|
|
2003-04 |
1.5 |
2.2 |
4.4 |
|
|
2004-05 RE |
1.0 |
1.4 |
3.8 |
|
|
2005-06 BE |
0.4 |
0.7 |
3.1 |
|
|
Combined |
||||
|
2002-03 |
3.1 |
6.6 |
9.5 |
|
|
2003-04 |
2.0 |
5.8 |
8.4 |
|
|
2004-05 RE |
2.2 |
4.1 |
8.3 |
|
|
2005-06 BE |
1.7 |
3.4 |
7.7 |
|
|
RE: Revised Estimates. |
||||
|
Table 12: Central Government Finances during April-November 2005 |
|||||||
|
(Rupees crore) |
|||||||
|
Items |
2005-06 |
April- |
April- |
Per cent of Budget Estimates |
|||
|
(Budget |
November |
November |
April-November | April-November | |||
|
Estimates) |
2004 |
2005 |
2004
|
2005
|
|||
|
1 |
2 |
3 |
4 |
5 |
6 |
||
|
1. |
Revenue Receipts (i + ii) |
3,51,200 |
1,49,061 |
1,73,703 |
48.2 |
49.5 |
|
|
i) |
Tax Revenue |
2,73,466 |
1,06,669 |
1,30,095 |
45.6 |
47.6 |
|
|
ii) |
Non-tax Revenue |
77,734 |
42,392 |
43,608 |
56.2 |
56.1 |
|
|
2. |
Non-debt Capital Receipts |
12,000 |
44,625 |
6,370 |
143.5 |
53.1 |
|
|
3. |
Non-Plan Expenditure |
3,70,847 |
1,95,511 |
2,10,638 |
58.8 |
56.8 |
|
|
of which: |
|||||||
|
i) |
Interest Payments |
1,33,945 |
74,625 |
75,526 |
57.6 |
56.4 |
|
|
ii) |
Defence |
48,625 |
24,740 |
27,072 |
56.9 |
55.7 |
|
|
iii) |
Subsidies |
46,358 |
30,803 |
31,149 |
73.0 |
67.2 |
|
|
4. |
Plan Expenditure |
1,43,497 |
68,892 |
82,384 |
47.3 |
57.4 |
|
|
5. |
Revenue Expenditure |
4,46,512 |
2,23,009 |
2,60,884 |
57.9 |
58.4 |
|
|
6. |
Capital Expenditure |
67,832 |
41,394 |
32,138 |
44.8 |
47.4 |
|
|
7. |
Total Expenditure |
5,14,344 |
2,64,403 |
2,93,022 |
55.3 |
57.0 |
|
|
8. |
Revenue Deficit |
95,312 |
73,948 |
87,181 |
97.1 |
91.5 |
|
|
(2.7) |
|||||||
|
9. |
Gross Fiscal Deficit |
1,51,144 |
70,717 |
1,12,949 |
51.5 |
74.7 |
|
|
(4.3) |
|||||||
|
10. |
Gross Primary Deficit |
17,199 |
-3,908 |
37,423 |
-49.4 |
217.6 |
|
|
(0.5) |
|||||||
|
Note: Figures
in parentheses are per cent to GDP. |
|||||||
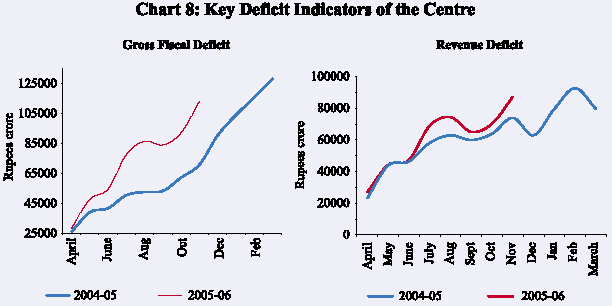
Tax revenue of the Central Government during April- November 2005, as per cent of BE, was higher than a year ago on account of higher collections under corporation tax, income tax, customs duties and service tax. New taxes viz., fringe benefit tax, securities transaction tax and banking cash transaction tax have also contributed to the buoyancy in tax revenue during the current year. The growth in non-tax revenue was, however, moderate on account of lower interest receipts. Revenue expenditure, as per cent of BE, was marginally higher than a year ago. Despite containment of non-Plan expenditure on subsidies and interest payments, revenue expenditure was higher on account of increase in Plan expenditure. Capital expenditure during the period under review declined due to withdrawal of loan support to States’ Plans and lower defence capital expenditure. Gross fiscal deficit (GFD) during April-November 2005 was higher than a year ago, essentially reflecting the impact of discontinuation of the Debt Swap Scheme (DSS) (Chart 8). Adjusted for DSS transactions in the previous year, growth in fiscal deficit at 9.9 per cent was comparable to 9.7 per cent a year ago.
Financing of the Union Budget
During the first eight months of the fiscal year 2005-06, market borrowings financed the major portion of the GFD. In addition to market borrowings, large recourse to draw down of cash balances enabled the Centre to finance its GFD and bridge the gap in the Public Account.
During 2005-06 (up to January 18, 2006), the actual issuances of dated securities at Rs.1,15,000 crore was lower than Rs.1,27,000 crore scheduled in the calendar for 2005-06 (Table 13). This was on account of (i) a reduction in the notified amount from Rs.4,000 crore (as per the issuance auction calendar) to Rs.2,000 crore for maturity of 29.27 years in the auction of May 3, 2005 (ii) rejection of bids for an issue of Rs.6,000 crore on October 6, 2005 and (iii) cancellation of the auction of dated securities scheduled for October 18-25, 2005 for an amount of Rs.4,000 crore based on review of the current borrowing requirements of the Government of India. Gross and net market borrowings (excluding issuances under market stabilisation scheme) of the Centre (up to January 18, 2006) amounted to 82.6 per cent and 80.0 per cent of the BE as compared with 63.7 per cent and 45.0 per cent, respectively, a year ago.
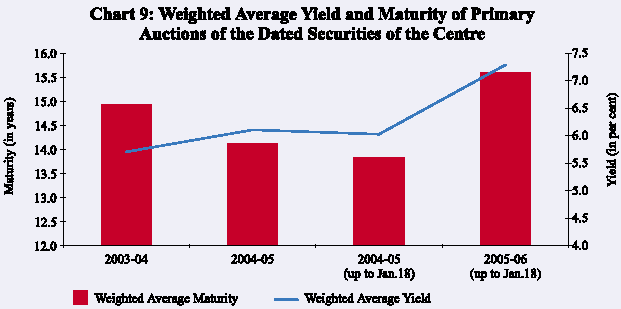
The weighted average yield of the dated securities issued during 2005-06 (up to January 18, 2006) increased to 7.29 per cent from 6.03 per cent during the corresponding period of 2004-05. The weighted average maturity of dated securities of the Central Government over the same period was higher at 15.61 years than 13.84 years in the corresponding period of the preceding year (Chart 9). The secondary market yield on 10-year Central Government securities has increased to 7.1 per cent during 2005-06 so far (up to January 18, 2006) from 6.0 per cent during the corresponding period of the previous year. In this context, it may be noted
|
Table 13: Central Government Securities Issued during 2005-06 |
|||
|
Date of Auction |
Notified Amount |
Residual Maturity |
Cut-off Yield |
|
(Rupees crore) |
(Years) |
(Per cent) |
|
|
1 |
2 |
3 |
4 |
|
April 5, 2005 |
5,000 |
6.98 |
6.80 |
|
April 5, 2005 |
3,000 |
27.39 |
7.79 |
|
April 19, 2005 |
5,000 |
11.74 |
7.48 |
|
April 19, 2005 |
2,000 |
29.31 |
7.94 |
|
May 3, 2005 |
6,000 |
5.03 |
6.99 |
|
May 3, 2005 |
2,000 |
29.27 |
7.98 |
|
May 24, 2005 |
4,000 |
16.05 |
7.28 |
|
June 6, 2005 |
4,000 |
15.98 |
7.47 |
|
June 6, 2005 |
6,000 |
8.86 |
6.91 |
|
June 23, 2005 |
5,000 |
10.81 |
6.91 |
|
July 5, 2005 |
6,000 |
8.16 |
7.06 |
|
July 5, 2005 |
4,000 |
15.90 |
7.57 |
|
July 18, 2005 |
5,000 |
15.86 |
7.81 |
|
August 11, 2005 |
3,000 |
28.99 |
7.44 |
|
August 11, 2005 |
5,000 |
11.43 |
7.14 |
|
August 18, 2005 |
5,000 |
8.66 |
7.04 |
|
August 18, 2005 |
3,000 |
28.98 |
7.55 |
|
September 8, 2005 |
5,000 |
13.04 |
7.23 |
|
September 8, 2005 |
3,000 |
30.00 |
7.40 |
|
October 8, 2005 |
3,000 |
29.92 |
7.66 |
|
November 9, 2005 |
5,000 |
11.44 |
7.33 |
|
November 9, 2005 |
3,000 |
29.83 |
7.73 |
|
November 25, 2005 |
5,000 |
16.47 |
7.43 |
|
December 7, 2005 |
5,000 |
11.11 |
7.24 |
|
December 7, 2005 |
3,000 |
29.76 |
7.55 |
|
January 9, 2006 |
6,000 |
5.48 |
6.70 |
|
January 9, 2006 |
4,000 |
29.66 |
7.43 |
that the spread between 15-year and 10-year yields in the secondary market narrowed to 30 basis points during April-December 2005 from 45 basis points during April-December 2004. Similarly, the spread between 20-year and 15-year yields narrowed to 9 basis points from 15 basis points over the same period.
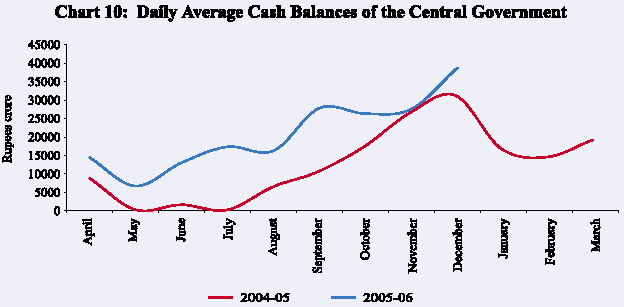
The limits on Centre’s Ways and Means Advances (WMA) from the Reserve Bank continued at Rs.10,000 crore for the first half (April-September) and Rs. 6,000 crore for the second half (October-March) of 2005-06. Reflecting its comfortable liquidity position, the Centre has availed WMA only twice (May 3 and June 4, 2005) during 2005-06 so far (up to January 18, 2006). The Centre has maintained higher surplus cash balances with the Reserve Bank during 2005-06 so far (up to January 14, 2006) (daily average of Rs.21,398 crore) than that in the corresponding period of 2004-05 (Rs.11,171 crore) (Chart 10).
Assessment of Central Government Finances (April-September, 2005): Mid-Year Review by Government of India
The Central Government released the "Mid-Year Review" of the economy for the first half of 2005-06 on December 9, 2005 as required under the Fiscal Responsibility and Budget Management (FRBM) Act, 2003. The Central Government finances during this period showed improvement as the key deficit indicators, as per cent of BE, declined over their levels (adjusted for debt swap transactions) a year ago due to buoyant tax collections. Nonetheless, the Government expressed concern over sluggish growth in excise collections despite impressive growth in the manufacturing sector. Revenue expenditure, as per cent of BE, was lower than a year ago whereas capital expenditure was higher on account of post-budget decision to extend external loans through the budget.
Despite the improvement over the corresponding period of the previous year, the Central Government could not meet any of the half-yearly targets (in respect of non-debt receipts, fiscal deficit and revenue deficit) set under the
FRBM Rules, 2004. In such an event, the Central Government is required to take measures towards revenue augmentation and expenditure containment. The Mid-Year Review, however, points out that mid-year targets need to be evaluated in the light of structural changes that have taken place in revenue and expenditure flows in recent years. Decline in the share of indirect taxes, which are collected more frequently, implied lower realisation of the revenue in first half of the year. Furthermore, measures taken to spread expenditure flows evenly through financial year to avoid the last quarter rush of expenditure implied incurrence of higher expenditure in the first half of the year than in the past. Thus, these shifts in the revenue and expenditure flows need to be factored in while making an assessment of the mid-year targets. Nevertheless, the Government has initiated measures to tone up tax administration and improve indirect tax collections particularly excise collections. To improve expenditure management the Government has already presented the first ‘Outcome Budget’ to improve the quality of expenditure with a focus on ‘outcomes’ rather than ‘outlays’. Furthermore, the Government has issued fresh guidelines to moderate non-Plan expenditure. The pressure on expenditure is, however, anticipated to emanate from i) increased requirement of Government-funded supply of foodgrains for employment guarantee programme and Sampoorana Gramin Rozgar Yojna and ii) provisioning for Externally Aided Projects (EAPs) under State Plans due to post-budget decision to continue routing them through the Consolidated Fund of India. Notwithstanding such pressures, the Government expects to achieve the budgeted targets.
State Finances
Financing of the States’ Budgets
The net allocation under market borrowing programme for State Governments is provisionally placed at Rs.16,112 crore during 2005-06. Taking into account the repayments of Rs.6,274 crore and additional borrowing allocation of Rs.1,734 crore, the gross allocation amounts to Rs.24,121 crore. State budgets have generally not taken into account the recommendations of the Twelfth Finance Commission (TFC). Reckoning the net Central loans for State Plans as reported in the Union Budget 2005-06 and assuming that the State Plans are maintained at the budgeted level, the market borrowings during 2005-06 would not be substantially higher than the provisional net allocation amount on account of higher devolution of taxes and grants as envisaged in the Union Budget in accordance with the TFC recommendations and larger receipts from NSSF. During 2005-06 so far (up to January 18, 2006), the States have raised an amount of Rs.15,702 crore i.e., 65.1 per cent of their gross allocation for 2005-06 (Table 14).
|
Table 14: Market Borrowings of the State Governments during 2005-06 (as on January 18, 2006) |
||||||
|
Items |
Date |
Cut-off Rate |
Tenor |
Amount Raised |
||
|
(Per cent) |
(Years) |
(Rupees crore) |
||||
|
1 |
2 |
3 |
4 |
5 |
||
|
A. |
Tap Issues |
|||||
|
i. |
First Tranche |
May 17-18, 2005 |
7.77 |
10 |
7,554 |
|
|
ii. |
Second Tranche |
September 13, 2005 |
7.53 |
10 |
2,931 |
|
|
iii. |
Third Tranche |
January 16, 2006 |
7.61 |
10 |
700 |
|
|
Total (i to iii) |
11,185 |
|||||
|
B. |
Auctions |
|||||
|
i. |
First |
April 20, 2005 |
7.45 |
10 |
300 |
|
|
ii. |
Second |
June 14, 2005 |
7.39 |
10 |
2,181 |
|
|
iii. |
Second |
June 14, 2005 |
7.35 |
10 |
210 |
|
|
iv. |
Third |
August 4, 2005 |
7.32 |
10 |
250 |
|
|
v. |
Fourth |
September 27, 2005 |
7.45 |
10 |
367 |
|
|
vi. |
Fourth |
September 27, 2005 |
7.42 |
10 |
146 |
|
|
vii. |
Fourth |
September 27, 2005 |
7.50 |
10 |
327 |
|
|
viii. |
Fifth |
November 17, 2005 |
7.34 |
10 |
375 |
|
|
ix. |
Sixth |
December 15, 2005 |
7.33 |
10 |
361 |
|
|
Total (i to ix) |
4,517 |
|||||
|
Grand Total (A+B) |
15,702 |
|||||
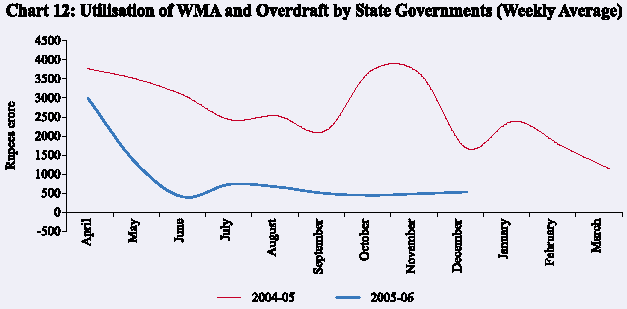
(Chart 12). Nine States have resorted to overdraft during 2005-06 so far (up to January 18, 2006) as compared with 13 States during the corresponding period of the previous year.
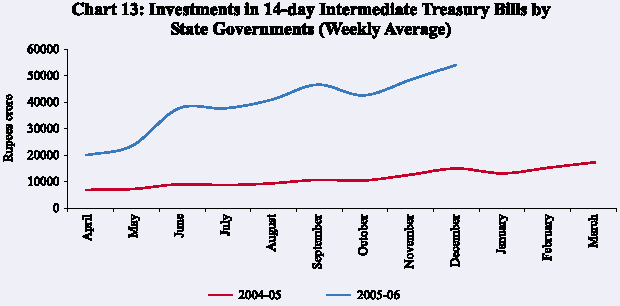
The improvement in the overall cash position of the States was also reflected in a spurt in their investments in 14-day Intermediate Treasury Bills. These investments have averaged Rs. 32,789 crore per month during 2005-06 so far (up to end-December 2005), substantially higher than that of Rs.9,081 crore in the corresponding period of the previous year (Chart 13).
Page Last Updated on:


