 IST,
IST,


III. Coping with the Pandemic: A Third-Tier Dimension
1. Introduction 3.1 The COVID-19 pandemic - a once-in-a-lifetime health crisis - is marked by heterogeneity in terms of its differentiated impact on health, economic and fiscal parameters across States, districts and cities. In response, all tiers of the government came together to work in coordination in order to contain its spread, mitigate its deleterious impact and alleviate the scars it left on lives and livelihoods. In this war effort against the pandemic, the role of local governments (LGs) has been pivotal, particularly from the point of view of mobilising a community-wide response. It is in this context that the theme “Coping with the Pandemic: A Third-Tier Dimension” has been chosen for this year’s report on State Finances, as a sequel to last year’s report which had adopted “Pandemic and its Spatial Dimensions in India” as its theme. 3.2 Like in the case of State governments, the finances of the third-tier governments were impacted severely during the pandemic. Restrictions on movement of people, goods and services, ramping up of health infrastructure, measures taken to protect livelihood and efforts taken to inoculate the citizens in a short span of time inflicted a heavy toll on their finances via a ‘scissor effect’ – an increase in expenditure due to a sharp rise in demand for public healthcare services with a simultaneous decrease in revenue resulting from the slowdown in economic activity. As local governments in India cannot run a deficit by law1, the adoption of innovative strategies to cope with the fiscal pressure became an imperative. The Central and State governments also extended support and LGs coordinated with the private sector and civil society to share the financial burden of the crisis. 3.3 This chapter drills down into the fiscal aspects of the role of third-tier governments across various States in India in containing the pandemic and bringing succour to those affected by it. The focus is on urban local bodies (ULBs), particularly municipal corporations (MCs). Qualitative responses obtained from 141 MCs across all the States in India through a primary survey conducted by the Reserve Bank have been used in this analysis. In addition, available budgetary data on 20 largest MCs spread across various States in India, which together account for around 60 per cent of revenue and 55 per cent of expenditures of the entire population of MCs, have been used. 3.4 The chapter is organised into 6 sections. Section 2 presents stylised facts on the spread and intensity of COVID-19 at the third-tier level. Section 3 discusses the efforts of local governments in terms of containment, vaccination and treatment. Section 4 examines the impact of the pandemic on local government finances. Section 5 delves into the steps taken by MCs to fill resource gaps. Section 6 concludes with the key lessons from this experience. 2. Spread and Intensity of COVID-19 in India 3.5 The first wave of the pandemic began with a gradual spurt in new cases from March 2020 onwards, and peaked around mid-September 2020, before reaching its lowest point in mid-February 2021. The second wave started from around mid-March 2021 and reached its peak on May 6, 2021. In contrast to the first wave, the rise in new cases during the second wave was steep and reached a much higher peak, primarily attributed to the significantly higher viral load of the Delta variant, rendering it more transmissible. Interestingly, the fall was equally sharp as cases reached about one-eighth of the peak by June 30, 2021. As regards concentration of cases, the share of top 20 districts2 in new cases was high in lean periods of low infections compared to phases in which cases were spiking at the all-India level (Chart III.1a). Reflecting the steep rise in new cases, the doubling rate3 declined sharply during the second wave as against a consistent increase during the first wave. While the sharp rise in new cases during the second wave significantly increased the caseload4, the case fatality rate5 remained stable (Chart III.1b). 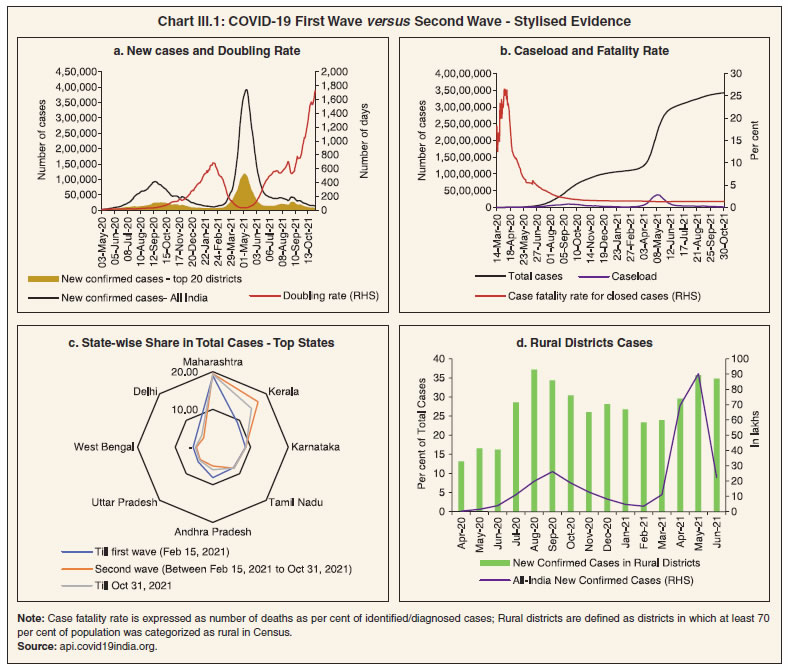 3.6 Eight States accounted for close to 70 per cent of the total cases throughout and the relative share of each of these States remained broadly stable (Chart III.1c). Rural areas were relatively less affected as their share in new confirmed cases remained less than 40 per cent even at the peak of the first and second waves (Chart III.1d). While the most urbanised States in India tend to have higher number of COVID-19 cases per million, the case fatality rate does not show any clear association between infections and urbanisation (Chart III.2). 3.7 Furthermore, the spatial spread of COVID-19 was asymmetric across districts within a State. At the beginning of the first wave (May 2020), cases were concentrated in only a handful of districts – Mumbai, Chennai, Thane, Pune and Ahmedabad – but by September 2020, infections had spread more widely, with the higher number of cases mostly in Maharashtra, Andhra Pradesh and Delhi. As cases receded and reached a trough in February 2021, pockets of high infections remained restricted to certain districts of Maharashtra and Kerala. In March 2021, cases were on the uptick again and Maharashtra continued to witness a high concentration of cases, particularly in Pune, Mumbai, Nagpur and Thane districts. By May 2021, i.e., at the peak of the second wave, contagion had spread through peninsular India and some districts in north-western and eastern India. While 40 districts accounted for around 70 per cent of infections in March 2021, nearly 150 districts accounted for two-third of the spread in May 2021. With cases dropping sharply in June, infections remained concentrated mostly in peninsular India (Chart III.3). 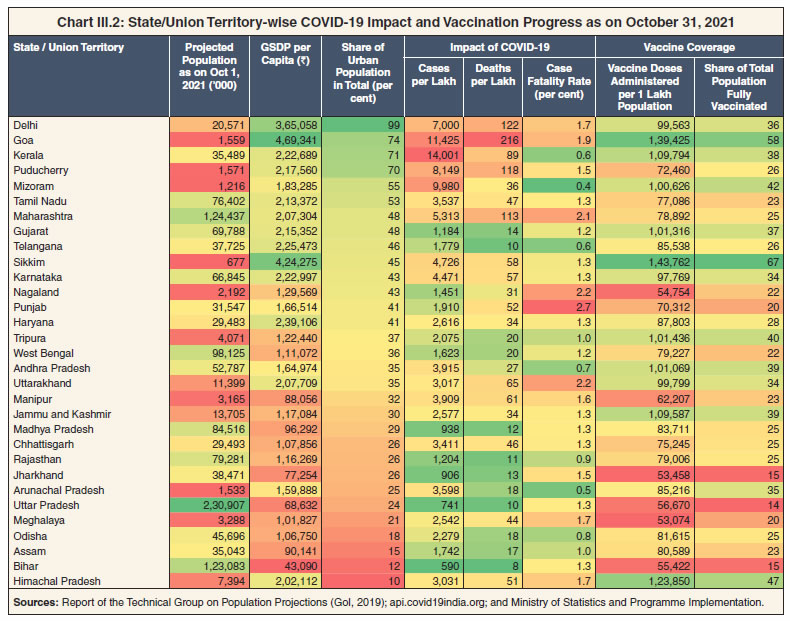 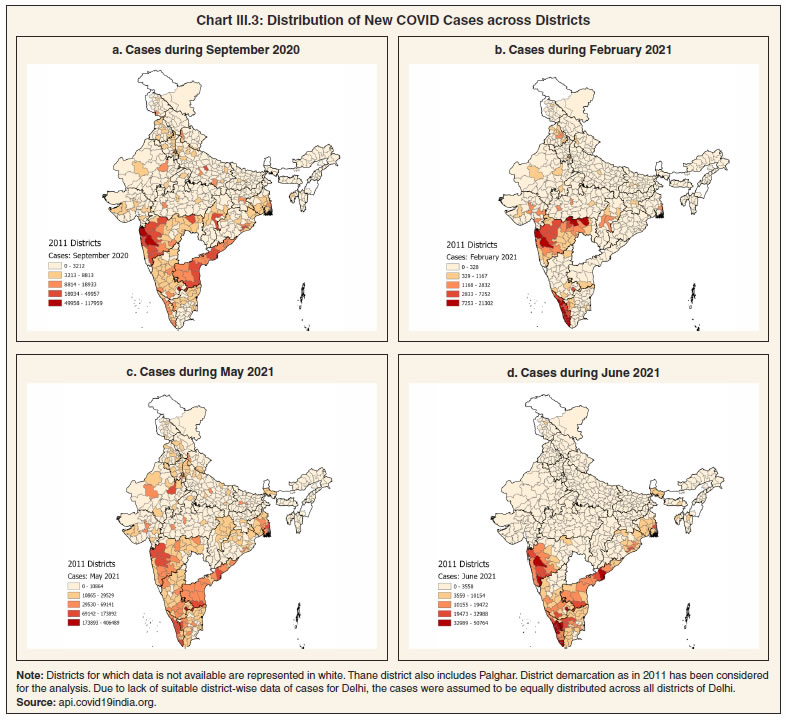 3.8 Spatial autocorrelation6 measured by Global Moran’s I7 is found to be positive and statistically significant during all months from May 2020 to June 2021, denoting the presence of clusters (Chart III.4). The value of the statistic is, however, higher when infections are low (e.g., during November 2020-February 2021), suggesting a higher degree of clustering when the cases are low than otherwise. 3.9 In a cluster and outlier analysis, a district with high infections which is also surrounded by districts with high infections, is represented as a high-high cluster. A high-low outlier refers to a district that has a high cases but is surrounded by districts with low cases. Likewise, low caseload districts that are surrounded by districts with high infections are denoted as low-high outliers and if the district as well as surrounding districts have low infections, it is represented as a low-low cluster. High-high clusters were mostly observed in Peninsular India. In contrast, districts in North-East India, Ladakh, and Uttar Pradesh were generally found to be low-low clusters. High-low outliers were mostly observed during the peak infection months of September 2020 and May 2021 in the districts of Ahmedabad, Surat, Bhopal, Jabalpur, Prayagraj, Ranchi, Kota, Patna, Vadodara, Gwalior, Lucknow and Gorakhpur. Only a few districts emerged as low-high outliers, majorly – Valsad, Krishnagiri, Malkangiri, Wardha, Balaghat (during peak of first wave) and Valsad, Chitradurg, Kodagu, Nilgiris (during peak of second wave) – pointing to successful mitigation strategies (e.g., strict checking at district entry points) or natural advantages (like low population density or better climatic conditions) in these districts (Chart III.5). 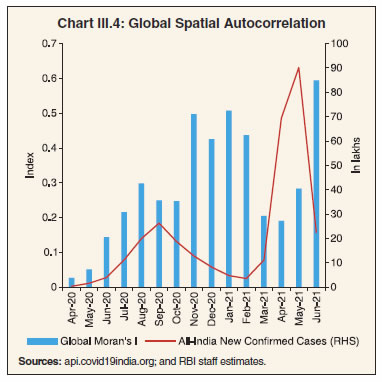 3.10 The identification of hotspots can help in devising control strategies to avoid the spread of infections. Accordingly, the Getis-Ord Gi* statistic8 identified statistically significant hotspots majorly in five districts – Mumbai, Pune, Thane, Raigad and Nellore – at the beginning of the outbreak in May 2020. By September 2020, however, hotspots covered much of Maharashtra, Andhra Pradesh, and parts of Karnataka, Tamil Nadu and Kerala. By February 2021, the number of hotspots had narrowed down to majorly certain districts of Maharashtra and Kerala, and got further confined to primarily within Maharashtra by March 2021. Thereafter, as the COVID cases resurged with the advent of the second wave, Kerala, Tamil Nadu, parts of Maharashtra, Karnataka and Andhra Pradesh, and few districts of West Bengal emerged as significant hotspots. Even when cases ebbed in June, these hotspots remained broadly unchanged (Chart III.6). There could be several factors, both natural (e.g., climatic factors; population density) and social (e.g., migration; severity of government response) that determine the spread of infections (Wang et al., 2021). 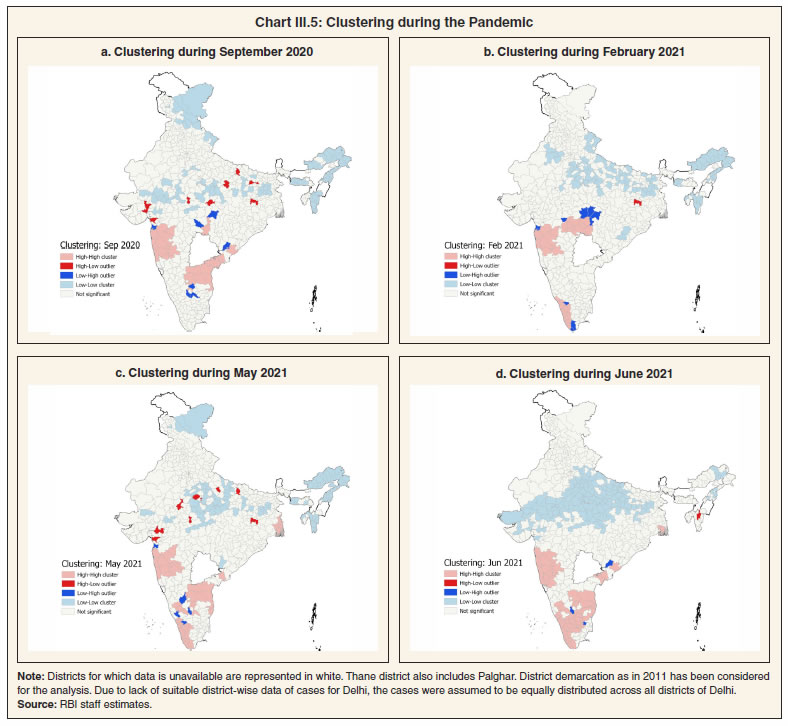 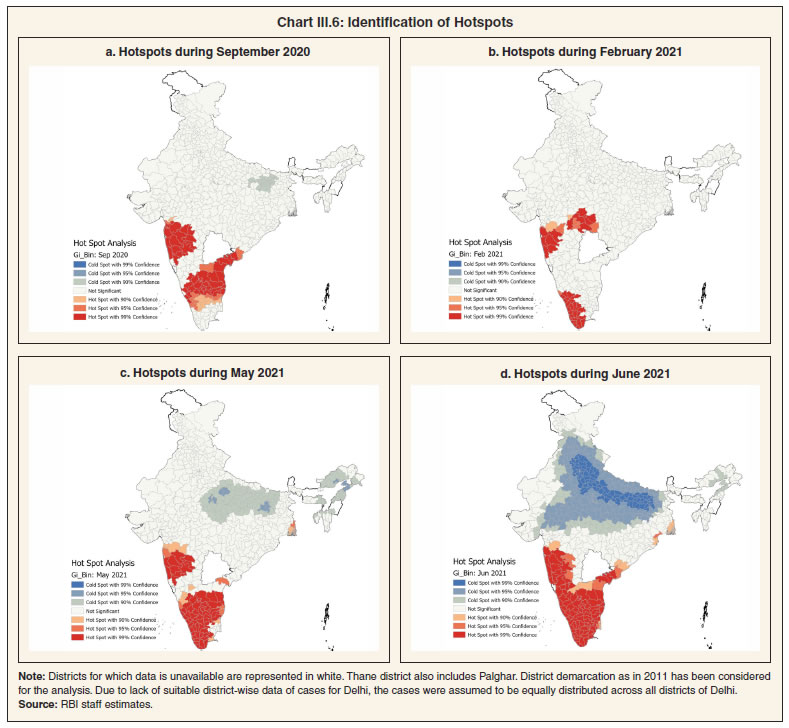 3. Role of Third-Tier Governments in the Pandemic 3.11 The core functions of local governments had to be scaled up rapidly during the pandemic to meet multiple objectives, viz., emergency healthcare need of the people, implementation and enforcement of lockdown restrictions, and uninterrupted delivery of essential services. 3.1 Strategies adopted by Urban Local Bodies 3.12 City government authorities in India9 had to escalate public healthcare services by ramping up testing facilities; setting up makeshift hospitals and quarantine centres; conducting door-to-door surveillance for tracking and contact-tracing; establishing COVID war rooms and 24*7 COVID helplines for providing tele-counselling and tele medicines; containing infections through sanitisation and solid waste management; and augmenting frontline staff capacity. The functioning of administrative and police systems in cities had to be reoriented to enforce lockdown restrictions, night curfews, demarcation of containment zones and entry restrictions in public places. As a part of citizen-centric support, many cities made arrangements for providing shelter, essentials and free food to the poor via community kitchens, tie-ups with food delivery aggregators and other State-run programmes. 3.13 The strategies adopted by various city authorities also leveraged on technology-based smart solutions. For instance, several cities deployed all-in-one mobile COVID-19 tracking apps for tracking and monitoring of COVID-19 cases; used the global positioning system (GPS) and geo-fencing to track the movement of quarantined and health workers; and employed heat mapping technology to draw up containment plans (Annex III.1). Survey Responses 3.14 Responses received from 141 MCs to an online qualitative survey show that some MCs responded in all the relevant areas of concern viz., public health; sanitisation; and enforcing social distancing norms, while others were only required to sanitise public places or enforce social distancing/ activity restrictions (Chart III.7). 3.15 Under healthcare services, MCs made arrangements for COVID testing mainly through the MC-owned hospitals, public health centres and other government hospitals. Given the inadequacy of public health infrastructure, some MCs also made testing arrangements through private hospitals (Chart III.8a). During the second wave of the pandemic, the MCs added hospital beds and created additional quarantine capacity (Chart III.8b). 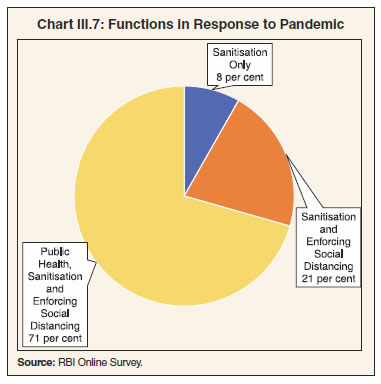 3.16 MCs also took extensive support from private sector and non-governmental organisations (NGOs) to bridge the gap between the steep rise in demand for health and quarantine facilities and the existing infrastructure (Chart III.9). 3.2 Strategies adopted by Panchayati Raj Institutions 3.17 Even though rural districts account for less than 30 per cent10 of total COVID-19 cases in India, the caseload was huge in absolute terms vis-à-vis the medical facilities available in the hinterland. From time to time, the Union Ministry of Panchayati Raj issued advisories to State governments regarding preventive measures to be taken by Gram Panchayats (GPs) to curb the spread of COVID-19 in rural India.11 Based on these guidelines and advisories the GPs undertook a host of measures which inter alia included lockdowns, entry restrictions, formation of Corona Monitoring Committees at the village level, free online medical consultation, awareness programmes, creation of migrants database and free food distribution (Annex III.2). 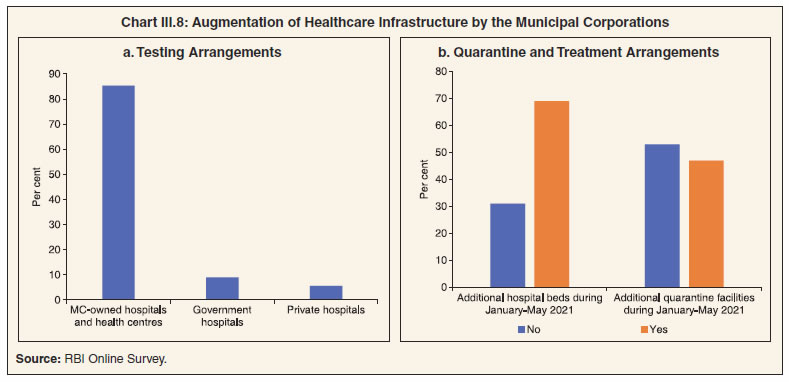 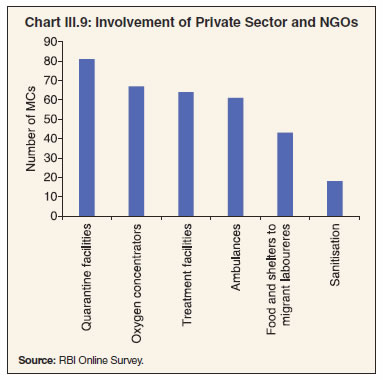 3.3 Progress of Vaccination Roll Out 3.18 With the ebbing of the second wave, the pace of vaccination has picked up across various States in India in recent months. As per information available up to November 27, 2021, 31.0 per cent of India’s population has been fully vaccinated while 52.7 per cent received at least the first dose (Chart III.10).12 Local governments played an important role in the vaccination drive by making arrangements for inoculation in public and private hospitals; authorising and monitoring vaccination camps organised by civic and housing societies; making special transportation arrangement for senior citizens and differently abled people to vaccination centres; and spreading awareness to remove vaccine hesitancy among people. 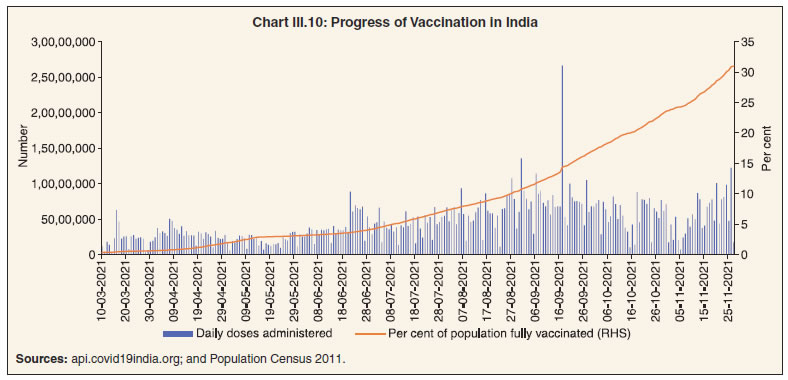 4. Fiscal Impact of COVID-19 on Third-Tier Government 3.19 In line with the global experience, the pandemic has worsened the finances of local governments in India substantially in 2020-21 and 2021-22. It is estimated that local authorities would lose around 15-25 per cent of their revenues in 2021, which may make the maintenance of the current level of service delivery difficult to sustain (Wahba et al. 2021). In rural India, village panchayats struggled for funds during the pandemic (Gurusaravanan, 2021). Similar challenges were encountered by the ULBs. 98 per cent of the respondents to the Reserve Bank’s qualitative survey13 of MCs reported different financial challenges viz., increase in expenditure; decline in revenue collection; and lack (or delayed release) of funds from the State governments during the second wave of the pandemic. 70 per cent of MCs reported a decline in revenue while 71 per cent reported an increase in expenditure (Chart III.11). Several MCs had to cut down expenditure on other areas to make available funds for the COVID response. 3.20 The loss of revenue by MCs seems to have been steeper during the second wave - 22 per cent of them reported revenue loss of more than 50 per cent during the second wave as against 16 per cent during the first wave (Chart III.12a and III.12b). Like in the case of revenue, the impact on expenditure of MCs was more pronounced during the second wave with 11 per cent of them reporting expenditure growth of more than 50 per cent during the second wave as against 6 per cent during the first wave (Chart III.12c and III.12d). 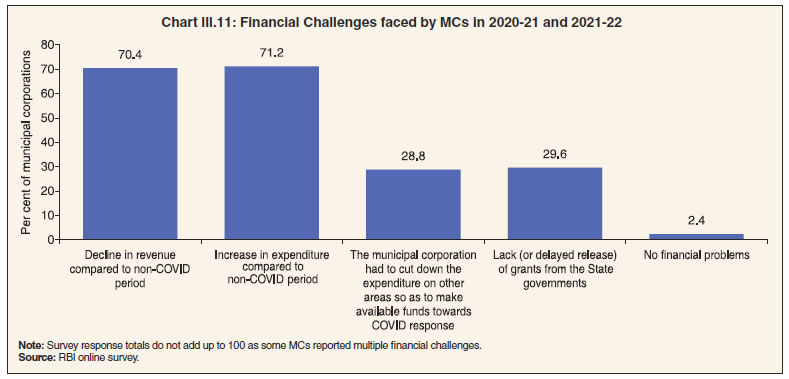 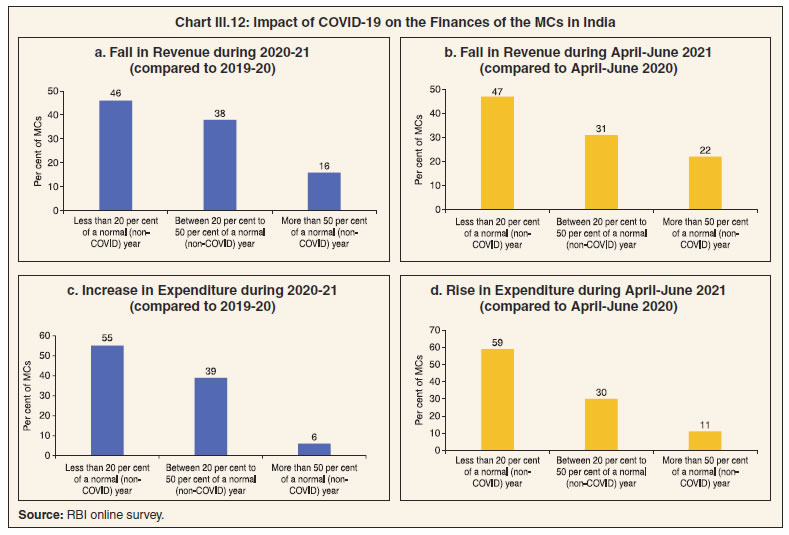 4.1 Impact on Revenue 3.21 Revenue receipts account for around 70 per cent of total receipts of MCs in India whereas capital receipts account for about 30 per cent (Chart III.13). MCs’ revenue receipts largely comprise own tax revenue; non-tax revenue; and transfers from the Central and the State governments. Property tax is the dominant component of own tax revenue, whereas fees and user charges constitute the largest sub-component of non-tax revenue. The share of transfers, predominantly State government transfers, in revenue receipts is significant. The capital receipts of MCs mainly comprise grants, contributions and subsidies from central and State governments and transfers from funds maintained by municipal bodies. The share of borrowings in total receipts of municipal bodies is relatively low (less than 5 per cent). 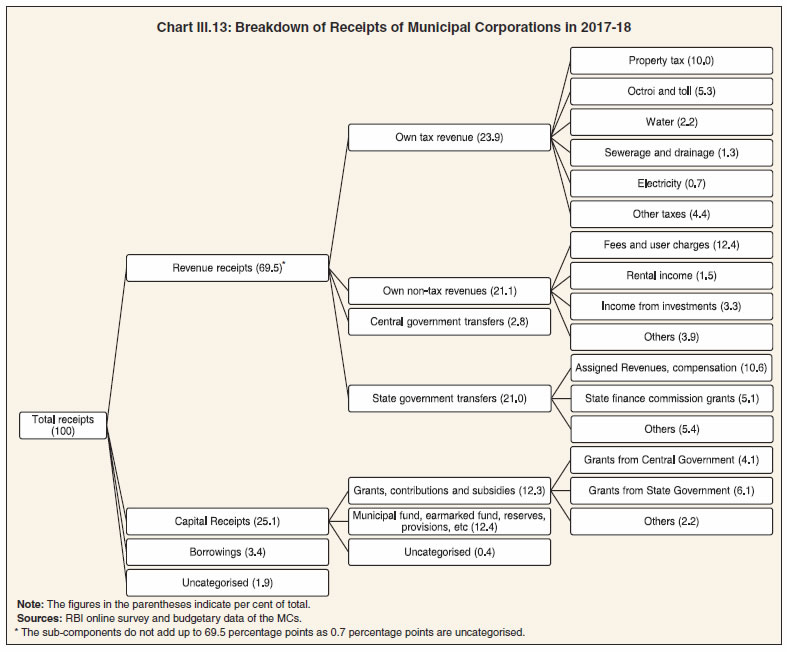 3.22 An analysis of budgetary data on 20 large municipal corporations14 reveals that their tax revenue increased by 7.2 per cent during 2020-21 (revised estimates) over 2019-20 levels (Table III.1). The growth in tax revenue was mainly driven by property taxes whereas collections under water tax, sewerage/drainage tax and octroi and toll tax witnessed sharp declines. Collections under all components of tax revenue during 2020-21 (revised estimates) were significantly lower than the respective budget estimates. Assigned revenues, compensation from State governments and rental income from municipal properties recorded modest growth in 2020-21 (revised estimates) over 2019-20 but remained much lower than the budget estimates. Revenue grants, contributions and subsidies from the Central and the State governments is the only component which overshot the budget estimates, indicative of higher transfers from the upper tiers of the governments to support municipal finances during the first wave of the pandemic. The MCs have budgeted robust growth in almost all components of revenue in 2021-22. 4.2 Impact on Expenditure 3.23 Revenue expenditure accounts for about two thirds of total disbursements of MCs (Chart III.14). Fixed overheads in the form of establishment expenditure (largely towards salaries, wages and bonus, and pensions) account for more than 50 per cent of revenue expenditure. The other large revenue expenditure categories are operational and maintenance expenses and administrative expenses. Capital expenditure accounts for around 30 per cent of total disbursements, and is largely spent on creation of fixed assets. Disbursement towards repayment of borrowings has a relatively low share of around 3 per cent (Chart III.14). 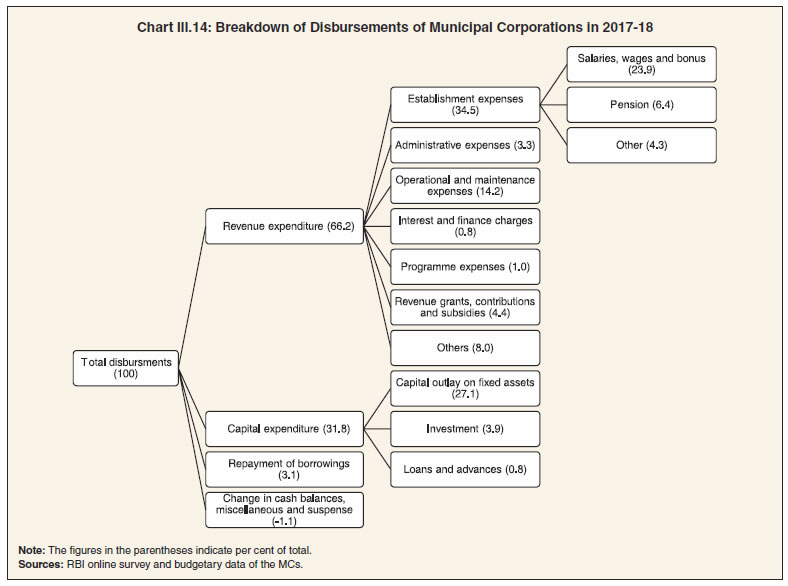 3.24 All the major components of revenue expenditure, viz., establishment expenses, administrative expenses, operation and maintenance expenses and interest and finance charges – most of which are committed in nature – witnessed an increase in 2020-21 (revised estimates) over 2019-20 (Table III.2). Establishment expenses of the MCs (salaries, wages, bonus and pension), however, were lower than the budget estimates, reflecting efforts by MCs to cutback on expenses in view of the revenue shortfall. Capital expenditure of the MCs recorded robust growth in 2020-21 (revised estimates) albeit remaining lower than the budgeted amount. The MCs have budgeted modest growth in all components of revenue expenditure in 2021-22, and robust growth in capital expenditure. 3.25 The MCs’ expenditure on public services, viz., health, sanitation, roads and education witnessed robust growth in 2020-21 but fell short of budget estimates (Table III.3). The MCs have budgeted strong growth in expenditure under all major categories of public services in 2021-22, anticipating the need for continuance of COVID-19 related expenses. The MCs’ inability to meet the budgetary target of expenditure on public services in 2020-21 even at the time of pandemic reflects their fiscal constraints arising out of revenue shortfalls and limited opportunities for market borrowings, as statutorily they cannot run a deficit (Box III.1). Increasing fiscal stress of the MCs may act as a hindrance to effective mitigation of future pandemic-type crises (Box III.2).
5. Steps taken by the Municipal Corporations to fill Resource Gaps 3.26 Before the onset of the pandemic, the consolidated revenue balance21 of the MCs was in surplus. Budgetary data relating to 20 large MCs indicate that their combined revenue surplus22 declined in 2020-21, with many of them recording either a fall in the revenue surplus or an increase in the revenue deficit (Chart III.15a). Segregating MCs into revenue surplus (group A) and revenue deficit (group B) categories, it is observed that the reduction in the surpluses of group A MCs was sharper than the increase in the revenue deficit of group B MCs (Chart III.15b). 3.27 MCs adopted a combination of measures to bridge COVID-19-induced resource gaps. The survey responses reveal that apart from reduction of non-essential expenditure, the MCs also mobilised additional funding from multiple sources such as borrowing, grants from the States and the Centre, reserves, municipal funds, deposits in State Disaster Response Funds (SDRF), issuances of COVID bonds, donations and contribution (Chart III.16), which are discussed below. Additional Funding Support from the Central and State Governments 3.28 The international experience reveals that Central governments across the world announced fiscal measures to help sub-national governments cope with the fiscal shocks23 imparted by the pandemic. For instance, two-thirds of the OECD countries have adopted funding measures in support of sub-national governments (OECD, 2020). In India, MCs receive grants from the States and the Centre to bridge their financial gaps. Revenue grants are given to run current expenses, while capital grants are disbursed to run project-specific expenses (which are long-term in nature). The FC XV recommended provision of grants amounting to ₹70,051 crore to strengthen and plug critical gaps in the healthcare system. Around 43 per cent of the respondents to the survey reported use of grants from the State governments to meet pandemic-related needs of funding. 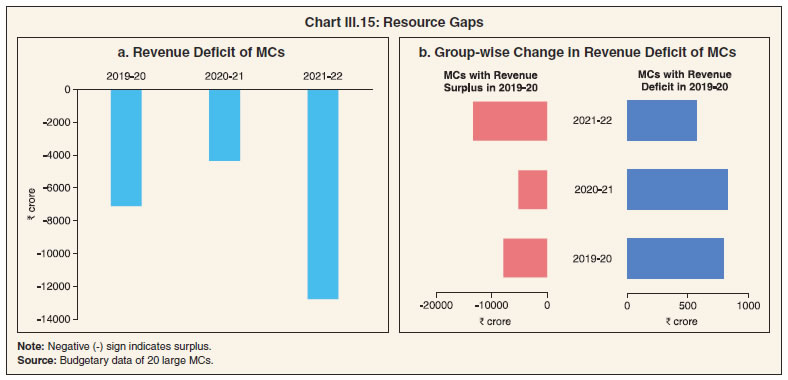 Use of Reserve Funds 3.29 Reserves held by the MCs proved to be the second important source of financing - 19 per cent of the survey respondents reported drawing from reserve funds to meet the resource gap. These reserves are linked to either the infrastructure sector or committed liabilities such as provident and pension funds. Ideally, the infrastructure-linked funds should be channelised towards capital expenditure with long-term growth prospects so as to form a source of future income. The fiscal stress caused by the pandemic forced MCs to withdraw from these reserves. 26 per cent of surveyed MCs indicated that they created special reserve funds to cope with higher spending. 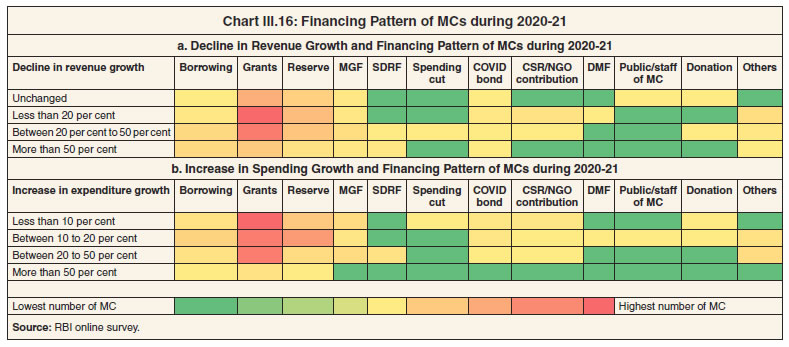 Borrowings 3.30 During the pandemic, MCs largely depended on transfer from upper tiers of the government and their accumulated reserves. Borrowing by MCs came into prominence, albeit in a supplemental role. About 6 per cent of surveyed MCs borrowed from State governments and another 2 per cent borrowed from banks to meet the additional need for funds during the pandemic. Another source of funds was Issuance of bonds. In the pre-COVID period, some MCs had issued municipal bonds at different points of time to finance their infrastructure. For instance, Ahmedabad Municipal Corporation issued a ‘muni bond’ worth ₹200 crore in 2019 (maturity of 5-years and 8.7 per cent coupon), to fund urban infrastructure development. Centre-driven schemes like AMRUT24 were used to incentivise bond issuances by ULBs, resulting in fresh issuances of around ₹1,800 crore worth of municipal bonds by nine MCs25. During the COVID-19 period, Ghaziabad Municipal Corporation issued its first green bond26 in India on April 08, 2021 to raise ₹150 crore with a coupon rate of 8.10 per cent for a tertiary water treatment plant to benefit industries in Ghaziabad. Five MCs responding to the survey issued bonds to finance COVID-related expenditure. Other Sources 3.31 Private participation (including NGOs) in pandemic management also helped ease the MCs’ financial burden. 22 per cent of surveyed MCs availed help from these institutions in different forms such as quarantining, treatment, ambulances, sanitisation, oxygen concentrators, food and shelter. Other sources of funding were District Mineral Funds (DMFs)27, SDRF, contributions from the public, municipal staff and other donations, and additional revenue generated through better tax compliance by providing incentives to taxpayers. Reduction/Freezing of Non-essential/Discretionary Spending 3.32 Among the surveyed MCs, 18 per cent reported expenditure cuts relating to non-essential areas. Guidelines were issued to head of departments to restrict expenditure to a certain proportion of budgeted allocations till a specific month or to incur only essential spending like establishment expenses, spending for COVID prevention, electric charges, payment of property tax, water tax, and urgent repair and maintenance works. Discretionary spending like expenditure on renovation and decoration of office premises, purchase and hiring of additional vehicles except for health/sanitation work/carrying emergency staff, and withdrawal from the general provident fund (GPF) except for urgent treatment, education, and marriage-related expenditure were restricted. 3.33 The impact of the pandemic has been heterogeneous across time and space, warranting the adoption of localised approaches for crisis management rather than a centralised response. During the second wave, the third-tier echelons of government became frontline pandemic warriors. Their involvement in the COVID-19 response became the catalyst for forging vistas of cooperation with civil society, NGOs and the private sector in mitigating the pandemic’s impact. It is in this context that a key lesson can be derived from the pandemic experience – the importance of strengthening local government finances. 3.34 Before the pandemic, local governments across the world suffered from insufficient budgets, over reliance on funds from upper tiers of government, lack of access to new sources of revenue, limited autonomy to change/introduce taxes, and low levels of taxpayer compliance. COVID-19 amplified these structural constraints on local government finances and brought to the fore new challenges such as revenue volatility and demand for public services and investments in areas which were not required earlier. In other words, COVID-19 has increased the responsibilities of local governments towards delivery of public services manifold. 3.35 In India, the role of MCs in cities that were the hotspots became pivotal. As a consequence, their budgets came under severe strain, forcing them to cut down discretionary spending, use reserves and other contingency funds, including resources from funds linked to the infrastructure sector or committed liabilities. This diversion of funds may have serious consequences for the financial sustainability of cities in the short to medium term. On the positive side, many of the MCs in India have now created special reserve funds to cope with future pandemics. This imparts a degree of resilience to their finances. 3.36 Going forward, increasing the financial autonomy of civic bodies, strengthening their governance structures and financially empowering them via higher resource availability, including through own resource generation are critical for their effective intervention at the grassroot level. 3.37 Financial autonomy notwithstanding, the importance of transfers from upper tiers of the government during a crisis cannot be overemphasised. During the pandemic, inter-governmental transfers were among the least affected sources of revenue. Thus, strengthening and streamlining transfers from upper tiers of government through institutionally sound mechanisms can help fortify the financial stability of MCs. 3.38 There are several facets of municipal finances that merit reforms. Greater fiscal transparency, revitalising the municipal bond market, boosting developmental/infrastructure finance and green finance, exploiting land-based financing opportunities and developing partnerships with impact finance in the private space would all strengthen the third tier, and make it viable and effective, especially in managing and mitigating future crises. 1 Ahluwalia, I., Mohanty, P. K., Mathur, O., Roy, D., Khare, A., and Mangla, S. (2019). ‘State of Municipal Finances in India’, a study prepared for the Fifteenth Finance Commission by the Indian Council for Research on International Economic Relations. See also, Reserve Bank of India (2008). ‘Municipal Finance in India–An Assessment’. Available at https://m.rbi.org.in/scripts/bs viewcontent.aspx. 2 Top 20 districts with total confirmed cases (cumulative) as on October 31, 2021. 3 Number of days in which total cases doubled. 4 Caseload is defined as total cases excluding those that have recovered or deceased, i.e., Caseload = total confirmed cases - (total recovered cases + total deceased cases). 5 Case fatality rate is defined as number of deaths as a per cent of identified/ diagnosed cases. 6 Spatial autocorrelation refers to the presence of systematic spatial variation in a mapped variable. 7 Global Moran’s I statistic is asymptomatically normal. Monte Carlo simulation of a stochastic permutation process computes the test statistic under the null hypothesis that attribute values are randomly distributed across the spatial area under study (Wang et al., 2021). If the p-value is significant with a positive Moran’s I statistic, it suggests spatial clustering (high values are clustered with other high values) and a significant p-value with a negative Moran’s I statistic suggest spatial dispersion (high values repel other high values). 8 Gi(d) measures the concentration or lack of concentration of the sum of values associated with a variable X in the region under study. Gi(d) is a proportion of the sum of all xj values that are within d of i. Gi*(d) is a related statistic which measures association in cases where the j is equal to i term is included in the statistic (Getis and Ord, 1992). 9 Consisting of municipal corporations, municipalities and Nagar Panchayats. 10 Rural districts are defined as districts in which at least 70 per cent of population was categorized as rural in Census. Average from April 2020 till October 2021 has been considered. 11 The Standard Operating Procedure (SoP) issued by the Ministry of Panchayati Raj to the State Governments on May 16, 2021, at the peak of COVID second wave, to be put in place in peri-urban, rural and tribal areas include: (i) surveillance, screening, isolation and referral; (ii) home and community based isolation; (iii) monitoring of active cases in home isolation; (iv) planning for health infrastructure for managing COVID at rural level; (v) post COVID management; (vi) community mobilisation and behaviour change communication; (vii) mental health support at community level; (viii) adequate provision of support services and intersectoral coordination; (ix) undertaking of public health functions by primary/ community health centres in COVID containment operations; (x) preparedness for rapid coverage with COVID vaccination; (xi) non-COVID essential healthcare delivery services; (xii) establishment of COVID-specific call centres at district levels; and (xiii) tribal COVID-care and response strategies for tribal areas. 12 Around 41.9 per cent of India’s adult population has been fully vaccinated while 74.2 per cent received at least the first dose as of November 23, 2021 (Source: RBI staff estimates using PIB release and Electors data of 2019 from Election Commission of India). 13 An online qualitative survey was conducted during July and August 2021. Responses of around 141 municipal corporations were received from across all the states in India. 14 The 20 large MCs include Ahmedabad, Bhavnagar, Chennai, Coimbatore, Greater Warangal, Hyderabad, Kochi, Kolkata, Mumbai, New Delhi, North Delhi, Patna, Rajkot, Shimla, South Delhi, Surat, Thrissur, Vadodara, Vijayawada and Vishakhapatnam, which accounted for around 60 per cent of total receipts and 55 per cent of total expenditure of all MCs in India in 2017-18. 15 Establishment, administrative, ‘operational & maintenance’ expenses, and ‘interest and finance charges’ have been taken as committed expenditure.  17 Severely stressed municipal corporations are classified as those having the probability scores of 0.8 or more. 18 District level vaccination is considered due to lack of suitable data on vaccination at municipal corporation level. The sample consists of around 150 districts with municipal corporations. For districts having more than one municipal corporation, the average fiscal health of the municipal corporations was considered. 19 Data on total receipts pertains to 2019-20. Per capita total receipts is obtained by dividing by district population. 20 Total doses administered as share of population. 21 Revenue expenditure net of revenue receipts (as per the standard practice of this Report). 22 Given the data constraint of capital receipts, we have covered only revenue balance in this section. 23 A survey conducted by Emergency Governance Initiative (EGI) between November 5-December 7, 2020 encompassing 22 countries across all continents revealed that Central governments in countries like Austria, Brazil, Colombia, Estonia, Italy, Japan, Korea, Latvia, Norway, Slovenia, South Africa, Spain and the US have increased grant payments to sub-national governments. 24 Atal Mission for Rejuvenation and Urban Transformation. 25 Pune, Hyderabad, Indore, Bhopal, Vishakhapatnam, Ahmedabad, Surat, Lucknow and Ghaziabad. 26 A Green Bond is a type of bond issued to finance projects that generate environmental benefits, such as renewable energy, energy efficiency, clean transportation and sustainable water projects, among others. 27 District Mineral Foundation (DMF) is meant for the welfare/development of mining-affected people and areas. The funds for DMF will be met from additional contributions of 30 per cent of royalty by existing miners and 10 per cent by miners granted mines after the Mines and Minerals (Development and Regulation) Amendment with effect from January 12, 2015. |

Share this page:


Install the RBI mobile application and get quick access to the latest news!
Scan the QR code to install our app


Page Last Updated on:


