Broad money growth accelerated during
2006-07, and remained above the indicative trajectory projected by the Reserve
Bank at the beginning of the fiscal year. Bank credit continued to grow at a strong
pace for the third successive year, albeit with some moderation. Deposits
exhibited sharp growth and enabled financing of sustained high demand for credit.
Banks’ investments in SLR securities increased during the year, but the
pace of expansion did not keep pace with the expansion in their net demand and
time liabilities (NDTL). As a result, banks’ SLR investments, as a proportion
of their NDTL, declined further during 2006-07. The Reserve Bank continued to
modulate market liquidity with the help of repo and reverse repos under the liquidity
adjustment facility (LAF), issuance of securities, including dated securities,
under the Market Stabilisation Scheme (MSS) and the cash reserve ratio (CRR).
The task of liquidity management was complicated during 2006-07 due to large variations
in market liquidity on account of variations in cash balances of the Governments
and capital flows.
Monetary Survey
Broad money
(M3) growth, year-on-year (y-o-y), accelerated to 20.8 percent as at end-March
2007 from 17.0 per cent a year ago. Expansion in the residency-based new monetary
aggregate (NM3) – which does not directly reckon non-resident foreign currency
deposits such as FCNR(B) – also accelerated from 18.1 per cent as at end-March
2006 to 20.4 per cent as at end-March 2007. Growth in liquidity aggregate, L1,
at 20.0 per cent was also higher than that of 18.1 per cent a year ago. Growth
in NM3 as at end-March 2007 was marginally lower than that in on M3. Growth in
L1 was marginally lower than that in NM3 account of lower growth in postal deposits
vis-à-vis bank deposits (Chart 14 and Table
22).
Taking into account, inter alia, high growth in monetary
aggregates, sustained growth in credit offtake, trends in liquidity absorbed under
LAF/MSS, challenges emanating from the effects of capital flows on liquidity,
acceleration in inflation, growth in real GDP, expectations of the private corporate
sector of higher increase in prices of both inputs and outputs, reports of growing
strains on domestic capacity utilisation, global developments in monetary management
and the paramount need to contain inflationary expectations, the Reserve Bank
has announced an increase of 150 basis points in the cash reserve ratio (CRR)
in phases from December 2006 (see also Chapter IV). The first round of increase
in the CRR, announced on December 8, 2006, of 50 basis points – 25 basis
points each – was effective in the fortnights 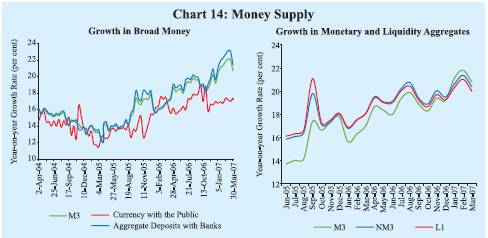
beginning
December 23, 2006 and January 6, 2007. The second round of the increase, announced
on February 13, 2007, also of 50 basis points – 25 basis points
Table
22: Monetary Indicators | (Amount
in Rupees crore) | Item
| Outstanding as
on March 31,
2007 | Variation
| 2005-06
| 2006-07 |
Amount | Per
cent | Amount | Percent |
1 | 2 | 3 | 4 | 5
| 6 | I. | Reserve
Money | 7,08,950 | 83,922 | 17.2 | 1,35,892
| 23.7 |
II. | | | | 9,59,875 | 1,43,825 | 21.1 | 1,33,497
| 16.2 |
| Narrow
Money (M1) | | | | | |
III. | | | | 32,96,919 | 3,96,881 | 17.0 | 5,67,372
| 20.8 |
| Broad
Money (M3) | | | | | |
| a) | Currency
with the Public | 4,84,171 | 58,248 | 16.4 | 71,052
| 17.2 |
| b) | Aggregate
Deposits | 28,05,261 | 3,38,081 | 17.1 | 4,95,704
| 21.5 |
| | i) | Demand
Deposits | 4,68,216 | 85,025 | 26.5 | 61,829
| 15.2 |
| | ii) | Time
Deposits | 23,37,045 | 2,53,056 | 15.3 | 4,33,875
| 22.8 |
| | | of
which: Non-Resident Foreign Currency Deposits | 66,242 | -16,876 | -22.2 | 6,967
| 11.8 |
IV. | | | | 33,06,958 | 4,21,126 | 18.1 | 5,59,370
| 20.4 |
| NM | 3 | | | | | | |
| of
which: Call Term Funding from FIs | 86,151 | 11,224 | 15.6 | 3,007
| 3.6 | V. | a) | | | 34,21,762 | 4,36,397 | 18.1 | 5,70,256
| 20.0 |
| | L1 | | | | | | |
| | of
which: Postal Deposits | 1,14,804 | 15,271 | 17.2 | 10,886
| 10.5 |
| b) | | | 34,24,694 | 4,37,206 | 18.1 | 5,70,256
| 20.0 |
| | L2 | | | | | | |
| c) | | | 34,50,758 | 4,41,207 | 18.1 | 5,72,479
| 19.9 |
| | L3 | | | | | | |
VI. | Major
Sources of Broad Money | | | | | |
| a
) | Net Bank Credit to the Government
(i+ii) | 8,32,867 | 17,888 | 2.4 | 66,272
| 8.6 | | | i) | Net
Reserve Bank Credit to Government | 4,362 | 35,799 | | -3,775
| | | | ii) | Other
Banks’ Credit to Government | 8,28,505 | -17,910 | -2.3 | 70,046
| 9.2 | | b) | Bank
Credit to Commercial Sector | 21,23,290 | 3,61,746 | 27.2 | 4,30,287
| 25.4 |
| c) | Net
Foreign Exchange Assets of Banking Sector | 9,30,319 | 78,291 | 12.1 | 2,04,125
| 28.1 |
| Memo: | | | | | | |
| SCBs
Aggregate Deposits | 25,94,259 | 3,23,913 | 18.1 | 4,85,210
| 23.0 |
| SCBs
Non-food Credit | 18,76,672 | 3,54,193 | 31.8 | 4,10,285
| 28.0 |
SCBs : Scheduled Commercial Banks.
FIs : Financial Institutions.
NBFCs : Non-Banking Financial Companies.
NM3 is the residency-based broad money aggregate and L1, L2 and L3
are liquidity aggregates compiled on the recommendations of the Working Group
on Money Supply
(Chairman: Dr. Y.V. Reddy, 1998).
Liquidity aggregates are defined
as follows:
L1= NM3 + Select deposits with the post office saving banks.
L2 = L1 +Term deposits with FIs + Term borrowing by FIs + Certificates of deposits
issued by FIs.
L3 = L2 + Public deposits of non-banking financial companies.
Note:
1. Data are provisional.
2. Data reflect redemption
of India Millennium Deposits (IMDs) on December 29, 2005.
3. Government balances
as on March 31, 2007 are before closure of accounts.
4. Variation during 2006-07
is worked out from March 31, 2006, whereas variation during 2005-06 is worked
out from April 1, 2005. | each – was effective in
the fortnights beginning February 17, 2007 and March 3, 2007. On March 30, 2007,
the Reserve Bank announced a further increase of 50 basis points in the CRR –
25 basis points each – effective in the fortnights beginning April 14, 2007
and April 28, 2007. As a result of the above increases in the CRR, an amount of
about Rs.43,000 crore of resources of banks is likely to be absorbed.
Amongst
the major components of M3, growth in currency with the public was 17.2 per cent,
year-on-year (y-o-y), as at end-March 2007 as compared with 16.4 per cent a year
ago (Table 22). Currency with the public followed the usual
seasonal pattern, contracting during the second quarter and expanding during the
remaining quarters (Table 23). On a y-o-y basis, growth in
demand deposits (15.2 per cent) as at end-March 2007 was of a lower order than
a year ago (26.5 per cent). As a result, growth in narrow money, M1, decelerated
to 16.2 per cent as at end-March 2007 from 21.1 per cent a year ago.
Table
23: Monetary Aggregates – Variations | (Rupees
crore) | Item | 2005-06 | 2006-07 | 2006-07
| Q1 | Q2 | Q3 | Q4 |
1 | 2 | 3 | 4 | 5 | 6 | 7 |
| (=1+2+3=4+5+6+7-8) | 3,96,881 | 5,67,372 | 55,414 | 1,65,809 | 62,607 | 2,83,542 |
M3 | | | | | | | | |
Components | | | | | | |
1. | Currency with
the Public | 58,248 | 71,052 | 23,797 | -3,091 | 27,849 | 22,497 |
| | | (16.4) | (17.2) | | | | |
2. | Aggregates
Deposits with Banks | 3,38,081 | 4,95,704 | 33,227 | 1,68,447 | 35,253 | 2,58,777 |
| | | (17.1) | (21.5) | | | | |
| 2.1 | Demand
Deposits with Banks | 85,025 | 61,829 | -42,399 | 41,595 | -7,462 | 70,094 |
| | | (26.5) | (15.2) | | | | |
| 2.2 | Time
Deposits with Banks | 2,53,056 | 4,33,875 | 75,626 | 1,26,851 | 42,715 | 1,88,682 |
| | | (15.3) | (22.8) | | | | |
3. | ‘Other’
Deposits with Banks | 552 | 617 | -1,610 | 453 | -495 | 2,269 |
Sources | | | | | | |
4. | Net Bank Credit
to Government | 17,888 | 66,272 | 23,431 | 15,705 | -13,091 | 40,227 |
| | | (2.4) | (8.6) | | | | |
| 4.1 | RBI’s
net credit to Government | 35,799 | -3,775 | 53 | 2,826 | -12,754 | 6,100 |
| | 4.1.1
RBI’s net credit to Centre | 33,374 | -1,042 | 3,071 | 2,584 | -12,568 | 5,871 |
| 4.2 | Other
Banks’ Credit to Government | -17,910 | 70,046 | 23,378 | 12,879 | -337 | 34,127 |
5. | Bank Credit
to Commercial Sector | 3,61,746 | 4,30,287 | 14,930 | 1,39,859 | 76,271 | 1,99,227 |
| | | (27.2) | (25.4) | | | | |
6. | Net Foreign
Exchange Assets of Banking Sector | 78,291 | 2,04,125 | 58,087 | 20,197 | 43,160 | 82,682 |
| 6.1 | Net
Foreign Exchange Assets of RBI | 61,545 | 1,93,170 | 71,845 | 11,392 | 27,250 | 82,682 |
7. | Government’s
Currency Liabilities to the Public | 1,306 | -525 | -920 | 155 | 166 | 75 |
8. | Net Non-Monetary
Liabilities of Banking Sector | 62,351 | 1,32,786 | 40,114 | 10,107 | 43,898 | 38,668 |
| | | | | | | | |
Memo: | | | | | | | |
Non-resident Foreign Currency Deposits with
SCBs | -16,876 | 6,967 | 3,917 | 1,671 | 1,233 | 145 |
SCBs’ Call-term Borrowing from FIs | 11,224 | 3,007 | 3,118 | -1,576 | -4,468 | 5,933 |
Overseas Borrowing by SCBs | 1,295 | 2,543 | 3,301 | -3,685 | -2,774 | 5,702 |
| | | | | | | | |
SCBs : Scheduled Commercial Banks.
Note
:
1. Variation during 2006-07 is worked out from March 31, 2006,
whereas the variation
during 2005-06 is worked out from April 1, 2005.
2.
Figures in parentheses are percentage variations.
3. Data reflect redemption
of India Millennium Deposits (IMDs) on December 29, 2005.
4. Government balances
as on March 31, 2007 are before closure of accounts. | Growth
in time deposits of banks accelerated to 22.8 per cent, y-o-y, as at end-March
2007 from 15.3 per cent a year ago (Chart 15) which could
be attributed, inter alia, to higher economic activity, increase in interest
rates on deposits and extension of tax benefits under Section 80C for deposits
with maturity of five years and above. Interest rates on time deposits of 1-3
years maturity offered by public sector banks increased from a range of 5.75-6.75
per cent in March 2006 to 7.25-9.50 per cent in March 2007. Rates offered by private
sector banks on deposits of similar maturity increased from a range of 5.50-7.75
per cent to 6.75-9.75 per cent over the same period. Concomitantly, postal deposits,
with unchanged interest rates, witnessed a deceleration in growth to 10.5 per
cent in February 2007 from 17.2 per cent a year ago.
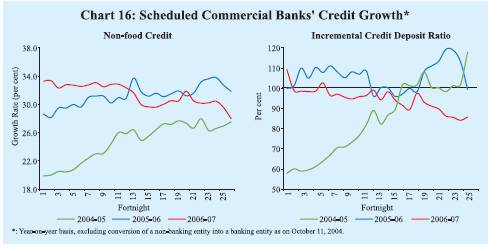
Demand for bank
credit continued to remain strong during 2006-07, albeit with a marginal
deceleration. On a year-on-year basis, scheduled commercial banks’ (SCBs’)
non-food credit registered a growth of 28.0 per cent as at end-March 2007 on top
of 31.8 per cent a year ago. The incremental credit-deposit ratio of SCBs, after
remaining above/around 100 per cent for the most part between October 2004 and
September 2006, has exhibited some moderation in subsequent months reflecting
the combined impact of acceleration in deposit growth and modest deceleration
in credit growth. As at end-March 2007, the incremental credit-deposit ratio was
around 86 per cent (y-o-y) as compared with 110 per cent a year ago (Chart
16). Scheduled commercial banks’ food credit rose by 14.3 per cent during
2006-07 as compared with an increase of 1.7 per cent in the previous year.
Disaggregated data available up to December 2006 show that credit growth
has been largely broad-based. About 35 per cent of incremental non-food credit
was absorbed by industry and another 12 per cent by agriculture. Personal loans
absorbed 29 per cent of the incremental non-food credit, mainly as loans to the
housing sector 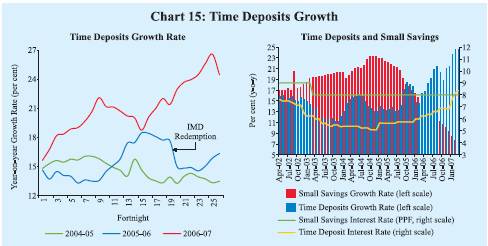
and
‘other retail loans’. Loans to commercial real estate, which increased
by 66.7 per cent, y-o-y, absorbed 4.1 per cent of incremental non-food credit
(Table 24). Against the backdrop of continuing high credit
growth to the real estate sector, outstanding credit card receivables, loans and
advances qualifying as capital market exposure and personal loans, the Reserve
Bank in its Third Quarter Review (January 2007) raised provisioning requirements
in respect of the standard assets in the aforesaid four categories of loans and
advances (excluding residential housing loans) to two per cent from one per cent.
The provisioning requirement for banks’ exposures in the standard assets
category to the non-deposit taking systemically important non-banking financial
companies (NBFCs) was raised to two per cent from 0.4 per cent; the risk weight
for banks’ exposure to such NBFCs was also raised to 125 per cent from 100
per cent. In addition to bank credit for financing their requirements, the
corporate sector continued to rely on a variety of non-bank sources of funds such
as capital markets, external commercial borrowings and internal funds. Resources
raised through domestic equity issuances during 2006-07 (Rs.28,595 crore) were
more than double of those raised in 2005-06. Mobilisation through issuances of
commercial papers during 2006-07 registered a turnaround, notwithstanding some
sluggishness in the second half of the year. Resources raised through markets
abroad – equity issuances (ADRs/GDRs) and external commercial borrowings
–also increased substantially during 2006-07. While amounts raised through
ADRs/ GDRs increased to Rs.16,184 crore during 2006-07 from Rs.7,263 crore a year
ago, net disbursements under external commercial borrowings (ECBs) increased to
Rs.48,328 crore during April-December 2006 from Rs.27,228 crore during April-December
2005. Finally, internal sources of funds continued to provide large financing
support to the domestic corporate sector during the first three quarters of 2006-07.
Profits after tax of select non-financial non-government companies during April-
December 2006 were almost 43 per cent higher than the corresponding period
of 2005 (Table 25).
Table
24: Deployment of Non-food Bank Credit | (Amount
in Rupees crore) | Sector/Industry | Outstanding
as on
December22, 2006 | Year-on-year
Variation | December
23, 2005 | December
22, 2006 | Absolute | Per
cent | Absolute | Per
cent | 1
| 2 | 3 | 4 | 5 | 6 |
Non-food Gross Bank Credit
(1 to 4) | 16,23,653 | 2,83,487 | 33.3 | 3,84,785 | 31.1 |
1. | Agriculture
and Allied Activities | 1,97,763 | 41,771 | 39.6 | 46,991 | 31.2 |
2. | Industry
(Small, Medium and Large) | 6,25,309 | 86,215 | 25.0 | 1,35,929 | 27.8 |
| Small
Scale Industries | 1,00,599 | 12,717 | 18.7 | 18,822 | 23.0 |
3. | Personal
Loans | 4,27,909 | n.a. | n.a. | 1,10,613 | 34.9 |
| Housing | 2,17,829 | n.a. | n.a. | 50,622 | 30.3 |
| Advances
against Fixed Deposits | 35,764 | 6.016 | 23.1 | 3,634 | 11.3 |
| Credit
Cards | 11,913 | n.a. | n.a. | 3,595 | 43.2 |
| Education | 13,399 | n.a. | n.a. | 4,418 | 49.2 |
| Consumer
Durables | 8,558 | -1,084 | -13.5 | 1,615 | 23.3 |
4. | Others | 3,72,672 | n.a. | n.a. | 91,252 | 32.4 |
| Transport
Operators | 22,610 | n.a. | n.a. | 10,598 | 88.2 |
| Professional
and Others | 19,379 | n.a. | n.a. | 6,
051 | 45.4 |
| Trade | 99,194 | n.a. | n.a. | 23,139 | 33.9 |
| Real
Estate Loans | 39,642 | 14,201 | 155.4 | 15,859 | 66.7 |
| Non-Banking
Financial Companies | 38,150 | 10,111 | 59.4 | 7,456 | 24.3 |
| | | | | | |
Memo: | | | | | |
| | | | | | |
Priority Sector | 5,64,396 | 1,28,773 | 41.7 | 1,12,782 | 25.0 |
Industry (Small, Medium
and Large) | 6,25,309 | 86,215 | 25.0 | 1,35,929 | 27.8 |
Food Processing | 34,492 | 4,094 | 20.1 | 7,033 | 25.6 |
Textiles | 69,305 | 10,891 | 30.7 | 18,
274 | 35.8 |
Paper and Paper Products | 10,140 | 1,723 | 30.9 | 1,775 | 21.2 |
Petroleum, Coal Products and
Nuclear Fuels | 31,021 | 2,962 | 20.6 | 12,441 | 67.0 |
Chemical and Chemical Products | 51,153 | 5,836 | 19.5 | 7,607 | 17.5 |
Rubber, Plastic and their Products | 7,
979 | 2,660 | 92.4 | 1,950 | 32.3 |
Iron and Steel | 58,896 | 10,391 | 38.2 | 14,877 | 33.8 |
Other Metal and Metal Products | 19,727 | 2,821 | 29.6 | 5,737 | 41.0 |
Engineering | 38,439 | 3,976 | 15.6 | 6,306 | 19.6 |
Vehicles, Vehicle Parts and Transport
Equipments | 20,272 | 5,319 | 91.5 | 3,771 | 22.9 |
Gems and Jewellery | 21,795 | 4,572 | 42.3 | 3,613 | 19.9 |
Construction | 16,524 | 2,992 | 38.7 | 4,784 | 40.7 |
Infrastructure | 1,24,271 | 27,802 | 42.2 | 22,197 | 21.7 |
n.a. : Not available.
Note:
1. Data are provisional and relate to select scheduled commercial banks.
2. Owing to change in classification of sectors/industries and coverage of banks,
data
for 2006 are not comparable with earlier data. | Commercial
banks’ investments in gilts increased by 10.0 per cent, y-o-y, as at end-March
2007 as against a decline of 2.7 per cent a year ago (Table 26).
Growth in commercial banks’ investments in gilts was, however, substantially
below the growth of 23.5 per cent in their net demand and time liabilities (NDTL).
As a result, commercial banks’ holdings of Government securities declined
to 28.0 per cent of their NDTL as at end-March 2007 from 31.3 per cent as at end-March
2006
(Chart 17). Excess SLR investments of SCBs fell
to Rs.85,728 crore as at end-March 2007 from Rs.1,45,297 crore as at end-March
2006. Thus, apart from higher deposit growth, excess SLR investments continued
to provide banks the flexibility to sustain strong demand for bank credit. Banks’
balances with the Reserve Bank expanded, reflecting the impact of the increase
in their NDTL as well as the increase in the CRR.
Table
25: Select Sources of Funds to Industry | (Rupees
crore) | Item | 2005-06 | 2006-07 | 2006-07 |
Q1 | Q2 | Q3 | Q4 |
1 | 2 | 3 | 4 | 5 | 6 | 7 |
A. | Bank
Credit to Industry # | 1,27,192 | 74,981* | -2,724 | 49,290 | 28,415 | – |
| | | | (66,244)* | | | | | |
B. | Flow
from Non-banks to Corporates | | | | | | |
| 1.
Capital Issues (i+ii) | 13,781 | 29,180 | 10,627 | 1,882 | 10,840 | 5,831 |
| | i) | Non-Government
Public Ltd. | | | | | | |
| | | Companies
(a+b) | 13,408 | 29,180 | 10,627 | 1,882 | 10,840 | 5,831 |
| | | a)
Bonds/Debentures | 245 | 585 | 0 | 0 | 491 | 94 |
| | | b)
Shares | 13,163 | 28,595 | 10,627 | 1,882 | 10,349 | 5,737 |
| | ii) | PSUs
and Government Companies | 373 | 0 | 0 | 0 | 0 | 0 |
| 2.
ADR/GDR Issues | 7,263 | 16,184 | 4,965 | 2,130 | 924 | 8,165 |
| 3.
External Commercial
Borrowings (ECBs) | 45,078 | 48,328* | 20,503 | 13,651 | 14,174 | – |
| | | | (27,228)* | | | | | |
| 4.
Issue of CPs | -1,517 | 6,384@ | 6,931 | 4,795 | -908 | -4,434@ |
C. | Depreciation
Provision + | 28,883 | 24,557* | 8,449 | 8.892 | 9,172 | – |
| | | | (22,044)* | | | | | |
D. | Profit
after Tax + | 67,506 | 75,460* | 24,845 | 27,710 | 28,698 | – |
| | | | (52,891)* | | | | | |
#: Data pertain to select scheduled
commercial banks. Figures for 2005-06 are not comparable
with those of 2006-07
due to increase in number of banks selected in the sample.
+: Data are based
on audited/ unaudited abridged results of select sample of non-financial non-Government
companies.
Quarterly variations may not add up to annual variation due to
difference in coverage of companies.
*: Data pertain to April-December.
@ : Up to March 15, 2007.
Note: 1. Data are provisional.
2. Data on capital issues pertain to gross issuances excluding issues by banks
and financial institutions. Figures are not adjusted for banks’ investments
in capital issues, which are not expected to be significant.
3. Data on ADR/GDR
issues exclude issuances by banks and financial institutions.
4. Data on ECBs
include short-term credit. Data for 2005-06 are exclusive of the IMD redemption. |
Table
26: Scheduled Commercial Bank Survey | (Amount
in Rupees crore) | Item | Outstanding
as on
March 30, 2007 | Variation
(year-on-year) | As
on March 31, 2006 | As
on March 30, 2007 | Amount | Per
cent | Amount | Per
cent | 1 | 2 | 3 | 4 | 5 | 6 |
Sources of Funds | | | | | |
1. | Aggregate
Deposits | 25,94,259 | 3,23,913 | 18.1 | 4,85,210 | 23.0 |
2. | Call/Term
Funding from FIs | 86,151 | 11,224 | 15.6 | 3,007 | 3.6 |
3. | Overseas
Foreign Currency Borrowings | 32,377 | 1,295 | 4.5 | 2,543 | 8.5 |
4. | Capital | 33,868 | 5,705 | 21.2 | 1,254 | 3.8 |
5. | Reserves | 1,66,290 | 34,616 | 31.3 | 21,177 | 14.6 |
Uses of Funds | | | | | |
1. | Bank
Credit | 19,23,192 | 3,54,868 | 30.8 | 4,16,115 | 27.6 |
| of
which: Non-food Credit | 18,76,672 | 3,54,193 | 31.8 | 4,10,285 | 28.0 |
2. | Investments
in Government Papers | 7,71,060 | -19,514 | -2.7 | 70,318 | 10.0 |
3. | Investments
in Other Approved Securities | 21,100 | -3,295 | -16.5 | 4,388 | 26.3 |
4. | Investments
in Non-SLR Securities | 1,43,750 | -11,838 | -8.0 | 8,410 | 6.2 |
5. | Foreign
Currency Assets | 39,287 | 14,059 | 47.8 | -4,207 | -9.7 |
6. | Balances
with the RBI | 1,80,222 | 34,077 | 36.6 | 53,161 | 41.8 |
Note: Data are
provisional. | 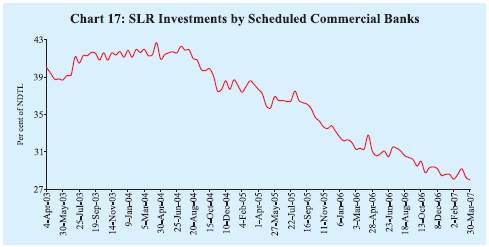
Reserve
Money Survey
Reserve money expanded by 23.7 per cent, y-o-y, as on
March 31, 2007 as compared with 17.2 per cent a year ago (Chart
18). Adjusted for the first round effects of the hikes in the CRR, reserve
money growth (y-o-y) was 18.9 per cent as on March 31, 2007. 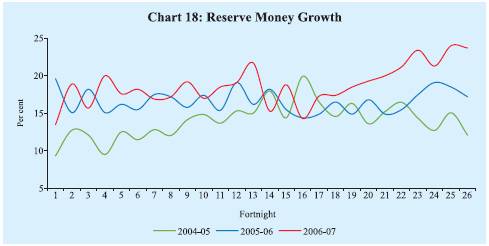
Growth
in reserve money during 2006-07 was driven largely by the expansion in the Reserve
Bank’s net foreign assets (NFA). The Reserve Bank’s foreign currency
assets (net of revaluation) increased by Rs.1,64,601 crore during 2006-07 as compared
with an increase of Rs.68,834 crore during the previous year (Table
27 and Chart 19). More than one-half of the increase
in the Reserve Bank’s foreign currency assets (net of revaluation) during
2006-07 took place in the fourth quarter.
Table
27: Reserve Money | (Rupees
crore) | | Outstanding
as on
March 31, 2007 | Variation
during | 2005-06 | 2006-07 | 2006-07
| Q1 | Q2 | Q3 | Q4 |
1 | 2 | 3 | 4 | 5 | 6 | 7 | 8 |
Reserve Money | | 7,08,950 | 83,922 | 1,35,892 | 13,470 | 18,666 | 14,210 | 89,546 |
(= 1+2+3 = 4+5+6+7-8) | | (17.2) | (23.7) | | | | |
Components | | | | | | | | |
1. | Currency
in Circulation | 5,04,167 | 62,015 | 73,491 | 22,283 | -2,011 | 26,871 | 26,348 |
| | | | (16.8) | (17.1) | | | | |
2. | Bankers’
Deposits with RBI | 1,97,295 | 21,515 | 61,784 | -7,204 | 20,224 | -12,165 | 60,929 |
| | | | (18.9) | (45.6) | | | | |
3. | ‘Other’
Deposits with the RBI | 7,487 | 393 | 617 | -1,610 | 453 | -495 | 2,269 |
| | | | (6.1) | (9.0) | | | | |
Sources | | | | | | | | |
4. | RBI’s
net credit to Government | 4,362 | 26,111 | -3,775 | 53 | 2,826 | -12,754 | 6,100 |
| of
which: to Centre (i+ii+iii+iv-v) | 4,118 | 28,417 | -1,042 | 3,071 | 2,584 | -12,568 | 5,871 |
| i.
Loans and Advances | 0 | 0 | 0 | 0 | 0 | 0 | 0 |
| ii.
Treasury Bills held by the RBI | 0 | 0 | 0 | 0 | 0 | 0 | 0 |
| iii.
RBI’s Holdings of Dated | | | | | | | |
| Securities | | 97,172 | 13,869 | 26,763 | -27,610 | 24,944 | 22,733 | 6,696 |
| iv.
RBI’s Holdings of Rupee coins | 12 | 7 | -143 | 9 | -107 | 97 | -142 |
| v.
Central Government Deposits | 93,066 | -14,541 | 27,662 | -30,672 | 22,253 | 35,398 | 683 |
5. | RBI’s
credit to banks and | | | | | | | |
| commercial
sector | | 9,173 | 535 | 1990 | -3,135 | 3,107 | 2,065 | -47 |
6. | NFEA
of RBI | | 8,66,153 | 60,193 | 1,93,170 | 71,845 | 11,392 | 27,250 | 82,682 |
| | | | (9.8) | (28.7) | | | | |
| of
which : | | | | | | | | |
| FCA,
adjusted for revaluation | – | 68,834 | 1,64,601 | 28,107 | 10,948 | 31,634 | 93,913 |
7. | Governments’
Currency | | | | | | | |
| Liabilities
to the Public | 8,229 | 1,306 | -525 | -920 | 155 | 166 | 75 |
8. | Net
Non-Monetary liabilities of RBI | 1,78,967 | 4,222 | 54,968 | 54,373 | -1,186 | 2,517 | -736 |
| | | | | | | | | |
Memo: | | | | | | | | |
Net Domestic Assets | | -1,57,203 | 23729 | -57277 | -58,376 | 7,274 | -13,040 | 6,864 |
Reserve Bank’s Primary
Subscription | | | | | | | |
to Dated Securities | | 0 | 10,000 | 0 | 0 | 0 | 0 | 0 |
LAF, Repos (+) / Reverse Repos
(-) | 29,185 | 12,080 | 36,435 | -23,060 | 28,395 | 22,195 | 8,905 |
Net Open Market Sales # * | – | 3,913 | 5,125 | 1,536 | 1,176 | 389 | 2,024 |
Mobilisation under MSS | * | 62,974 | -35,149 | 33,912 | 4,062 | 8,940 | -3,315 | 24,225 |
Net Purchases(+)/Sales(-) from | | | | | | | |
Authorised Dealers | | – | 32,884 | 1,07,347@ | 21,545 | 0 | 19,776 | 66,026@ |
NFEA/Reserve Money £ | | 122.2 | 117.4 | 122.2 | 127.0 | 125.0 | 126.5 | 122.2 |
NFEA/Currency £ | | 171.8 | 156.3 | 171.8 | 164.4 | 167.7 | 164.0 | 171.8 |
NFEA: Net Foreign Exchange Assets.
FCA : Foreign Currency Assets.
@: up to end-February 2007.
*: At face
value.
# : Excludes Treasury Bills
£ : per cent, end of period.
Note: 1.Data are based on March 31 for Q4 and last reporting
Friday for all other quarters.
2.Figures in parentheses are percentage variations
during the fiscal year.
3.Government balances as on March 31, 2007 are before
closure of accounts. | 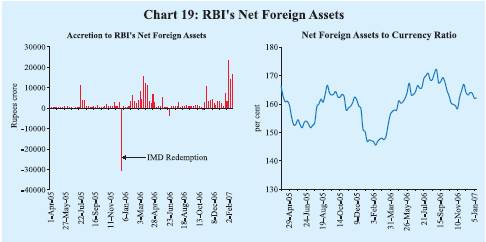
Mirroring
the liquidity management operations, the Reserve Bank’s net credit to the
Centre declined by Rs.1,042 crore in 2006-07 as against an increase of Rs.28,417
crore in the previous year. The decline in net RBI credit to the Centre during
2006-07 could be attributed mainly to an increase in balances under MSS (Rs.33,912
crore) and open market sales (Rs.5,125 crore), partly offset by increase in repo
balances under LAF (Rs.36,435 crore).
Liquidity Management
During 2006-07, the Reserve Bank continued with its policy of active management
of liquidity through open market operations (OMO) including MSS, LAF and CRR,
and using all the policy instruments at its disposal flexibly. The liquidity management
operations during the year were aimed at ensuring maintenance of appropriate liquidity
in the system so that all legitimate requirements of credit, particularly for
productive purposes, are met, consistent with the objective of price and financial
stability. However, the task of liquidity management was complicated during 2006-07,
with greater variation in market liquidity, largely reflecting variations in cash
balances of the Governments and capital flows.
During the first quarter
of 2006-07, unwinding of the Centre’s surplus balances with the Reserve
Bank and the Reserve Bank’s purchase of foreign exchange from authorised
dealers resulted in ample liquidity into the banking system. This was mirrored
in an increase in the LAF reverse repo balances. Liquidity conditions continued
to remain easy during the most part of the second quarter of 2006-07. Balances
under the MSS also rose between May 2006 and September 2006, following the re-introduction
of auctions under the MSS in May
2006. However, in view of some build-up
of Government cash balances with the Reserve Bank during August-September 2006,
there was a decline in balances under LAF reverse repos during the second quarter
(Table 28).
Around mid-September 2006, liquidity
conditions turned tight on account of advance tax outflows and festival season
currency demand. The Reserve Bank, accordingly, injected liquidity through repos
on eight occasions between mid-September 2006 and end-October 2006. However, there
was net injection of liquidity only on two occasions (October 20 and October 23,
2006). Liquidity pressures eased by end-October 2006 following some decline in
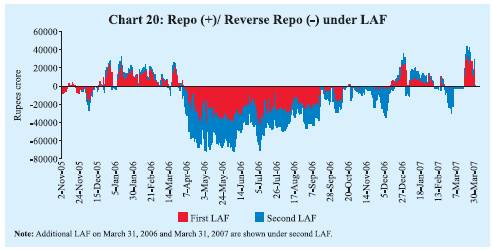
Government cash balances (Table 29). Liquidity conditions
eased further during November 2006, partly reflecting purchases of foreign exchange
by the Reserve Bank. Balances under LAF reverse repos started rising from the
third week of November 2006, reaching Rs 34,255 crore as on December 6, 2006 (Chart
20).
Liquidity conditions, however, again turned tight from the second
week of December 2006 largely due to advance tax outflows and announcement of
increase in the CRR by 50 basis points. The Centre’s surplus with the Reserve
Bank increased from Rs.31,305 crore at end-November 2006 to Rs.73,534 crore as
on December 22, 2006. In view of the prevailing liquidity conditions, the Reserve
Bank injected liquidity into the system through repo operations from December
13, 2006. Average daily net injection of liquidity by the Reserve Bank amounted
to Rs.15,013 crore during December 13, 2006 in contrast to the average daily absorption
of Rs.12,262 crore and Rs.9,937 crore during October and November 2006, respectively.
Concomitantly, balances under the MSS declined during September-December 2006
in view of under-subscription in some of the auctions.
Although the Centre’s
surplus declined during January 2007, liquidity conditions remained tight, partly
reflecting the impact of the CRR hike. The Reserve Bank continued to inject liquidity
through LAF operations during January 2007 (except for January 3-5, when there
were net absorption of liquidity). Daily net injection of liquidity averaged Rs.10,738
crore during January 2007.
Table
28: Reserve Bank's Liquidity Management Operations |
(Rupees crore) |
Item | 2005-06 | 2006-07 | 2006-07 |
| | Q1 | Q2 | Q3 | Q4 | Jan. | Feb. | Mar. |
1 | 2 | 3 | 4 | 5 | 6 | 7 | 8 | 9 | 10 |
A. | Drivers
of Liquidity (1+2+3+4) | -31,696 | 60,981 | 36,247 | -16,683 | -25,903 | 67,320 | 22,708 | 26,744 | 17,868 |
1. | RBI’s Foreign Currency
Assets | | | | | | | | | |
| (adjusted for revaluation) | 68,834 | 1,64,601 | 28,517 | 10,538 | 34,821 | 90,725 | 13,304 | 56,780 | 20,641 |
2. | Currency with the Public | -57,256 | -71,052 | -19,648 | -1,058 | -27,296 | -23,050 | -10,306 | -10,283 | -2,461 |
3. | Surplus Cash balances
of the Centre | | | | | | | | | |
| with the Reserve Bank | -22,726 | -1,164 | 40,207 | -26,199 | -30,761 | 15,590 | 23,088 | -10,621 | 3,123 |
4. | Others (residual) | -20,547 | -31,405 | -12,828 | 36 | -2,667 | -15,945 | -3,379 | -9,131 | -3,435 |
| | | | | | | | | | |
B. | Management
of Liquidity (5+6+7+8) | 57,969 | -24,257 | -39,003 | 32,026 | 31,625 | -48,905 | -29,051 | -28,817 | 8,963 |
5. | Liquidity impact of LAF
Repos | 12,080 | 36,435 | -35,315 | 40,650 | 33,600 | -2,500 | -20,240 | -18,385 | 36,125 |
6. | Liquidity impact of OMO
(Net) * | 10,740 | 720 | 545 | 145 | 25 | 5 | 0 | 0 | 5 |
7. | Liquidity impact of MSS | 35,149 | -33,912 | -4,232 | -8,769 | 4,750 | -25,660 | -2,061 | -3,432 | -20,167 |
8. | First round liquidity
impact | | | | | | | | | |
| due to CRR change | 0 | -27,500 | 0 | 0 | -6,750 | -20,750 | -6,750 | -7,000 | -7,000 |
| | | | | | | | | | |
C. | Bank
Reserves (A+B) # | 26,273 | 36,724 | -2,756 | 15,343 | 5,722 | 18,415 | -6,343 | -2,073 | 26,831 |
(+) : Indicates injection of liquidity into
the banking system.
(-) : Indicates absorption of liquidity from the banking
system.
# : Includes vault cash with banks and adjusted for first round liquidity
impact due to CRR change.
* : Adjusted for Consolidated Sinking Funds (CSF)
and Other Investments and including private placement.
Note : Data
pertain to March 31 and last Friday for all other months. |
Table
29: Liquidity Management | (Rupees
crore) | Outstanding as on
last
Friday of | LAF | MSS | Centre's
Surplus
with the RBI @ | Total
(2 to 4) | 1 | 2 | 3 | 4 | 5 |
2005 | | | | |
March* | 19,330 | 64,211 | 26,102 | 1,09,643 |
April | 27,650 | 67,087 | 6,449 | 1,01,186 |
May | 33,120 | 69,016 | 7,974 | 1,10,110 |
June | 9,670 | 71,681 | 21,745 | 1,03,096 |
July | 18,895 | 68,765 | 16,093 | 1,03,753 |
August | 25,435 | 76,936 | 23,562 | 1,25,933 |
September | 24,505 | 67,328 | 34,073 | 1,25,906 |
October | 20,840 | 69,752 | 21,498 | 1,12,090 |
November | 3,685 | 64,332 | 33,302 | 1,01,319 |
December | -27,755 | 46,112 | 45,855 | 64,212 |
2006 | | | | |
January | -20,555 | 37,280 | 39,080 | 55,805 |
February | -12,715 | 31,958 | 37,013 | 56,256 |
March* | 7,250 | 29,062 | 48,828 | 85,140 |
April | 47,805 | 24,276 | 5,611 | 77,692 |
May | 57,245 | 27,817 | 0 | 85,062 |
June | 42,565 | 33,295 | 8,621 | 84,481 |
July | 44,155 | 38,995 | 8,770 | 91,920 |
August | 23,985 | 42,364 | 26,791 | 93,140 |
September | 1,915 | 42,064 | 34,821 | 78,800 |
October | 12,270 | 40,091 | 25,868 | 78,229 |
November | 15,995 | 37,917 | 31,305 | 85,217 |
December | -31,685 | 37,314 | 65,582 | 71,211 |
2007 | | | | |
January | -11,445 | 39,375 | 42,494 | 70,424 |
February | 6,940 | 42,807 | 53,115 | 1,02,862 |
March* | -29,185 | 62,974 | 49,992 | 83,781 |
@ : Excludes minimum cash balances
with the Reserve Bank.
* : Data pertain to March 31.
Note :
Negative sign in column 2 indicates injection of liquidity through LAF repo. |
Liquidity
conditions eased from the second week of February 2007, partly reflecting the
purchases of foreign exchange from authorised dealers. LAF window witnessed net
absorption of liquidity during February 8 - March 4, 2007 (except during February
15-20, 2007). Taking into account, inter alia, the liquidity conditions,
the Reserve Bank, on February 13, 2007, announced another increase of 50 basis
points in the CRR – 25 basis points each – effective in the fortnights
beginning February 17, 2007 and March 3, 2007. Furthermore, on a review
of the liquidity conditions, the Reserve Bank on March 2, 2007 announced modifications
in liquidity management operations. An enhanced MSS programme was put in place
to restore LAF as a facility for equilibrating very short-term mismatches and
modulating the liquidity it absorbs through the daily reverse repo auctions. It
was decided to use a mix of Treasury Bills and dated securities for MSS issuances
in a more flexible manner keeping in view the capital flows in the recent period,
the assessment of volatility and durability of capital flows, and the paramount
importance attached to liquidity management in containing inflation. Concomitantly,
beginning March 5, 2007, daily reverse repo absorptions were restricted to a maximum
of Rs.3,000 crore comprising Rs.2,000 crore in the First LAF and Rs.1,000 crore
in the Second LAF. Reflecting the modified arrangements, the balances under the
LAF remained at around Rs.3,000 crore during March 5-15, 2007 while those under
the MSS increased from Rs.42,807 crore at end-February 2007 to Rs.62,974 crore
by March 31, 2007.
Liquidity conditions tightened from March 16, 2007
in view of advance tax outflows, the concomitant increase in the Centre’s
surplus from Rs.36,476 crore as on March 9, 2007 to Rs.77,006 crore as on March
23, 2007 and the effect of the CRR hike. Accordingly, the Reserve Bank injected
liquidity through repo operations, averaging Rs.31,254 crore during March 16-30,
2007. On March 21, 2007, the Reserve Bank clarified that the recourse to LAF by
market participants should not be persistent in order to fund balance sheets for
credit needs of customers, but banks could utilise the funds borrowed under this
facility for inter-bank lending. Such inter-bank lending is part of normal money
market functioning and enables daily liquidity management by market participants
with temporary mismatches. At the request of the market participants, the Reserve
Bank conducted an additional LAF auction between 3.30 PM and 4.00 PM on March
31, 2007.
Liquidity conditions eased in early April 2007, partly on account
of the reduction in the Centre's surplus. Balances under LAF repos, net of reverse
repos, fell from Rs.29,185 crore as on March 31, 2007 to Rs.1,455
crore as on April 8, 2007. During April 9-15, 2007, there was net absorption of
liquidity. Absorptions under the reverse repo remained limited to a maximum of
Rs.3,000 crore in accordance with the modified arrangements. There was again net
injection of liquidity during April 16-18, 2007, averaging Rs.16,988 crore daily. |
 IST,
IST,


