 IST,
IST,


III. The External Economy
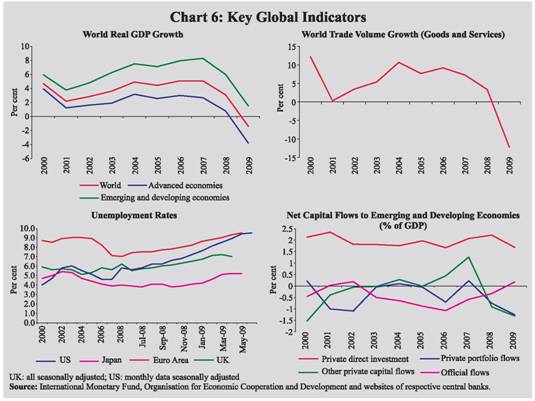
The current account of India’s balance of payments (BoP) recorded a surplus of US$ 4.7 billion in the last quarter of 2008-09, after seven consecutive quarters of deficit. The pressure on the capital account in terms of net outflows that had started in the third quarter of the year, continued even during the fourth quarter. For the year as a whole, net capital flows fell from US$ 108.0 billion in 2007-08 to US$ 9.1 billion in 2008-09, while the current account deficit widened from 1.5 per cent of GDP to 2.6 per cent of GDP during the same period. The impact of a severe external shock on India’s BoP was managed with a loss of reserves of only US$ 20.1 billion (net of valuation) without resorting to any extraordinary measure. The latest available information on certain indicators of capital account suggests revival in capital flows to India during 2009-10 so far.The contraction in exports and imports, however, continues. III.1 The adverse external environment in terms of a prolonged global recession,associated contraction in global trade and reversal in the pattern of capital flows continued to influence India’s BoP during the fourth quarter of 2008-09.The impact of the global economic slowdown was reflected in the negative growth of exports that started in the third quarter of 2008-09 and became more pronounced during the fourth quarter. The transmission of the contagion through the capital flow channel was manifested in net outflows in the capital account, with the fourth quarter outflows exceeding the levels witnessed in the third quarter. During 2009-10 so far, however, there are indications about a revival in capital flows.India’s foreign exchange reserves increased from US$ 252 billion at end-March 2009 to US$ 266 billion by July 17, 2009. International Developments III.2 The synchronised global economic downturn continues to dampen the outlook, notwithstanding the fact that the pace of contraction has weakened considerably and there are tentative signs of bottoming out of the crisis.The timing and the pace of global recovery, however, continues to be uncertain and available projections from leading international institutions do not suggest any sharp recovery in the near term. Recent successive revisions of the growth outlook for 2009 from the International Monetary Fund (IMF) have been in the downward direction. According to the World Economic Outlook (WEO), released by the IMF on July 8,2009,the global economy is projected to remain in recession,recording a growth of -1.4 percent during 2009(GDP at purchasing power parity weights). III.3 According to the World Bank’s Global Development Finance released in June 2009, global GDP (at market exchange rates) could decline by a record 2.9 per cent in 2009 with modest recovery of 2.0 per cent in 2010 and 3.2 per cent in 2011. According to the OECD Economic Outlook (June 2009), financial conditions remain tight in spite of some recent easing and the bottom of the recession is likely to be reached only in the second half of 2009 with a possible weak recovery thereafter. III.4 The global financial crisis impacted the world economy through various channels.In addition to the growth slowdown and trade contraction worldwide, the advanced economies were affected by rising unemployment rates leading to massive loss of employment, while the emerging market economies (EMEs) experienced significant reversal in capital flows (Chart 6). III.5 The slackening growth impulses in the world economy emerging from the global financial crisis continued to impinge on the world merchandise trade. As per the IMF projections (July 2009), world trade volume (goods and services) is expected to shrink by 12.2 per cent in 2009 from 2.9 per cent growth in 2008 (Table15). The slowdown in world merchandise exports, witnessed since November 2008, persisted during 2009 with first two months recording much sharper decline.According to International Financial Statistics of the IMF, world merchandise exports (in dollar terms), witnessed a sharp negative growth (-29.3 per cent) during 2009 (January-February), as against significant growth achieved during the corresponding period a year ago (23.9 per cent).Exports from advanced economies declined by 31.3 per cent (23.0 per cent a year ago), while exports from emerging and developing economies contracted by 27.3 per cent in January 2009 (26.9 per cent growth a year ago) (Table 16).
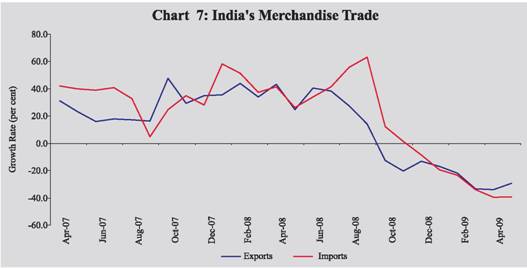
Merchandise Trade Exports III.6 The impact of contagion by way of the trade channel was clearly evident - through first deceleration, and then decline in export performance. Exports have declined on month-on-month basis since October 2008 for eight successive months (Chart 7). With the emerging slackness in domestic growth and economic activity during the second half of the year, imports also witnessed a sharp slowdown.
III.7 In terms of composition of exports, manufactured goods continued to account for bulk of the share with 65.9 per cent, followed by petroleum products and primary products during 2008-09 (April-February). All major commodity groups exhibited major slowdown, barring engineering goods (Table 17). III.8 In terms of the major markets for India’s exports, developing countries and OECD countries were the major destinations, with each group accounting for 39.3 per cent share, followed by the OPEC (19.4 per cent share) during 2008- 09 (April-February). The US continued to be the single largest market for India’s exports, notwithstanding its falling share in 2008-09 (Table 18). Imports III.9 After a phase of strong growth up to September 2008, imports growth witnessed a deceleration during October- November 2008, before turning negative thereafter. The decline in imports was the sharpest during April 2009 (-39.4 per cent) in relation to the high growth recorded during April 2008 (41.4 per cent). The decline in imports was on account of both oil and non-oil imports, reflecting the decline in the international oil prices and the moderation in the domestic economic activity, respectively.
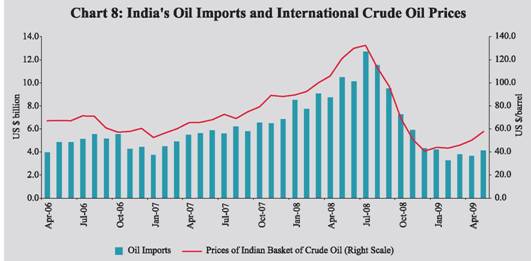
III.10 Commodity-wise, POL imports recorded significant deceleration in growth (22.4 per cent) in 2008-09 (April-February) from the high growth during the corresponding period a year ago (35.3 per cent), mainly due to the fall in international crude oil prices since August 2008 and partly due to the slowdown in the volume of POL imports (Chart 8). Non-POL imports growth also witnessed a moderation (21.4 per cent, from 32.0 per cent) driven by deceleration in imports of capital goods, gold, silver and chemicals. The imports of pearls, precious and semiprecious stones and edible oil, however, exhibited higher growth during the period (Table 19).
III.11 In terms of sources of imports, OPEC had the highest share (33.2 per cent), followed by the developing countries and OECD countries during 2008-09 (April-February). China continued to be the single largest source of imports, with a share of 10.7 per cent in total imports. III.12 India's merchandise trade deficit widened from 7.5 per cent of GDP in 2007-08 to 10.1 per cent in 2008-09. However, the merchandise trade deficit declined during 2009-10 (April-May) over the corresponding period of the previous year, reflecting the sharper decline in the imports in relation to exports (Table 20).
Balance of Payments Current Account III.13 During 2008-09, export growth, on balance of payments basis, declined to 5.4 per cent from a high growth of 28.9 per cent in 2007-08. Import growth also declined sharply to 14.3 per cent from 35.2 per cent during the same period. Consequently, on a BoP basis, the trade deficit widened to 10.3 per cent of GDP in 2008-09 from 7.8 per cent of GDP in 2007-08. After recording deficit in three successive quarters of 2008-09, the current account in India's BoP turned surplus in the last quarter, notwithstanding continued ramifications of the depressed global demand conditions. The negative growth in exports that had started during the third quarter of 2008-09, became more pronounced in the fourth quarter (-24.2 per cent); however, the import growth also turned negative (-27.3 per cent) during the same quarter after a gap of almost seven years, driven mainly by lower crude oil prices and lower non-oil imports mirroring subdued domestic economic activity. As a result, the trade deficit moderated during the fourth quarter of 2008-09 (Table 21). Invisibles III.14 Gross invisibles receipts and payments, which had slowed down significantly during the third quarter of 2008-09, recorded negative growth during the fourth quarter, reflecting the impact of global recession (Table 22). The decline in invisibles receipts during the fourth quarter of 2008-09 was due to decline in all the three major heads namely, services, private transfers and investment income. Nevertheless, during the year as a whole, invisibles receipts recorded a positive growth, supported mainly by the export of software services and private transfer receipts. Invisibles payments recorded sharp decline during the fourth quarter of 2008-09, driven by significant decline in payments under transportation, software services, business services and financial services accounts. For the year as a whole, invisibles payments showed a marginal negative growth. As a result, net invisibles (i.e., invisibles receipts minus payments) showed an improvement (7.7 per cent of GDP) during 2008-09 from the level a year ago (6.4 per cent of GDP), which was possible primarily on account of higher receipts under private transfers and software services. At this level, the invisibles surplus financed about 75.0 per cent of trade deficit during 2008-09 as against 81.4 per cent during 2007-08.
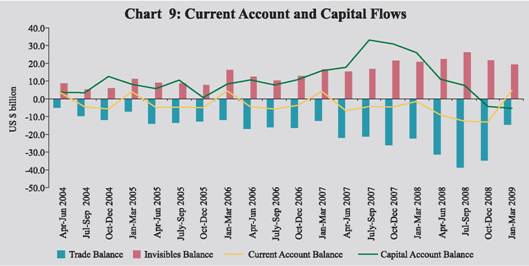
III.15 The lower trade deficit on account of larger decline in imports relative to exports coupled with sustained invisibles surplus resulted in a turnaround in the current account to a modest surplus during the fourth quarter of 2008-09, after recording deficits for seven consecutive quarters (Chart 9). For the year as a whole, however, the larger trade deficit mainly on account of higher growth in imports relative to exports in the first three quarters of the year led to a higher current account deficit at US$ 29.8 billion (2.6 per cent of GDP) during 2008-09 than US$ 17.0 billion (1.5 per cent of GDP) during 2007-08.
Capital Account III.16 The pressure on the capital account that had started in the third quarter of 2008-09, reflecting the massive deleveraging during post-September 2008 in the advanced financial markets persisted even in the fourth quarter. The pressure was evident in the form of lower inflows and higher outflows, yielding net outflows in the last two quarters of 2008-09. Capital outflows were mainly driven by large outflows under portfolio investment, banking capital and short-term trade credit. Notwithstanding increased risk aversion on the part of international investors and tightness in the overseas credit markets, which affected other types of capital flows, inflows under foreign direct investment (FDI) and non-resident Indian (NRI) deposits displayed resilience, reflecting continued attractiveness of India as a long-term investment destination and also the positive impact of various policy measures undertaken for improving certain types of inflows in response to the global financial crisis. It is important to note that net capital flows declined from US$ 108.0 billion in 2007-08 to US$ 9.1 billion in 2008-09 (Table 23). III.17 Component-wise, net inward FDI flows to India remained buoyant during 2008-09, manifesting confidence in India’s long-term growth prospects and relatively better investment climate in India that has been facilitated by gradual liberalisation measures to attract FDI. During 2008-09, FDI to India was channelled mainly into manufacturing sector (21.1 per cent) followed by financial services (19.4 per cent) and construction sector (9.9 per cent). Despite deepening of global recession, overseas investment by the Indian corporates remained high during 2008-09, indicating the Indian corporates’ objective of reaping economies of scale, having better access to technology and acquiring presence in offshore markets to withstand the global competition, besides the lower valuations of assets on account of the crisis.
III.18 Portfolio investment, comprising mainly investment by foreign institutional investors (FIIs) in the Indian capital market and issuance of American depository receipts (ADRs)/global depository receipts (GDRs), witnessed large net outflows during 2008-09 due to large sales of equities by FIIs in the Indian stock market, reflecting bearish market conditions and slowdown in the global economy, and also prompted by the global presence of deleveraging and the anxiety driven flight to safety. Net external commercial borrowing (ECB) inflows too slowed down in 2008-09, as disbursements under ECBs to India more than halved from their level in the previous year, reflecting the transmission of shocks from the credit freeze in advanced economies. Notwithstanding higher net inflows under the NRI deposits in response to hikes in ceiling interest rates on such deposits, banking capital flows turned negative during 2008-09 mainly on account of outflows under overseas borrowings and foreign assets of commercial banks. III.19 Despite apprehensions in the second half of 2008-09 on the availability of short-term trade credit due to tightness in the global credit markets, the gross disbursements reached US$ 39.7 billion during 2008-09 (US$ 48.9 billion in 2007-08), facilitated by various policy measures undertaken such as hike in the all-in-cost ceilings for trade credits of various maturities that was necessary in the context of hardening of cost of funds in the international markets. Hence, financing of short-term trade credit did not pose any significant problem in India, contrary to market perceptions prevailing at some point. III.20 Notwithstanding the persisting stress in the global financial markets, the latest available information on certain indicators of the capital account suggests a revival in capital flows to India (Table 24).This could be attributed to relatively better macroeconomic performance of India during 2008-09 on the back of various fiscal and monetary stimulus measures as also the positive perceptions of global investors about India's growth potential.The global recovery in risk appetite also led to correction in the stock markets around the world, which facilitated higher inflows to the Indian stock markets.
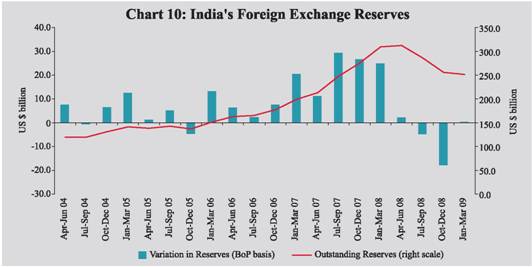
Foreign Exchange Reserves III.21 During 2008-09, India's foreign exchange reserves declined by US$ 58.0 billion, down from US$ 309.7 billion as at the end of March 2008 to US$ 251.7 billion as at end-March 2009. Of this decline of US$ 58.0 billion, US$ 37.9 billion was on account of valuation changes, and the balance of US $ 20.1 billion decline reflected the financing needs of the BoP. Thus, the impact of an unprecedented external shock on India's BoP was managed with reserve loss of only US$ 20.1 billion, without resorting to any extraordinary measure. In fact the capital account was further liberalised in certain areas such as outward FDI and buyback of FCCBs. Despite net capital outflows, the foreign exchange reserves on BoP basis (i.e., excluding valuation) increased marginally by US$ 0.3 billion during the fourth quarter of 2008-09, mainly due to a modest surplus achieved in the current account. This was in contrast to significant drawdown of reserves witnessed in the previous two quarters of 2008-09 (Chart 10). III.22 India’s foreign exchange reserves, which had declined to US$ 251.7 billion at end-March 2009, however, increased subsequently to US$ 266.2 billion by July 17, 2009, with portfolio flows reversing the earlier trend and turning significantly positive during 2009-10 so far (Table 25).
External Debt III.23 During 2008-09, India's external debt increased by US$ 5.3 billion (2.4 per cent) to US$ 229.9 billion as at end-March 2009 over the level at end-March 2008 (Table 26). The increase in external debt stock during 2008-09 was essentially due to increase in trade credits. Long-term debt increased by US$ 2.9 billion as at end-March 2009 mainly due to increase in buyers’ credit. NRI deposits declined by US$ 2.1 billion during the year, reflecting valuation changes. Debt denominated in the US dollar, accounted for 57.1 per cent of total external debt as at end-March 2009. III.24 The debt sustainability indicators remained at comfortable levels at end-March 2009. The debt service ratio, which has been declining steadily over the years, stood at 4.6 per cent as at end-March 2009. The ratio of short-term to total debt, however, increased marginally to 21.5 per cent as at end-March 2009 from 20.9 per cent as at end-March 2008. Further, the ratio of short-term debt to foreign exchange reserves increased to 19.6 per cent as compared with 15.2 per cent during the above period. India’s foreign exchange reserves provided a cover of 109.6 per cent to the external debt stock at end-March 2009 (137.9 per cent at end-March 2008). III.25 Based on residual maturity, the total short-term debt obligations accounted for 40.6 per cent of the total external debt outstanding at end-March 2009. The total short-term debt in terms of residual maturity (US$ 93.3 billion) at end-March 2009 consists of short-term debt based on original maturity of US$ 49.4 billion and long- term external debt due for repayment within one year of US$ 43.9 billion.Out of the US$ 43.9 billion, the NRI deposits constitute the major portion (US$ 32.1 billion), which are more likely to be rolled over going by the past trend.
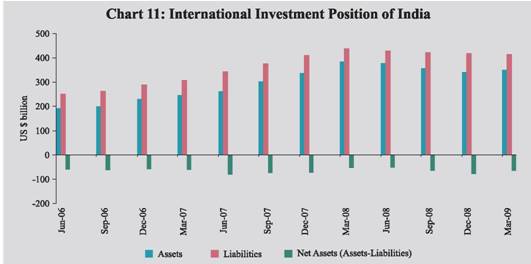
International Investment Position III.26 During 2008-09, India's net international liabilities (i.e., gross liabilities minus gross assets) increased by US$ 12.5 billion to US$ 65.3 billion by end-March 2009, as the decline in international assets was more than the decline in international liabilities (Chart 11).The decline in international assets was mainly on account of decrease in reserve assets amounting to US$ 57.7 billion. The decline in international liabilities could be mainly attributed to outflow by FIIs under portfolio equity investment. Quarter -wise analysis shows that net international liabilities declined by US $ 13.2 billion during the fourth quarter of 2008-09 over the previous quarter on account of an increase in international assets coupled with a decline in international liabilities. Increase in international assets was mainly contributed by direct investment abroad and other investments under trade credits and currency and deposits.Outflow by FIIs from portfolio equity investment during January-March 2009 and the effect of valuation changes contributed to the decline in international liabilities in the fourth quarter of 2008-09 over the previous quarter. III.27 Thus, India’s balance of payments continued to display resilience and the dampening effects of global economic downturn and contraction in trade were managed without embarking on any extraordinary measures.The shrinking trade deficit on account of larger decline in imports relative to exports coupled with sustained invisibles surplus resulted in a turnaround in the current account,leading to a surplus during the fourth quarter of 2008-09.The pressures on capital account persisted even during the fourth quarter of 2008-09 and as a result capital flows during the year as a whole showed a marked decline.During the first quarter of 2009-10 there has been a revival of capital inflows while exports and imports continue to contract. |
|||||||||||||||||||||||||||||||||||||||||||||||||||||||||||||||||||||||||||||||||||||||||||||||||||||||||||||||||||||||||||||||||||||||||||||||||||||||||||||||||||||||||||||||||||||||||||||||||||||||||||||||||||||||||||||||||||||||||||||||||||||||||||||||||||||||||||||||||||||||||||||||||||||||||||||||||||||||||||||||||||||||||||||||||||||||||||||||||||||||||||||||||||||||||||||||||||||||||||||||||||||||||||||||||||||||||||||||||||||||||||||||||||||||||||||||||||||||||||||||||||||||||||||||||||||||||||||||||||||||||||||||||||||||||||||||||||||||||||||||||||||||||||||||||||||||||||||||||||||||||||||||||||||||||||||||||||||||||||||||||||||||||||||||||||||||||||||||||||||||||||||||||||||||||||||||||||||||||||||||||||||||||||||||||||||||||||||||||||||||||||||||||||||||||||||||||||||||||||||||||||||||||||||||||||||||||||||||||||||||||||||||||||||||||||||||||||||||||||||||||||||||||||||||||||||||||||||||||||||||||||||||||||||||||||||||||||||||||||||||||||||||||||||||||||||||||||||||||||||||

Share this page:


Install the RBI mobile application and get quick access to the latest news!
Scan the QR code to install our app


Page Last Updated on:


