RbiSearchHeader

Press escape key to go back

Past Searches

Theme
Theme
Text Size
Text Size
S2

RbiAnnouncementWeb

RBI Announcements
RBI Announcements

Asset Publisher

83669777

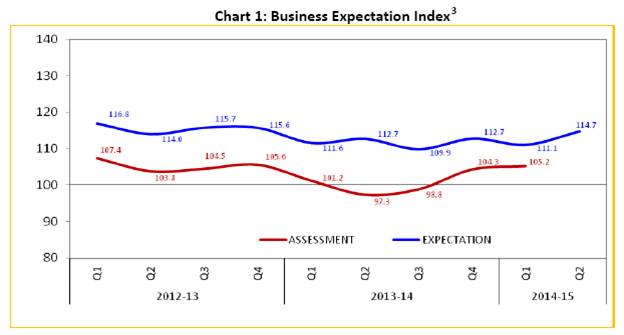
Industrial Outlook Survey- Q1: 2014-15 (Round 66)

The Industrial Outlook Survey conducted during May-June 2014, provides qualitative assessment of business situation of companies in the Indian manufacturing sector for Q1:2014-15 and their expectations for the ensuing quarter Q2:2014-15. The survey elicited response from 1,293 manufacturing companies.

Highlights:

Summary Table: Net response2 (NR in %) comparison over previous quarter

Assessment period

Expectation period

Parameters

Q1:2014-15

Q4:2013-14

Parameters

Q2:2014-15

Q1:2014-15

Improved positivity:


Increased Optimism:


i. Order books

16.4

14.8

i. Order books

29.1

24.6

ii. Availability of finance

12.4

10.8

ii. Production

33.7

27.1

Reduced concern:


iii. Capacity utilisation

19.4

11.2

i. Cost of finance

-22.2

-27.9

iv. Imports

15.0

10.5

ii. Cost of raw material

-49.5

-54.1

v. Employment

8.9

7.2

iii. Profit margins

-15.1

-16.5

vi. Availability of finance

20.6

16.0


vii. Selling price

12.5

15.1


viii. BEI

114.7

111.1


Reduced pessimism:


i. Cost of finance

-17.2

-22.2


ii. Cost of raw material

-42.1

-46.9


iii. Profit margin

-2.3

-5.4

Decline in positivity:


Pessimism:


i. Production

17.2

20.0

-


ii. Capacity utilisation

6.0

9.9


iii. Exports

10.5

16.4


No Change:


No Change:


i. Imports

9.3

9.3

- Exports

21.4

21.6

ii. Employment

5.4

5.4


iii. Selling price

9.8

9.6


iv. BEI

105.2

104.3


C1

Expectation quarter (Q2:2014-15)

  • Business outlook of the Indian manufacturing sector as inferred from movements in Business Expectation Index (BEI), shows improvement for Q2:2014-15 (114.7) as compared to previous quarter (111.1) and the corresponding quarter of previous year (112.7).

  • The improvement in BEI for the expectation quarter is mainly due to improved optimism on overall business situation, production, order books, capacity utilisation, imports, exports added with the reduced pessimism on cost of finance, cost of raw material and the profit margin.

  • For Q2:2014-15, the proportion of respondents who expected increase in production and at the same time decline in employment (indicating jobless growth) turns out to be around two per cent. This has been consistent throughout past ten rounds of the survey.

Assessment quarter (Q1:2014-15)

  • The business sentiments in Q1:2014-15 remained broadly unchanged from that of the previous quarter.

Table 1: Assessment and Expectation for Production

(Percentage responses) @

Quarter

Total response

Assessment

Expectation

Increase

Decrease

No change

Net response#

Increase

Decrease

No change

Net response

Q1:2013-14

1321

32.0

22.2

45.7

9.8

38.3

13.8

47.9

24.4

Q2:2013-14

1207

31.8

21.0

47.2

10.8

40.6

12.1

47.3

28.5

Q3:2013-14

1223

31.7

20.22

48.1

11.5

40.8

12.0

47.2

28.9

Q4:2013-14

1114

36.6

16.6

46.7

20.0

42.3

10.2

47.5

32.1

Q1:2014-15

1293

34.4

17.2

48.4

17.2

39.2

12.2

48.6

27.1

Q2:2014-15


43.4

9.7

46.8

33.7

‘Increase’ in production is optimistic.
@: Due to rounding off percentage may not add up to 100. This is applicable for all the tables from 1 to 17.
#: Net Response (NR) is the difference of percentage of the respondents reporting optimism and that reporting pessimism. The range is - 100 to 100. Any value greater than zero indicates expansion and any value less than zero indicates contraction.


Table 2: Assessment and Expectation for Order Books

(Percentage responses)

Quarter

Total response

Assessment

Expectation

Increase

Decrease

No change

Net response

Increase

Decrease

No change

Net response

Q1:2013-14

1321

30.5

20.9

48.6

9.7

35.5

13.2

51.2

25.3

Q2:2013-14

1207

27.9

22.3

49.8

5.5

36.8

11.5

51.8

25.3

Q3:2013-14

1223

28.2

21.2

50.6

7.0

34.7

13.7

51.5

21.0

Q4:2013-14

1114

32.1

17.3

50.6

14.8

38.1

10.5

51.4

27.6

Q1:2014-15

1293

31.8

15.4

52.9

16.4

36.2

11.5

52.3

24.6

Q2:2014-15


38.2

9.1

52.6

29.1

‘Increase’ in order books is optimistic.

Table 3: Assessment and Expectation for Pending Orders

(Percentage responses)

Quarter

Total response

Assessment

Expectation

Below Normal

Above Normal

Normal

Net response

Below Normal

Above Normal

Normal

Net
response

Q1:2013-14

1321

19.9

3.6

76.5

16.3

16.9

5.3

77.7

11.6

Q2:2013-14

1207

21.3

3.9

74.8

17.3

15.9

4.4

79.6

11.5

Q3:2013-14

1223

19.2

5.1

75.7

14.1

17.5

3.8

78.8

13.7

Q4:2013-14

1114

16.1

5.4

78.5

10.7

14.2

6.0

79.8

8.1

Q1:2014-15

1293

15.6

5.1

79.3

10.5

14.0

5.8

80.1

8.2

Q2:2014-15


12.3

5.7

82.0

6.5

Pending orders ‘Below Normal’ is optimistic.

Table 4: Assessment and Expectation for Capacity Utilisation

(Percentage responses)

Parameter

Options

Assessment

Expectation

Q1:2013-14

Q2:2013-14

Q3:2013-14

Q4:2013-14

Q1:2014-15

Q1:2013-14

Q3:2013-14

Q4:2013-14

Q1:2014-15

Q2:2014-15

Capacity Utilisation (CU)-(main product)

Increase

22.6

20.7

20.7

24.9

22.3

27.5

26.8

27.2

23.8

29.5

No Change

57.1

58.6

59.9

60.1

61.3

60.9

60.6

61.9

63.6

60.4

Decrease

20.3

20.7

19.4

15.0

16.3

11.6

12.6

10.9

12.6

10.1

Net Response

2.3

0.0

1.3

9.9

6.0

15.9

14.2

16.3

11.2

19.4

Level of CU (compared to the average in last 4 quarters)

Above normal

8.7

8.9

8.5

10.1

10.3

9.8

9.8

11.1

9.7

10.6

Normal

71.0

70.7

69.7

72.2

71.8

76.2

75.0

73.4

75.4

76.6

Below Normal

20.3

20.4

21.8

17.6

17.9

13.9

15.2

15.5

14.9

12.7

Net Response

-11.6

-11.5

-13.3

-7.5

-7.6

-4.1

-5.3

-4.4

-5.2

-2.1

Assessment of Prod. Capacity (with regard to expected demand in next 6 months)

More than adequate

14.6

15.0

14.7

13.9

13.8

13.7

14.8

15.7

13.4

12.9

Adequate

76.4

77.0

76.6

77.9

78.1

78.4

78.0

77.6

79.5

80.3

Less than adequate

9.0

8.1

8.7

8.2

8.1

7.9

7.1

6.8

7.1

6.8

Net Response

5.7

6.9

5.9

5.7

5.7

5.8

7.7

8.9

6.3

6.1

Increase’ in capacity utilisation is optimistic.

Table 5: Assessment and Expectation for Exports

(Percentage responses)

Quarter

Total response

Assessment

Expectation

Increase

Decrease

No change

Net response

Increase

Decrease

No change

Net response

Q1:2013-14

1321

23.8

15.2

61.0

8.6

27.1

10.4

62.5

16.7

Q2:2013-14

1207

24.9

17.1

58.0

7.8

28.6

10.0

61.5

18.6

Q3:2013-14

1223

24.2

13.4

62.4

10.9

27.4

10.9

61.7

16.5

Q4:2013-14

1114

29.3

12.9

57.9

16.4

28.3

8.9

62.8

19.5

Q1:2014-15

1293

24.6

14.1

61.2

10.5

31.7

10.0

58.3

21.6

Q2:2014-15


29.9

8.5

61.5

21.4

‘Increase’ in exports is optimistic.

Table 6: Assessment and Expectation for Imports

(Percentage responses)

Quarter

Total response

Assessment

Expectation

Increase

Decrease

No change

Net response

Increase

Decrease

No change

Net response

Q1:2013-14

1321

18.7

10.7

70.6

8.0

20.4

8.5

71.1

11.2

Q2:2013-14

1207

18.3

14.7

67.0

3.6

19.9

8.7

71.4

11.2

Q3:2013-14

1223

19.1

12.0

68.9

7.0

19.0

11.3

69.7

7.7

Q4:2013-14

1114

19.3

10.0

70.7

9.3

20.8

7.3

71.9

13.4

Q1:2014-15

1293

18.8

9.4

71.8

9.3

18.3

7.8

73.9

10.5

Q2:2014-15


21.2

6.2

72.6

15.0

‘Increase’ in imports is optimistic.

Table 7: Assessment and Expectations for level of Inventory (Raw Material and Finished Goods)

(Percentage responses)

Parameter

Options

Assessment

Expectation

Q1:2013-14

Q2:2013-14

Q3:2013-14

Q4:2013-14

Q1:2014-15

Q1:2013-14

Q3:2013-14

Q4:2013-14

Q1:2014-15

Q2:2014-15

Inventory of raw material

Below average

8.0

8.7

8.3

7.7

7.2

6.3

6.3

5.3

6.7

6.4

Average

78.7

78.7

78.9

79.2

80.2

84.2

83.6

83.7

83.6

83.7

Above average

13.3

12.6

12.8

13.2

12.6

9.5

10.1

11.0

9.7

9.9

Net Response

-5.3

-3.8

-4.6

-5.5

-5.4

-3.3

-3.9

-5.8

-3.1

-3.5

Inventory of finished goods

Below average

8.1

7.5

7.3

7.7

6.7

7.0

6.2

6.6

7.6

6.4

Average

77.3

77.0

75.3

76.9

79.1

82.7

82.5

80.8

81.8

82.9

Above average

14.7

15.5

17.4

15.4

14.1

10.3

11.3

12.6

10.6

10.8

Net Response

-6.6

-8.1

-10.2

-7.6

-7.4

-3.3

-5.0

-6.0

-3.0

-4.4

Inventory of raw material and finished goods ‘Below average’ is optimistic.

Table 8: Assessment and Expectations for Employment Outlook

(Percentage responses)

Quarter

Total response

Assessment

Expectation

Increase

Decrease

No change

Net response

Increase

Decrease

No change

Net response

Q1:2013-14

1321

14.4

11.2

74.4

3.2

16.0

8.0

76.1

8.0

Q2:2013-14

1207

11.3

11.5

77.3

-0.2

16.0

8.4

75.6

7.7

Q3:2013-14

1223

13.1

12.7

74.2

0.4

13.3

8.8

77.9

4.5

Q4:2013-14

1114

16.1

10.7

73.2

5.4

14.3

7.4

78.3

7.0

Q1:2014-15

1293

15.0

9.6

75.4

5.4

15.7

8.4

75.9

7.2

Q2:2014-15


15.2

6.2

78.6

8.9

‘Increase’ in employment is optimistic.

Table 9: Assessment and Expectation for Overall Financial Situation

(Percentage responses)

Quarter

Total response

Assessment

Expectation

Better

Worsen

No change

Net response

Better

Worsen

No change

Net response

Q1:2013-14

1321

23.3

13.8

63.0

9.5

31.5

9.6

58.9

21.9

Q2:2013-14

1207

21.4

19.5

59.1

1.8

33.2

9.1

57.7

24.1

Q3:2013-14

1223

23.7

17.3

58.9

6.4

29.7

12.4

57.9

17.3

Q4:2013-14

1114

25.0

13.1

61.9

11.9

33.0

9.5

57.5

23.5

Q1:2014-15

1293

26.2

12.3

61.5

14.0

30.7

8.4

60.8

22.3

Q2:2014-15


33.6

6.8

59.6

26.8

‘Better’ overall financial situation is optimistic.

Table 10: Assessment and Expectation for Working Capital Finance Requirement

(Percentage responses)

Quarter

Total response

Assessment

Expectation

Increase

Decrease

No change

Net response

Increase

Decrease

No change

Net response

Q1:2013-14

1321

30.1

7.3

60.5

24.8

33.0

6.5

60.4

26.5

Q2:2013-14

1207

32.9

8.1

59.0

24.8

31.0

6.5

62.5

24.5

Q3:2013-14

1223

33.5

7.2

59.3

26.3

32.7

5.3

61.9

27.4

Q4:2013-14

1114

34.9

6.2

58.8

28.7

35.3

4.7

60.0

30.6

Q1:2014-15

1293

31.6

6.6

61.7

25.0

33.1

5.0

61.9

28.1

Q2:2014-15


33.5

5.0

61.5

28.5

‘Increase’ in working capital finance is optimistic.


Table 11: Assessment and Expectation for Availability of Finance

(Percentage responses)

Parameter

Options

Assessment

Expectation 

Q1:2013-14

Q2:2013-14

Q3:2013-14

Q4:2013-14

Q1:2014-15

Q1:2013-14

Q3:2013-14

Q4:2013-14

Q1:2014-15

Q2:2014-15

Availability of finance (from internal accruals)

Improve

21.2

18.3

20.3

21.9

23.1

24.6

23.2

25.0

23.4

26.7

No Change

65.6

66.4

66.9

67.1

66.3

67.9

67.6

68.5

69.2

67.3

Worsen

10.4

15.2

12.7

11.0

10.6

7.4

9.2

6.6

7.4

6.1

Net Response

12.1

3.1

7.6

10.8

12.4

17.2

14.0

18.4

16.0

20.6

Availability of Finance (from banks & other sources)

Improve

18.8

14.2

17.1

18.2

20.1

20.0

18.2

19.0

20.5

21.5

No Change

74.4

75.6

74.5

72.4

72.3

75.2

75.6

76.2

73.6

74.7

Worsen

6.7

10.3

8.4

9.3

7.6

4.8

6.2

4.8

5.9

3.8

Net Response

12.1

3.9

8.7

8.9

12.5

15.2

12.0

14.2

14.6

17.6

Availability of Finance (from overseas, if applicable)

Improve

10.1

7.6

10.4

10.9

9.9

11.6

8.9

11.9

11.8

12.2

No Change

84.7

84.6

83.1

83.4

84.8

83.7

85.0

84.2

83.6

84.8

Worsen

5.2

7.8

6.5

5.7

5.3

4.6

6.0

3.9

4.6

3.0

Net Response

5.0

-0.1

3.9

5.2

4.6

7.0

2.9

8.1

7.2

9.1

‘Improvement’ in availability of finance is optimistic.


Table 12: Assessment and Expectation for Cost of Finance

(Percentage responses)

Quarter

Total response

Assessment

Expectation

Decrease

Increase

No change

Net response

Decrease

Increase

No change

Net response

Q1:2013-14

1321

10.1

24.6

65.3

-14.5

9.7

24.0

66.3

-12.4

Q2:2013-14

1207

5.0

37.6

57.4

-32.7

9.1

21.5

69.5

-12.4

Q3:2013-14

1223

5.6

37.5

56.9

-32.0

4.9

33.2

61.9

-28.3

Q4:2013-14

1114

5.0

32.9

62.0

-27.9

4.4

31.1

64.6

-26.7

Q1:2014-15

1293

5.3

27.4

67.3

-22.2

5.4

27.7

66.9

-22.2

Q2:2014-15


6.0

23.2

70.8

-17.2

‘Decrease’ in cost of finance is optimistic.


Table 13: Assessment and Expectation for Cost of Raw Material

(Percentage responses)

Quarter

Total response

Assessment

Expectation

Decrease

Increase

No change

Net response

Decrease

Increase

No change

Net response

Q1:2013-14

1321

4.6

54.5

40.9

-49.9

3.6

49.2

47.1

-45.6

Q2:2013-14

1207

2.8

65.0

32.2

-62.2

3.5

46.9

49.6

-43.4

Q3:2013-14

1223

4.2

59.5

36.3

-55.3

3.2

54.6

42.2

-51.5

Q4:2013-14

1114

2.6

56.7

40.7

-54.1

2.8

49.1

48.0

-46.3

Q1:2014-15

1293

3.0

52.5

44.5

-49.5

2.9

49.7

47.4

-46.9

Q2:2014-15


3.7

45.8

50.6

-42.1

‘Decrease’ in cost of raw material is optimistic.


Table 14: Assessment and Expectation for Selling Price

(Percentage responses)

Quarter

Total response

Assessment

Expectation

Increase

Decrease

No change

Net response

Increase

Decrease

No change

Net response

Q1:2013-14

1321

21.4

14.1

64.5

7.3

23.1

8.1

68.8

14.9

Q2:2013-14

1207

25.1

13.8

61.1

11.3

21.2

9.1

69.7

12.1

Q3:2013-14

1223

22.3

14.5

63.2

7.8

23.4

9.5

67.0

13.9

Q4:2013-14

1114

22.0

12.4

65.6

9.6

23.3

8.2

68.5

15.1

Q1:2014-15

1293

22.0

12.2

65.8

9.8

23.4

8.4

68.2

15.1

Q2:2014-15


20.6

8.0

71.4

12.5

‘Increase’ in selling price is optimistic.

Table 15: Assessment and Expectation for Profit Margin

(Percentage responses)

Quarter

Total response

Assessment

Expectation

Increase

Decrease

No change

Net response

Increase

Decrease

No change

Net response

Q1:2013-14

1321

13.5

31.9

54.6

-18.4

17.7

22.7

59.6

-4.9

Q2:2013-14

1207

12.3

36.4

51.3

-24.1

18.6

22.3

59.1

-3.7

Q3:2013-14

1223

12.8

35.2

52.0

-22.4

16.5

25.7

57.8

-9.3

Q4:2013-14

1114

14.1

30.6

55.3

-16.5

18.2

22.2

59.7

-4.0

Q1:2014-15

1293

14.3

29.4

56.4

-15.1

16.8

22.2

61.0

-5.4

Q2:2014-15


18.0

20.3

61.7

-2.3

‘Increase’ in profit margin is optimistic.


Table 16: Assessment and Expectation for Overall Business Situation

(Percentage responses)

Quarter

Total response

Assessment

Expectation

Better

Worsen

No change

Net response

Better

Worsen

No change

Net response

Q1:2013-14

1321

29.3

16.5

54.2

12.8

39.3

9.7

51.1

29.6

Q2:2013-14

1207

28.2

20.8

51.0

7.4

39.2

9.2

51.6

30.0

Q3:2013-14

1223

28.7

19.0

52.3

9.6

37.4

11.7

50.8

25.7

Q4:2013-14

1114

30.9

13.5

55.7

17.4

40.6

9.1

50.3

31.5

Q1:2014-15

1293

31.7

12.6

55.7

19.1

36.5

9.1

54.4

27.4

Q2:2014-15


43.9

7.0

49.1

37.0

‘Better’ Overall Business Situation is optimistic.


Table 17: Assessment and Expectation for Salary/Other Remuneration

(Percentage responses)

Quarter

Total response

Assessment

Expectation

Increase

Decrease

No change

Net response

Increase

Decrease

No change

Net response

Q2:2013-14

1207

30.3

3.4

66.3

26.8


Q3:2013-14

1223

29.7

3.6

66.8

26.1

22.5

2.7

74.8

19.8

Q4:2013-14

1114

28.7

3.5

67.9

25.2

25.3

3.2

71.5

22.1

Q1:2014-15

1293

38.5

3.1

58.4

35.4

31.8

2.8

65.4

28.9

Q2:2014-15


30.2

2.1

67.7

28.1

‘Increase in Salary/other remuneration’ is optimistic.


Table 18: Business Expectation Index (BEI)

Quarter

BEI-Assessment Quarter

BEI-Expectation Quarter

Q1:2013-14

101.2

111.6

Q2:2013-14

97.3

112.7

Q3:2013-14

98.8

109.9

Q4:2013-14

104.3

112.7

Q1:2014-15

105.2

111.1

Q2:2014-15


114.7


1The 65rd round (Q4:2013-14) survey results were released on April 1, 2014 with the publication “Macroeconomic and Monetary Developments 2014-15 (An Update)” on the RBI Website. The survey results are those of the respondents and are not necessarily shared by the Reserve Bank of India.

2Net Response (NR) is the difference of percentage of the respondents reporting optimism and that reporting pessimism. The range is -100 to 100. Any value greater than zero indicates expansion/optimism and any value less than zero indicates contraction/pessimism i.e. NR = (I – D); Where, I is the percentage response of ‘Increase/optimism’, and D is the percentage response of ‘Decrease/pessimism’ and E is the percentage response as ‘no change/Equal’; I+D+E=100.

3The Business Expectation Index (BEI), is a composite indicator calculated as weighted net response of nine business parameters, and gives a single snap shot of business outlook in every quarter. The range of BEI lies between 0 to 200, and 100 is the threshold line separating expansion from contraction.

RbiTtsCommonUtility

PLAYING
LISTEN

Related Assets

RBI-Install-RBI-Content-Global

RbiSocialMediaUtility

Install the RBI mobile application and get quick access to the latest news!

Scan Your QR code to Install our app

RbiWasItHelpfulUtility

Was this page helpful?