Inflation Expectations Survey of Households : March 2011(Round 23)* - RBI - Reserve Bank of India
Inflation Expectations Survey of Households : March 2011(Round 23)*
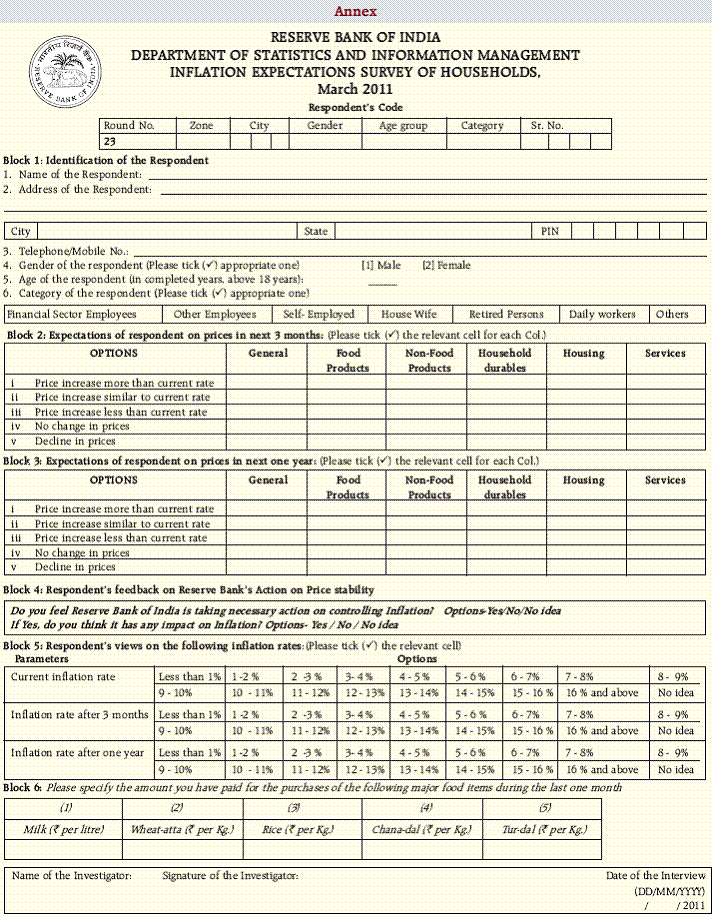
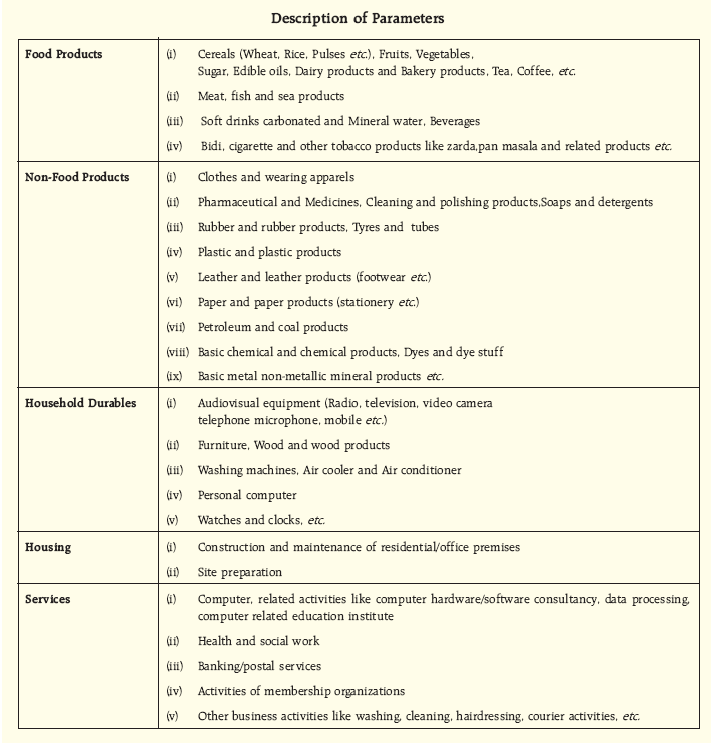
This article presents the findings of Inflation Expectations Survey of Households conducted in the January–March 2011 quarter, the 23rd round in the series. The survey captures the inflation expectations of 4,000 urban households across 12 cities for the next threemonth (April-June 2011) and for the next one-year (April 2011-March 2012). The inflation rates from this survey represent the inflation expectations of 4,000 urban households based on their individual consumption baskets and, hence, these rates are not to be considered as predictors of any official measure of inflation. The households’ inflation expectations provide useful directional information on near-term inflationary pressures and also supplement other economic indicators to get a better indication of future inflation. The survey results are those of the respondents and not necessarily shared by the Reserve Bank of India. The current round of the survey shows that inflation expectations of households for the next three-month and for next one-year ahead are lower at 11.9 per cent and 12.7 per cent respectively, from 12.4 per cent and 13.1 per cent assessed during the earlier round of survey. The survey findings, however, indicate that households expect inflation to rise further by 40 and 120 basis points during next three-month and next one-year, respectively, from the perceived current rate of 11.5 per cent. Households’ expectations of general price rise were mainly influenced by movements in food prices. The percentage of respondents expecting price rise has gone down for all product groups (viz., general prices, food products, non-food, household durables, housing and services). On category-wise inflation expectations, daily-wage workers and housewives expected higher inflation rates compared to other categories. Across the cities, Bangalore registered the highest inflation expectations and Patna registered the lowest expectations. I. Introduction Reserve Bank of India has been conducting Inflation Expectations Survey of Households (IESH) on a quarterly basis, since September 2005. The survey elicits qualitative responses on expected price changes (general prices as well as prices of specific product groups) in the next three-month as well as in the next one-year and quantitative responses on current, three-month ahead and one-year ahead inflations. While inflation affects purchasing power, inflation expectations affect people’s behavior in ways that have a long-term economic impact. Inflation expectations of households are subjective assessments and are based on their individual consumption baskets and, therefore, may be different from the official inflation numbers released periodically by the government. II. Data Coverage & Methodology The single-page survey schedule (Annex) designed for the IESH has been organised into six blocks. The first block seeks respondents’ particulars including name, contact details, gender, age and occupation (category). The second and third blocks seek productwise price expectations for three-month ahead and one-year ahead, respectively. The fourth block assesses the respondents’ feedback on RBI’s action to control inflation. The fifth block collects the rate of inflation of the respondent for three time points – current, threemonth ahead and one-year ahead. The last block which has been added since the last survey round (October- December 2010) captures the information on the amount paid by the respondents for the purchase of major food items, viz., Milk (per litre), Wheat-atta (per kg), Rice (per kg), Chana dal (per kg) and Tur dal (per kg) during last one month. II.1 Data Coverage The Reserve Bank conducts this survey in 12 cities on a quarterly basis. The major metropolitan cities, viz., Delhi, Kolkata, Mumbai and Chennai are represented by 500 households each, while another eight cities, viz., Jaipur, Lucknow, Bhopal, Ahmedabad, Patna, Guwahati, Bangalore and Hyderabad are represented by 250 households each. The respondents are well spread across the cities to provide a good geographical coverage. The male and female respondents in the group are usually in the ratio of 3:2. The category-wise representation of the respondents is presented in Table 1. The sample coverage is nearly as per the target in all rounds. II. 2 Information collected The price expectations are sought for general prices and for five product groups (food products, nonfood products, household durables, housing and services). The general price comprises prices of all the product groups taken together. The options for responses are (i) price increase more than current rate, (ii) price increase similar to current rate, (iii) price increase lower than current rate, (iv) no change in prices and (v) decline in prices. The first three of the five options pertain to the respondents’ expectations on the rate of future price increase compared to the current rate. These expectations are sought from the respondents for three-month ahead as well as one-year ahead period. The inflation expectations of the respondents that represent the year-on-year changes in prices are collected through Block 5. The inflation rates are collected in intervals – the lowest being ‘less than 1 per cent’ and the highest being ’16 per cent and above’ with 100 basis point size for all intermediate classes. The information on the respondents’ awareness on RBI’s action to control inflation as well as the impact of RBI’s action on inflation is also obtained in Block 4 from the 21st survey round (September 2010). In the last round (December 2010), a new question was added in Block 6 to capture the information on the amount paid by the respondents for the purchase of major food items, viz., Milk (per litre), Wheat-atta (per kg), Rice (per kg), Chana dal (per kg) and Tur dal (per kg) during the last one month. III. Survey Results III.1 General Price Expectations The survey results depict that the percentage of respondents expecting increase in general prices for both three-month ahead and one-year ahead has came down in the latest round. The proportion of respondents in each of these response categories in the last 10 rounds is presented in Table 2. The percentage of respondents expecting price increase over three-month ahead period declined to 96.0 per cent from 98.6 per cent in the previous round (October- December 2010). Similarly, the percentage of respondents expecting general price increase over one-year ahead period also declined to 96.1 per cent from 98.9 per cent in the previous round. The proportion of respondents who expect this price increase to be ‘higher than current rate’ has also fallen.
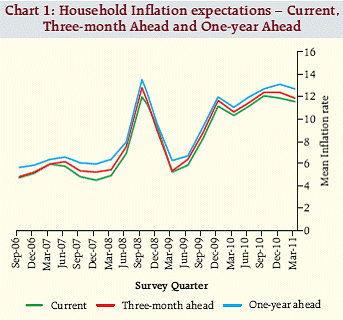
III. 2 Product Group-wise Price Expectations The product group-wise price expectations are given in Statement I. For three-month ahead and one-year ahead price expectations, the percentages of respondents expecting price rise have gone down for all product groups, viz., food products, non-food products, household durables, housing and services. In case of food products, the percentage of households expecting the price increase more than the current rate has gone down substantially whereas the proportion of those expecting price increase similar to the current rate has decreased marginally as compared to the previous survey round. III. 3 Coherence between General Prices and Product groups’ Prices General price expectations are influenced by the price expectations in respect of various product groups. However, price expectations of certain product groups can influence the General Price expectations more than other products. Therefore, a measure of coherence between General Prices and prices of various product groups was derived based on the total percentages of respondents who expect similar movements in General Price and those of various product groups. This degree of coherence between General Prices and prices of various product groups for three-month ahead and one-year ahead is depicted in Table 3 and Table 4. The General Price expectations are more in tune with Food Price expectations, as compared to other product groups. This association was lowest for Household Durables. This indicates that respondents assign relatively higher priority to food prices when they think about the price movements in general. In the current round of the survey, it is observed that about 85.5 per cent and 89.8 per cent of the respondents are seen to have been influenced by food prices for arriving at three-month ahead and one-year ahead General Price expectations, respectively. There has been an increase in the share of respondents perceiving Household durables as an influencing factor for their General Price expectations. III. 4. Inflation expectations The perception of current inflation rate and expectations of three-month ahead and one-year ahead inflation since Round 5 (September 2006) are shown in Table 5 and Chart 1. It represents the average inflation rate of 4000 respondents. The current round of the survey shows that inflation expectations of households for the next three-month and for next one-year ahead are lower at 11.9 per cent and 12.7 per cent, respectively, from 12.4 per cent and 13.1 per cent assessed during the earlier round of survey. The perception of current inflation, the three-month ahead and one-year ahead inflation expectations in the current survey round have decreased by 30, 50 and 40 basis points, respectively, as compared to the corresponding perceptions in the previous round. The movement of inflation expectations shows that the future inflation expectations are usually higher than the perception of current inflation. These inflation expectations provide useful inputs on directional movements of future inflation. However, these are not to be treated as forecast of any official measure of inflation. It may be seen from Chart 1 that the short term (three-month ahead) expectations of inflation lie between current inflation and long-term (one-year ahead) inflation expectations.
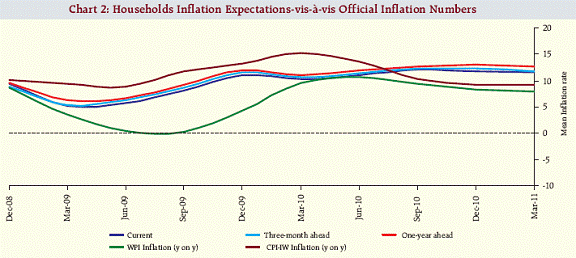
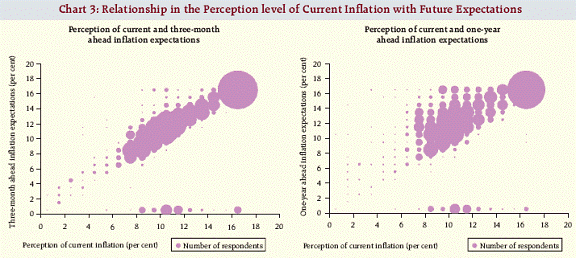
Chart 2 depicts the household inflation expectations along with the official inflation measures based on Wholesale Price Index (WPI) – All commodities and Consumer Price Index for Industrial Workers (CPI-IW). It shows that for a large part of the survey history, the households’ inflation expectations remained between the WPI and CPI-IW inflations. On the contrary, in the current survey round, household inflation expectations are higher than the official inflation rates. It is observed that expectations that have declined marginally are moving in line with more or less stable official indicators. III. 5 Volatility in Responses The volatility in responses is measured through standard deviation. Over different rounds, the standard deviation has been lower for current inflation rate as compared to three-month ahead and one-year ahead (Table 6). The total variability in responses for inflation expectations was elucidated by different classificatory factors (viz., Gender, Age-group, City and Category) of respondents over different rounds. An Analysis of Variance (ANOVA) carried out over different rounds revealed that ‘City’ has been a significant source of variation in all rounds (Table 7). This may be due to variation in consumption baskets across the cities. III.6 Gender-wise Expectations In the current round of survey, female respondents expected higher inflation rates as compared to their male counterparts (Table 8). However, there is no significant difference between male and female respondents in terms of the consistency in responses over various survey rounds and for current, three-month ahead and one-year ahead periods. III.7 Category-wise Expectations The category of respondents indicates their occupation status. For the latest survey round, daily workers and housewives reported higher inflation expectations whereas financial sector employees expected the lowest inflation (Table 9). III.8 Age Group-wise Expectations The survey covers only adult respondents of 18 years or more. During the current survey round, the respondents in the age group ‘Upto 25 years’ and ’35 to 40 years’ have reported the highest inflation rates for current and three-month ahead periods (Table 10). The one-year ahead inflation expectations were higher for the age-groups ‘35 to 40 years’ and ‘60 years and above’. However, over the survey rounds, no agespecific consistency is observed in inflation expectations. III.9 City-wise Expectations Significant variations were observed in the inflation expectations across different cities, which may be attributed to the divergence in consumption pattern between cities. In the latest round of the survey, current inflation was found to be the highest in Bangalore and the lowest in Patna, three-month ahead inflation expectations were found to be the highest in Jaipur and the lowest in Patna whereas oneyear ahead inflation expectations were found to be the highest in Jaipur and Bangalore and the lowest in Guwahati (Table 11). The variability in responses was the highest in Delhi and the lowest in Patna and Bhopal for the current inflation. III.10 Cross-tabulation of Current Inflation and Future Expectations The distribution of inflation expectations expresses the degree of respondents’ optimism on future price movement vis-à-vis current price changes. The cross-tabulation depicting the relationship between the current and future inflation expectations for three-month and one-year ahead are presented in Table 12 & Table 13 and the same is depicted in Chart 3. It may be observed that 66.3 per cent respondents perceived double-digit current inflation. Similarly, 76.4 per cent and 82.7 per cent of the respondents expected the three-month ahead inflation and one-year ahead inflation in double-digit figures. A cross-tabulation of the current inflation perception with the future inflation expectations points out that among the 66.3 per cent respondents who perceived the current inflation in double-digit, 93.7 and 92.3 per cent respondents expected that it would remain in the same band for three-month ahead and one-year ahead, respectively.
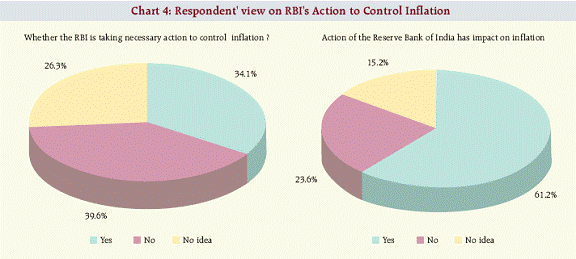
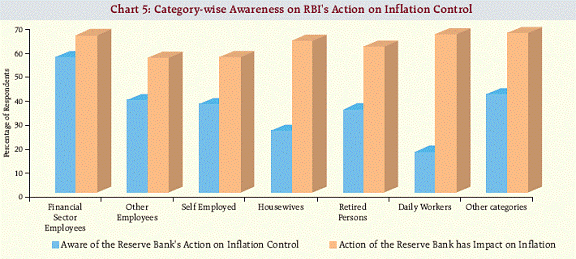
III.11 Awareness on Reserve Bank of India’s Action to Control Inflation An additional block (Block 4) was added to the survey schedule from the 21st round (September 2010) to determine the awareness of public on Reserve Bank’s action on inflation control. Out of the two questions in this block, the first one elicits the respondent’s awareness whether the Reserve Bank is taking necessary action on controlling inflation whereas the second one determines whether the respondent thinks that RBI’s action has got any impact on inflation. The responses for the latest survey round are presented in Chart 4. It can be seen that 34 per cent of the respondents felt that RBI is taking necessary action to control inflation. Out of these 34 per cent respondents, 61 per cent are aware that RBI’s action has got an impact on inflation. The category-wise distribution of the responses based on ‘Block 4’ points out that the awareness on RBI’s action on inflation control was the most among ‘Financial Sector Employees’ and it was least in case of ‘Daily Workers’ and ‘Housewives’. However, impact on RBI’s action on inflation control was the least among employees other than ‘Financial Sector Employees’ (Chart 5).
The category-wise distribution of the responses of ‘the impact of RBI’s action on inflation control’ for the 34 per cent respondents who felt that the Reserve Bank is taking necessary action to control inflation is also depicted in Table 14. IV. A Bootstrap Confidence Interval for Inflation Expectations In the previous sections, the average rates of inflation expectations are presented. Using the Bootstrap re-sampling method, interval estimates of the average inflation expectations of households are presented, so as to give an idea of the error associated with the estimates of households’ inflation expectations. The Bootstrap is a re-sampling method for statistical inference, wherein the sampling distribution of a statistic can be obtained without specific knowledge of the exact distribution of the population variable under study. It is commonly used to estimate confidence intervals through Bootstrapping, a confidence interval of not only population mean but also the population median and other parameters can be obtained. Drawing 10,000 re-samples using simple random sampling with replacement from the sample of the survey, 99 per cent Bootstrap Confidence Intervals (BCI) for mean were obtained. The results are presented in Table 15. It is observed that the exercise leads to a confidence interval with a small width indicating that the point estimates are quite precise for estimating the population means of households’ expectations of inflation.
* Prepared in the Division of Household Surveys, Department of Statistics and Information Management. The previous article on the subject was published in April 2011 RBI Bulletin. |
|||||||||||||||||||||||||||||||||||||||||||||||||||||||||||||||||||||||||||||||||||||||||||||||||||||||||||||||||||||||||||||||||||||||||||||||||||||||||||||||||||||||||||||||||||||||||||||||||||||||||||||||||||||||||||||||||||||||||||||||||||||||||||||||||||||||||||||||||||||||||||||||||||||||||||||||||||||||||||||||||||||||||||||||||||||||||||||||||||||||||||||||||||||||||||||||||||||||||||||||||||||||||||||||||||||||||||||||||||||||||||||||||||||||||||||||||||||||||||||||||||||||||||||||||||||||||||||||||||||||||||||||||||||||||||||||||||||||||||||||||||||||||||||||||||||||||||||||||||||||||||||||||||||||||||||||||||||||||||||||||||||||||||||||||||||||||||||||||||||||||||||||||||||||||||||||||||||||||||||||||||||||||||||||||||||||||||||||||||||||||||||||||||||||||||||||||||||||||||||||||||||||||||||||||||||||||||||||||||||||||||||||||||||||||||||||||||||||||||||||||||||||||||||||||||||||||||||||||||||||||||||||||||||||||


