 IST,
IST,
IV. Monetary and Liquidity Conditions
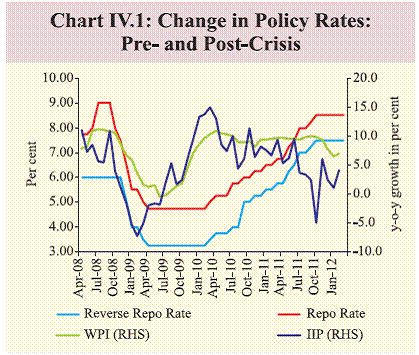
With inflation remaining high, even though declining, the Reserve Bank has maintained policy rates since December 2011. Against the backdrop of a large and persisting liquidity deficit, the Reserve Bank continued to inject durable primary liquidity into the system during Q4 of 2011-12 with a view to preserving stable credit conditions. During Q4 of 2011-12, broad money growth fell below the indicative trajectory of the Reserve Bank for end-March 2012, reflecting a deceleration in deposit growth on the components side and credit growth on the sources side. The secondary impact of durable liquidity injections by way of CRR cuts and OMO purchases is expected to considerably ease liquidity conditions in Q1 of 2012-13 while the evolving growth- inflation dynamics will continue to influence the monetary trajectory. The Reserve Bank shifts gears to a neutral policy stance IV.1 The Reserve Bank persisted with its monetary tightening between February 2010 and October 2011 with continuing inflation risks. In this cycle, policy rates were effectively raised by 525 bps starting in March 2010. The tightening was necessary even if it meant sacrificing some growth in the short term as the risks from high inflation to the economy’s sustainable growth rate were large. IV.2 As expected, domestic demand slowed, partly due to monetary policy actions. Following moderation in demand-side pressures, headline inflation started moderating in line with the anticipated trajectory, which led the Reserve Bank to shift gears to a neutral policy stance. The shift was motivated to a substantial extent by deceleration in investment activity as well as expected deceleration in consumption demand (Table IV.1 and Chart IV.1).
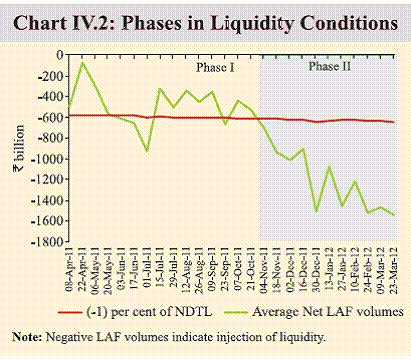
IV.3 The downside risks to growth, however, continued to rise reflecting weakening global economic outlook and domestic policy uncertainties. While room for easing policy rates exist from here, the timing and extent of cuts will need to factor in the inflation risks that persist in 2012-13. The Reserve Bank responds to structural liquidity deficit IV.4 Since November 2011, the liquidity deficit increased beyond the Reserve Bank’s broad indication of keeping it at about 1 per cent of NDTL (Chart IV.2). This deficit was largely structural caused in part by foreign exchange intervention that became necessary in the face of the sharp 19 per cent depreciation of the rupee between end-July and mid-December of 2011 and the increasing divergence between deposits mobilised and credit extended by commercial banks. During 2011-12, the Reserve Bank injected primary liquidity through Open Market Operation (OMO) purchases, aggregating around `1.3 trillion, and through CRR cuts infusing around `0.8 trillion. Thus, sizeable durable liquidity injection was provided even after offsetting the withdrawal of rupee liquidity consequent to foreign exchange operations. However, the net liquidity position remained tight because of frictional factors such as the sizeable build up of government cash balances during Q4 of 2011-12, especially advance tax collections around mid-March. These balances saw an intra-quarter swing of around `1.8 trillion during Q4 of 2011-12 as the government transited from WMA and occasional overdraft. Going forward, liquidity conditions are likely to return towards acceptable deficits as a result of anticipated government spending in the near term.
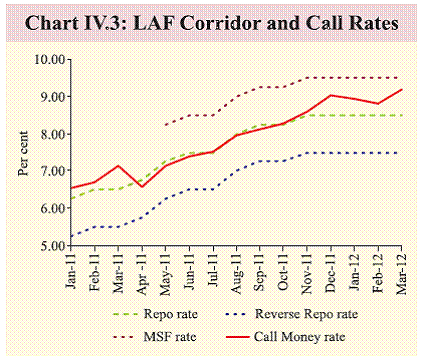
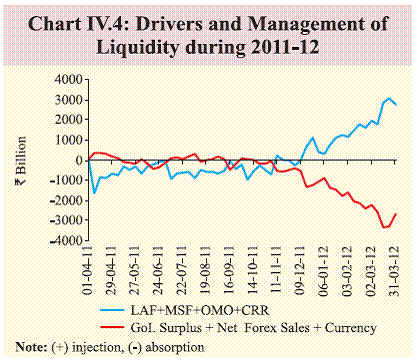
IV.5 The new monetary policy operating procedure helped in liquidity management as the overnight rates have not spiked as in the past episodes of large liquidity deficits. They remained range bound within the formal corridor defined by the LAF reverse repo rate and the MSF rate. Despite the significant tightening of liquidity conditions, on-tap availability of ‘emergency’ liquidity through the MSF window capped the Reserve Bank’s operating target, viz., weighted average overnight call money market rate, and facilitated its range-bound movement (Chart IV.3). Monetary transmission, therefore, remained effective. IV.6 The Reserve Bank’s liquidity management measures largely offset the sharp drain in liquidity from autonomous drivers (Chart IV.4). In addition to the liquidity management measures indicated above, measures to dissuade funding of speculative positions in the foreign exchange market also helped limit pressures on short-term domestic money market rates.
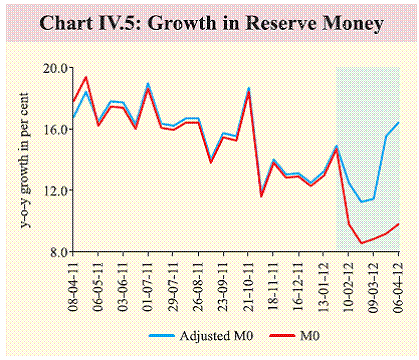
Structural liquidity deficit reflected in low reserve money expansion IV.7 A predominantly bank-based economy requires secular expansion in reserve money to fund economic growth. The sources of reserve money arise from the Reserve Bank’s forex and domestic liquidity management operations. Structurally, India is a current account deficit (CAD) economy. This underlines the dependence on capital inflows to finance CAD as also to build up forex reserves. During 2011-12, forex operations drained rupee liquidity and domestic monetary policy operations, therefore, not only had to fund the demand for reserves but also offset the domestic liquidity impact of the forex operations. As a result, reserve money growth decelerated during the year (Chart IV.5).
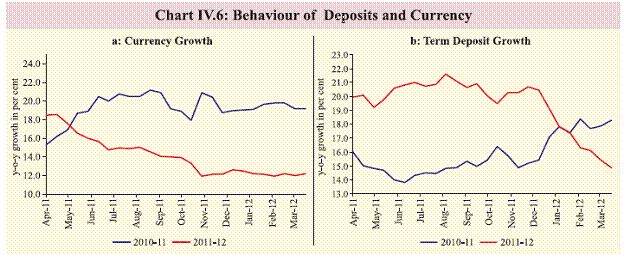
IV.8 The deceleration in reserve money during Q4 of 2011-12 also reflected the reduction in CRR by 125 basis points in two steps during January and March 2012. Since such reduction implies reduction in impounded liquidity and thus reflects easing of liquidity conditions, the change in reserve money needs to be adjusted for the reduction in CRR. Adjusted for CRR, reserve money recorded a year-on-year growth of 16.4 per cent as on April 6, 2012, which is marginally lower than 16.8 per cent a year ago. Going forward, the multiplier effect of primary liquidity injection is likely to further increase the growth in reserve money. Currency expansion moderates IV.9 During 2011-12, there was a reversal in currency demand that reflected deceleration in real economic activity and in inflation. In particular, items of household expenditure, such as food items, that are cash intensive, witnessed a sharp decline in inflation. Further, public expenditure on the government’s flagship social sector scheme, MGNREGS declined in 2011- 12. The higher opportunity cost of holding currency following hikes in interest rates on term deposits by banks also caused a shift in household savings from currency (Chart IV.6a). Deposit growth moderates in Q4 IV.10 Term deposits recorded robust growth during calendar year 2011 mainly reflecting substitution from the other components of monetary aggregates and small savings as the increase in deposit rates by banks incentivised the holdings of interest-bearing deposits. During Q4 of 2011-12, however, term deposit growth decelerated, mainly reflecting the dominance of the base effect and tight liquidity conditions (Chart IV.6b). Consequently, banks increased their recourse to non-deposit sources, such as borrowings by way of debt instruments and LAF during 2011-12 compared with the previous year.
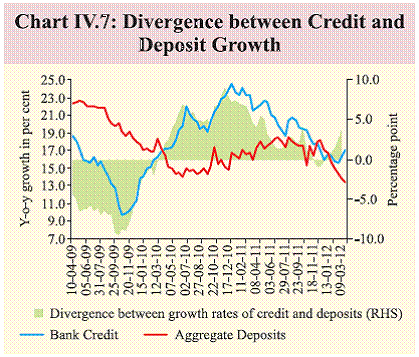
Money supply decelerates below the indicative trajectory IV.11 Broad money (M3) growth fell below the indicative trajectory of the Reserve Bank towards the last quarter of 2011-12 (Table IV.2). This could be partly due to the time lag involved in the liquidity generation process that operates through the money multiplier following CRR cuts. The deceleration in M3 demand could also be attributed to the slackening pace of economic activity during 2011-12 and deceleration in inflation from December 2011. IV.12 All components of M3 decelerated during 2011-12. On the sources side, the growth in M3 was led by increase in banking system credit to the government; of this, the net Reserve Bank credit to the government sector, reflected the OMO and LAF operations of the Reserve Bank. Both demand and supply factors cause credit growth to slow IV.13 Non-food credit growth had been showing a decelerating trend from December 2010, reflecting both demand- and supply-side factors. On the demand side, with the transmission of cumulative monetary actions having their desired impact on economic activity, particularly credit-intensive manufacturing, there was a deceleration. On the supply side, banks appeared to be averse to taking risks with some parameters that indicate the health of banks’ balance sheets deteriorating during the year. Banks opted for safer avenues of investment resulting in a compositional shift in the banks’ asset portfolio in favour of investments in government securities. IV.14 The divergence between credit and the deposit growth rates had narrowed during the first three quarters of 2011-12. The sharper deceleration in deposit growth during Q4 of 2011-12 and turnaround in credit growth during March 2012, however, caused the divergence to increase (Chart IV.7). As deposit growth moderated, commercial banks’ recourse to non- deposit sources of finance (viz., borrowings) increased.
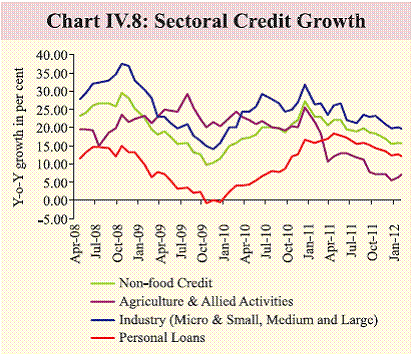
IV.15 Credit growth decelerated across bank groups during 2011-12. Since public sector banks account for around three-fourth of the outstanding credit, the deceleration in their credit growth impacted the overall credit expansion of SCBs taken together (Table IV.3). Increasing stress in the corporate sector was reflected in the quantum jump in the corporate debt that came up for restructuring before the Corporate Debt Restructuring Cell during 2011-12. Banks tend to become risk averse as corporate profitability impinges on the health of their balance sheets and the possibility of adverse selection increases in a rising interest rate environment. IV.16 The deceleration in year-on-year non- food credit growth as at end-February 2012 was contributed by all the sectors, viz., agriculture, industry, services and personal loans (Chart IV.8). The deceleration was particularly sharp in agriculture, real estate, hotels and restaurants, professional services, telecommunication, power, cement, textiles, iron and steel and personal vehicle loans. IV.17 Reflecting the deceleration in growth and the introduction of system-driven identification of NPAs by public sector banks (PSBs), the asset quality of PSBs deteriorated sharply during 2011-12 (up to December) (Table IV.4). Further, the capital to risk-weighted assets ratio (CRAR) of commercial banks, particularly, nationalised banks, declined during 2011-12 (up to December). These factors appear to have a bearing on their capacity to extend credit.
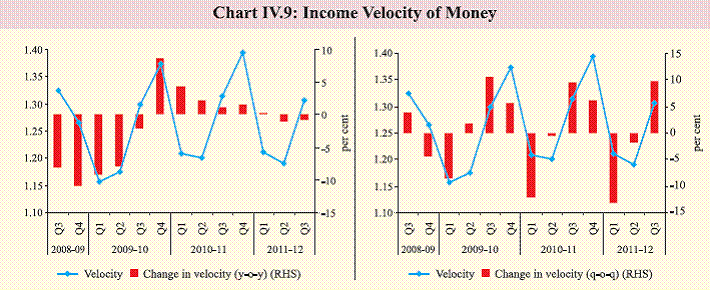
Non-bank sources dominated the flow of resources to the commercial sector IV.18 Non-bank sources emerged as the dominant source for financing the commercial sector during 2011-12. Within non-bank sources, external sources of funds accounted for 71 per cent of the increase, mainly contributed by FDI (Table IV.5). The increase in domestic non-bank funds was accounted for by NBFCs while issuance of commercial paper (CPs) by corporates and subscribed to by non-banks increased significantly. Liquidity deficit eases IV.19 The expansion of M3 in relation to nominal GDP i.e. declining income velocity of M3 is reflective of the increasing monetisation of the Indian economy (Chart IV.9). IV.20 Monetary and liquidity conditions remained tight during 2011-12. Liquidity turned excessively tight since November 2011 reflecting sudden large autonomous outflows. In response, as also in recognition of the downside risks to growth during the latter part of 2011-12, the Reserve Bank stepped up injecting durable discretionary liquidity through OMO purchases and CRR cuts. As a result, and also reflecting frictional factors, liquidity deficit has declined considerably in April 2012 so far. The pace of reserve money creation, adjusted for first round impact of CRR cuts, has also picked up. This has partly offset the structural drivers of liquidity.
|
|||||||||||||||||||||||||||||||||||||||||||||||||||||||||||||||||||||||||||||||||||||||||||||||||||||||||||||||||||||||||||||||||||||||||||||||||||||||||||||||||||||||||||||
Page Last Updated on:


