 IST,
IST,


Monetary Policy Report – October 2023
|
The outlook for domestic economic activity remains resilient in spite of large supply shocks that have pushed up the trajectory of headline inflation. Energy and food price volatility, geopolitical hostilities, tightening external financial conditions and climate shocks are the key risks to the outlook. Monetary policy remains focused on aligning inflation with the target to pave the path for sustained growth in the medium-term. I.1 Key Developments since the April 2023 MPR Global economic activity and trade are slowing, although unevenly across geographies and sectors. Tightening financial conditions in response to monetary actions to address still elevated inflation, persisting geopolitical tensions and growing geoeconomic fragmentation render the outlook fragile. Manufacturing activity is contracting across many countries, while services are relatively resilient. Headline inflation has been gradually easing across the world, however, in most countries, it remains elevated in relation to targets. Core inflation is moderating but at a tardy pace and services inflation is sticky. These concerns are reflected in 'higher for longer' monetary policy settings. In some countries, however, the monetary policy tightening cycle is complete or nearing it or even in accommodation in response to weakening economic activity. Market expectations relating to the global economic outlook are fluctuating widely and sensitive to every incoming information, imparting high volatility. In September, US sovereign bond yields touched their highest levels since the global financial crisis, and the yield curve has seen its longest period of inversion since 1980. Credit growth in major economies is decelerating in response to monetary tightening. After strong gains in the first half of 2023, global equity markets retreated in Q3 (July-September). The US dollar depreciated to a 15-month low in mid-July but has recovered subsequently on better-than-expected US economic data. Crude oil prices firmed up sharply to around US$ 95 per barrel in September in response to extended output cuts by key producing countries. Food prices are volatile on supply concerns arising from the breakdown of the Black Sea deal on Ukrainian grain movements and the El Niño weather phenomenon. Turning to the domestic economy, activity was supported in H1:2023-24 by private consumption and fixed investment, although adverse external conditions are being reflected in a prolonged contraction in net exports. Real gross domestic product (GDP) rose by 7.8 per cent (year-on-year, y-o-y) in Q1:2023-24 (April-June) and high frequency indicators for Q2 suggest that the momentum in activity is being maintained. On the supply side, real gross value added (GVA) is being buoyed by services sector growth. Headline CPI inflation had moderated from an average of 6.7 per cent in 2022-23 to 4.3 per cent in May 2023 in response to monetary policy actions and supply side measures. Reversing these gains under the impact of sporadic food supply shocks, inflation jumped to 7.4 per cent in July and 6.8 per cent in August. On the other hand, core inflation (i.e., CPI excluding food and fuel) has been gradually ebbing down to sub-5 per cent levels. With the cumulative rate hike of 250 basis points (bps) undertaken during May 2022-February 2023 working its way into the economy, the monetary policy committee (MPC) kept the policy repo rate unchanged at 6.50 per cent through H1, and it remains firmly committed to aligning inflation with the target going forward. Monetary Policy Committee: April 2023 - September 2023 When the MPC met in April 2023, the global economy was going through a period of heightened volatility in the wake of banking sector turmoil in some advanced economies (AEs). Domestic CPI headline inflation was ruling above the upper threshold of the tolerance band in January and February, but was expected to soften with a record rabi foodgrains production, easing input cost conditions and normalisation of supply chain pressures. CPI inflation was projected at 5.2 per cent for 2023-24, 10 bps lower than the February projection. Domestic economic activity was seen to be holding up well, and the real GDP growth projection for 2023-24 was raised to 6.5 per cent from 6.4 per cent in the February meeting. Considering these factors and that previous rate hikes were still working through the system, the MPC unanimously decided to keep the policy repo rate unchanged at 6.50 per cent, but with a readiness to act, should the situation so warrant. The MPC decided by a majority of 5-1 to remain focused on withdrawal of accommodation to ensure that inflation progressively aligns with the target, while supporting growth. At the time of the June 2023 meeting, CPI headline inflation had fallen to 4.7 per cent (April 2023 print) from an average of 6.2 per cent during the previous quarter. The MPC noted that the moderation in CPI headline inflation reflected the combined and continuing impact of monetary policy tightening, supply augmenting measures and the fuller impact of the previous rate hikes which should keep inflationary pressures contained in the coming months. Against this backdrop, the MPC unanimously voted again to keep the policy repo rate unchanged at 6.50 per cent and with a 5-1 vote to continue with its stance of withdrawal of accommodation. In the run up to the August 2023 meeting, headline CPI inflation picked up to 4.8 per cent in June, with sizeable upside pressures on the near-term headline inflation trajectory from a spike in vegetable prices. Factoring in the skewed south-west monsoon outturn, the growing likelihood of an El Niño event and the worsening global food prices outlook, the inflation projection for 2023-24 was revised upwards by 30 bps to 5.4 per cent while the April 2023 projection for real GDP was kept unchanged. Taking into account the cumulative policy repo rate increase undertaken thus far, the MPC unanimously decided to keep the policy repo rate unchanged at 6.50 per cent with preparedness to undertake policy responses. With a 5 to 1 vote, the MPC reiterated its stance of withdrawal of accommodation. The MPC’s voting pattern reflects the diversity in individual members’ assessments, expectations and policy preferences, a characteristic also reflected in voting patterns of other central banks ( Table I.1). Macroeconomic Outlook Chapters II and III analyse macroeconomic developments relating to inflation and economic activity during H1:2023-24 (April–September 2023). Turning to the baseline assumptions, first, international crude prices have exhibited sizeable two-way movements in H1, easing in April amidst a banking crisis in the US and underwhelming Chinese recovery, but they moved higher beginning July, with Brent crude crossing US dollar (US$) 90 per barrel in September due to production cuts referred to earlier, with some correction in early October. Geopolitical tensions impart significant uncertainty to the outlook (Chart I.1.a and Chart I.1.b). The ‘crack’ spread – the wedge between global petroleum product prices and crude prices – is elevated in view of demand-supply refinery mismatches (Chart I.1.c). Taking into account these developments, the baseline assumption for crude price (Indian basket) is retained at US$ 85 per barrel ( Table I.2). 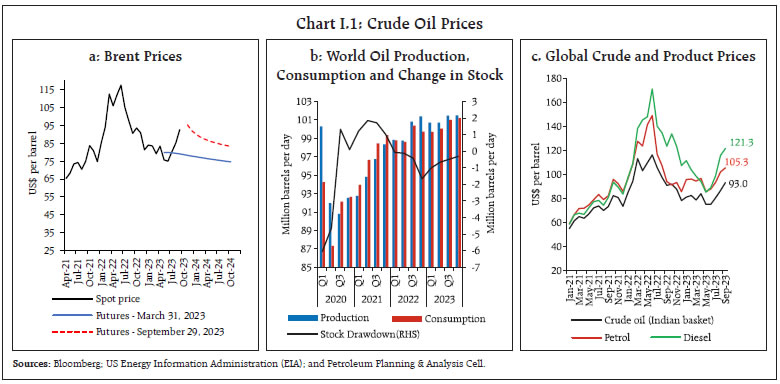 Second, the nominal exchange rate of the Indian rupee or INR has moved in both directions around the April baseline, varying in a range of INR 81.7-83.3 per US$ in H1. Taking into consideration the uncertainty around US dollar movements, the ebbs and flows of global capital, and international crude oil prices, the baseline assumption for the exchange rate is revised to INR 82.5 per US dollar. 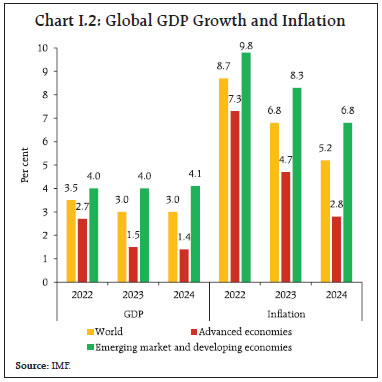 Third, multiple headwinds – tighter monetary and fiscal policies, reduced pent-up demand, financial stability risks, continued geopolitical challenges and geoeconomic fragmentation – weigh heavily on global growth prospects. The global purchasing managers’ index (PMI) for manufacturing has remained in contraction mode since September 2022, while the services PMI is moderating since May 2023, albeit still in expansion mode. In its July 2023 update of the World Economic Outlook (WEO), the International Monetary Fund (IMF) revised its global growth forecast for 2023 marginally upwards to 3.0 per cent from its April projection of 2.8 per cent ( Chart I.2). Yet, global GDP growth for 2023 and 2024 (3.0 per cent each) will trail its 2022 level (3.5 per cent) as well as its historical (2000-19) average of 3.8 per cent. Global trade growth (goods and services combined) is projected by the IMF to decelerate from 5.2 per cent in 2022 to 2.0 per cent in 2023. 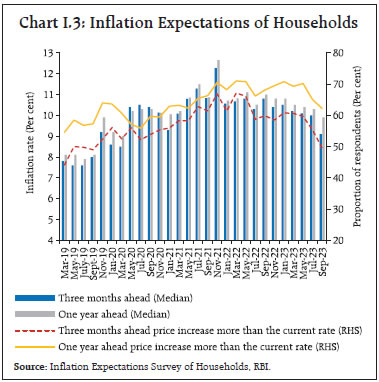 Looking ahead, the sharp spike in food prices, especially of vegetables, has started correcting (Chapter II). The three months and one year ahead median inflation expectations of urban households fell by 90 and 40 bps, respectively, to 9.1 per cent and 9.9 per cent in the September 2023 round of the Reserve Bank’s survey 1 vis-à-vis the previous round. Notably, inflation expectations fell to a single digit for the first time since the COVID-19 pandemic. The proportion of respondents expecting the general price level to increase by more than the current rate declined considerably for both the horizons vis-à-vis the previous round (Chart I.3). Manufacturing firms polled in the July-September 2023 round of the Reserve Bank’s industrial outlook survey expect increased pressures from the cost of raw materials but marginal decline in selling price growth in Q3:2023-24 (Chart I.4a). 2 Services and infrastructure firms expect lower growth in input cost and selling prices in Q3:2023-24 (Charts I.4b and I.4c). 3 In the PMI surveys for September 2023, manufacturing firms reported a decline in input cost inflation but an increase in output price inflation; services firms reported moderation in both input and output price pressures. 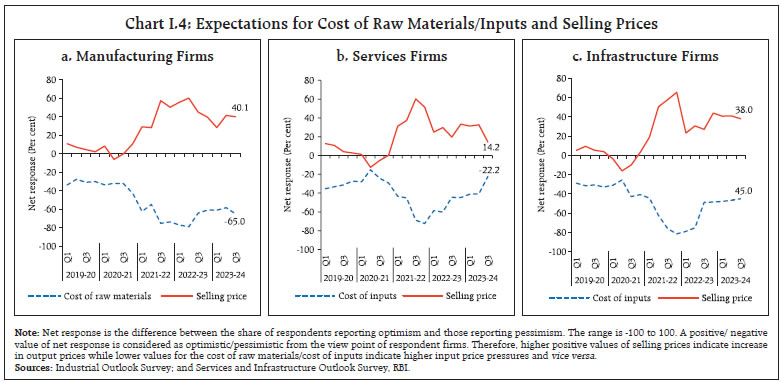 Professional forecasters surveyed by the Reserve Bank in September 2023 expect headline CPI inflation to moderate from 6.6 per cent in Q2:2023-24 to 5.5 per cent in Q3, 5.1 per cent in Q4 and 5.2-4.0 per cent in H1:2024-25 (Chart I.5a and Table I.3). 4 Core inflation (i.e., CPI excluding food and beverages, pan, tobacco and intoxicants, and fuel and light) expectation was seen at 4.9 per cent in Q2:2023-24, 4.7 per cent in Q3, 4.6 per cent in Q4 and 4.6-4.7 per cent in H1:2024-25. Long-run inflation expectations of professional forecasters measured by their 5-year ahead expectations softened to 4.9 per cent while 10-year ahead expectations remained unchanged at 4.5 per cent ( Chart I.5b). Looking ahead, the outlook for inflation will be conditioned heavily by food inflation dynamics. The south-west monsoon rainfall has been uneven, with August recording a 36 per cent deficiency in rainfall. Water reservoir levels have dipped and El Niño conditions are taking hold although the Indian Ocean Dipole (IOD) has turned positive which could limit El Niño effects. Kharif sowing has exceeded last year’s levels but with shortfalls in area under pulses and oilseeds. Global supply chains are improving from their pandemic disruptions. Geopolitical hostilities pose upside risks to global commodity prices across the board – food, crude oil and metals. Taking into account the initial conditions, signals from forward-looking surveys and estimates from time-series and structural models 5 , CPI inflation is projected to average 5.4 per cent in 2023-24 – 6.4 per cent in Q2, 5.6 per cent in Q3 and 5.2 per cent in Q4, with risks evenly balanced (Chart I.6). The 50 per cent and the 70 per cent confidence intervals for headline inflation in Q4:2023-24 are 4.1–6.3 per cent and 3.5–6.9 per cent, respectively. For 2024-25, assuming a normal monsoon, and no further exogenous or policy shocks, structural model estimates indicate that inflation will average 4.5 per cent, in a range of 3.8-5.2 per cent. In Q4:2024-25, CPI inflation is projected at 4.3 per cent, with the 50 per cent and the 70 per cent confidence intervals at 3.0–5.6 per cent and 2.3–6.3 per cent, respectively. 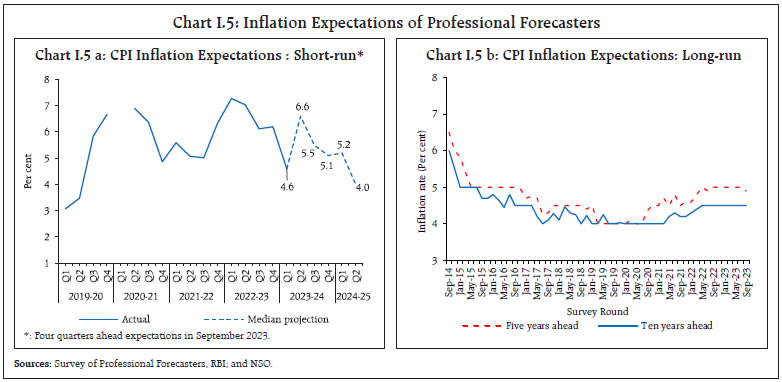 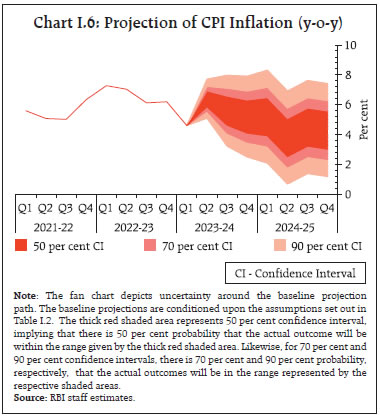 The baseline forecasts are subject to several upside and downside risks. The upside risks emanate from more persistent food price increases due to weather-related disturbances, which could then feed into inflation expectations; further hardening of global commodity prices amidst an escalation of geopolitical tensions; and a larger pass-through of input cost pressures to output prices. The downside risks could emanate from an early resolution of geopolitical tensions, a steep correction in global crude and commodity prices in the event of a sharp slowdown in the global growth, and further improvement in supply conditions. Monetary policy communication has emerged as an important tool for managing and anchoring expectations and strengthening monetary transmission in an environment of heightened uncertainty. A textual analysis of the Reserve Bank’s MPRs shows that their tone has been in consonance with the evolving price and output developments, which strengthens the monetary policy communication channel (Box I.1).
Domestic economic activity is being supported by robust agricultural performance, sustained buoyancy in contact-intensive services, the boost to investment from the government’s thrust on capital expenditure, above trend capacity utilisation in manufacturing, double digit credit growth, and healthier corporate and bank balance sheets. Slowing global growth, the drag from exports, geopolitical risks and volatile global financial conditions, however, weigh heavily on the outlook. Turning to the key messages from forward-looking surveys, consumer confidence (the current situation index) has improved in the September 2023 survey round vis-à-vis the previous round on account of better perceptions on the general economic and employment situation. Consumers’ optimism for the year ahead, measured by the future expectations index, remains upbeat on improved expectations about the general economic situation, employment, and income conditions (Chart I.7). 10 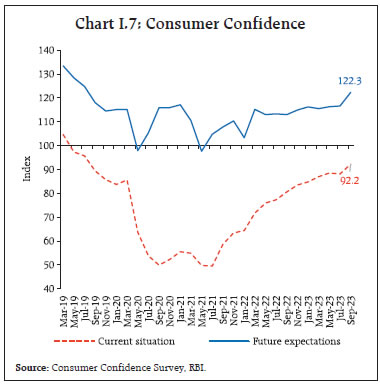 In the Reserve Bank’s industrial outlook survey of July-September 2023, manufacturing firms are optimistic about demand conditions in Q3:2023-24 (Chart I.8a). While the optimism of services sector companies waned in Q3 vis-à-vis the previous round, infrastructure sector companies remain upbeat in terms of the overall business situation (Charts I.8b and I.8c). Recent surveys by other agencies signal a mixed picture on business expectations relative to the previous round (Table I.4). Manufacturing and services firms in the PMI surveys for September 2023 exhibited optimism for the year ahead. The professional forecasters polled in the September 2023 round of the Reserve Bank’s survey expect real GDP growth at 6.3 per cent in Q2:2023-24, 5.8 per cent in Q3, 5.4 per cent in Q4 and 6.0-6.4 per cent in H1:2024-25 (Chart I.9). Taking into account the baseline assumptions, survey indicators and model forecasts, real GDP growth is expected at 6.5 per cent in 2023-24 – 6.5 per cent in Q2; 6.0 per cent in Q3; and 5.7 per cent in Q4 – with risks evenly balanced around this baseline path (Chart I.10 and Table I.3). For 2024-25, assuming a normal monsoon and no major exogenous or policy shocks, structural model estimates indicate real GDP growth at 6.5 per cent, with quarterly growth rates in the range of 6.3-6.6 per cent. 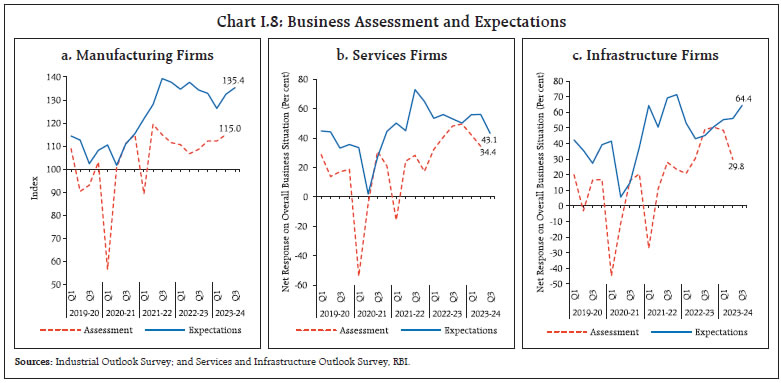 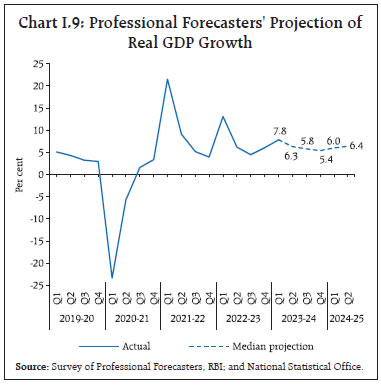 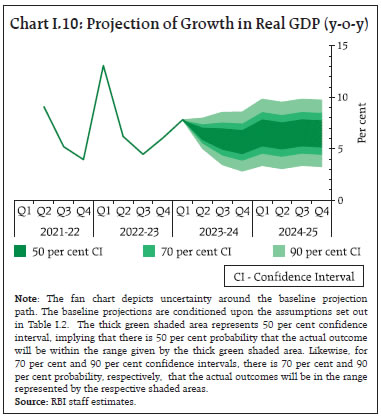 There are upside and downside risks to this baseline growth path. The upside risks emanate from a stronger-than-expected rebound in contact-intensive services, some of which have still to catch up to their pre-pandemic levels; a more vigorous boost to private investment from government’s capex push and healthier corporate balance sheets; more resilient global growth; and an early resolution of the geopolitical conflict. On the contrary, an escalation in geopolitical tensions, a further hardening of international crude oil, food and commodity prices, a sharper loss of momentum in global trade and demand, and frequent weather-related disturbances due to climate change pose downside risks to the baseline growth path. The projections of growth and inflation presented in this chapter are contingent upon the baseline assumptions set out in Table I.2. These assumptions remain subject to a range of uncertainties as elucidated earlier. Against this backdrop, this section explores plausible alternative scenarios to assess the balance of risks to the baseline projections. (i) Global Growth Uncertainties Global growth is slowing after a relatively strong outturn in H1:2023. There are downside risks to the baseline assumption from the elevated inflation trajectory in major economies, an extended phase of tight financial conditions from expectations of interest rates remaining elevated over a prolonged horizon, protracted geopolitical hostilities, supply chain fragmentations and substantive slowdown in China. Global inflation, though moderating, remains hostage to the risk of a wage-price spiral owing to tight labour markets in several AEs. There is a strong common global component in headline and core inflation across countries ( Box I.2), which could exert sustained upward inflation pressures and necessitate further monetary tightening which, in turn, could weigh down on output. In such a scenario, if global growth is 100 bps lower than the baseline, domestic growth and inflation could be around 30 bps and 15 bps, respectively, below their baseline trajectories. Conversely, if inflation in major economies retreats faster than anticipated, geopolitical tensions ebb and the stimuli measures are able to reverse the slowdown in the Chinese economy quickly, global growth may remain resilient. In this scenario, if global growth is higher by 50 bps, domestic growth and inflation could edge higher by around 15 bps and 7 bps, respectively (Charts I.11a and I.12a).
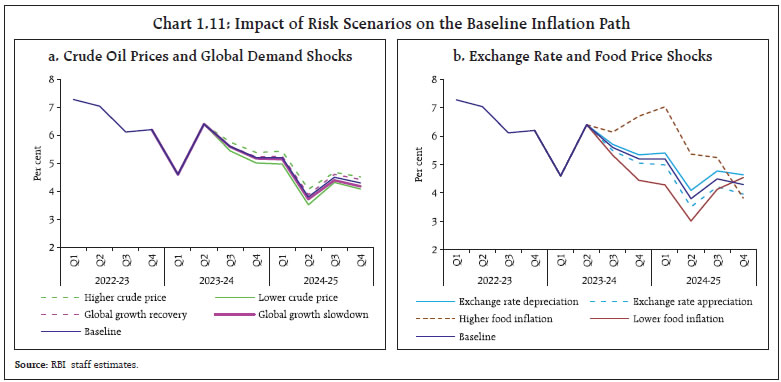 (ii) International Crude Oil Prices Global crude oil prices have remained highly volatile over the past six months. An escalation of geopolitical hostilities and further production cuts by OPEC plus amidst strong demand pose upside risks to global crude prices. Assuming crude oil price to be 10 per cent above the baseline, domestic inflation and growth could be higher by 30 bps and weaker by around 15 bps, respectively. Conversely, a de-escalation of geopolitical tensions, improved supply from non-OPEC producers and alternative energy sources, and a further weakening of global demand owing to aggressive monetary policy actions by central banks may pull down crude oil prices. If crude oil prices fall by 10 per cent relative to the baseline and assuming their full pass-through to domestic product prices, inflation could ease by around 30 bps with a boost of 15 bps to growth ( Charts I.11a and I.12a). 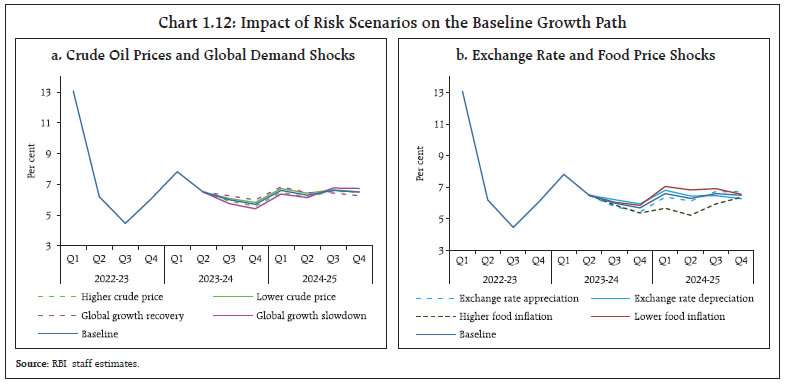 (iii) Exchange Rate The INR has fluctuated in both directions against the US dollar over the past six months. Looking ahead, the ‘higher for longer’ interest rate scenario in the US and other AEs could keep risk aversion towards EME assets elevated and impinge upon capital flows. Global foreign direct investment flows are also slowing. Crude oil and other commodity prices could harden over the baseline. Should the INR depreciate by 5 per cent over the baseline, inflation could edge up by around 35 bps while GDP growth could be higher by around 25 bps through stimulating exports. On the other hand, the Indian economy remains the bright spot in the global economy and is pivotal to the global outlook. These developments, along with a strengthening of domestic macroeconomic fundamentals, could enhance India’s attraction as a destination for foreign investors. In this scenario, if the INR appreciates by 5 per cent relative to the baseline, inflation and GDP growth could moderate by around 35 bps and 25 bps, respectively (Charts I.11b and I.12b). (iv) Food Inflation Food inflation exhibited sizeable volatility in H1:2023-24, driven by large shocks to vegetable prices due to extreme weather events which are occurring more frequently and with more force. The risk of El Niño has materialised, resulting in the driest August on record, and water reservoir levels have dipped below the decadal average levels. These developments impart a heightened uncertainty to the kharif and the ensuing rabi crops. The global food price outlook is also subject to significant upside risks from the historically unprecedented heatwave sweeping across the globe. All these developments could impart sizeable upside to the domestic food inflation trajectory and could raise headline inflation by around 100 bps over the baseline. On the other hand, given the robust kharif sowing, improved irrigation facilities, the IOD turning positive, ample foodgrains buffer stocks and effective supply management could help ease food inflationary pressures and pull headline inflation 50 bps below the baseline (Charts I.11b and I.12b). Economic activity in India is expected to remain backed up by strong macroeconomic fundamentals. Large supply shocks are, however, leading to recurrent bouts of inflation and pose challenge to the overall outlook. The uneven south-west monsoon, El Niño formation and the volatile global food prices outlook impart significant uncertainty to the outlook of food and headline inflation, even as core inflation is showing some signs of easing. Thus, price developments warrant heightened vigil and monetary policy remains focused on aligning inflation with the target. A firm anchoring of inflationary expectations can pave the path for sustained growth in the medium-term. Geopolitical hostilities, stubborn global inflation, volatile global financial markets and energy prices, and climate shocks are the key risks to the growth and the inflation outlook. __________________________________________________________________________________ 1 The Reserve Bank’s inflation expectations survey of households is being conducted in 19 cities since March 2021 (18 cities in the previous rounds) and the results of the September 2023 round are based on responses from 6066 households. 2 The results of the July-September 2023 round of the industrial outlook survey are based on responses from 1223 companies. 3 Based on 581 services companies and 104 infrastructure firms polled in the July-September 2023 round of the services and infrastructure outlook survey. 4 41 panellists participated in the September 2023 round of the Reserve Bank’s survey of professional forecasters. 5 Joice John, Deepak Kumar, Asish Thomas George, Pratik Mitra, Muneesh Kapur and Michael Debabrata Patra (2023), “A Recalibrated Quarterly Projection Model (QPM 2.0) for India”, Reserve Bank of India Bulletin, February, Volume LXXVII(2), pp.59-77. 6 The polarity score is a ratio between -1 and 1. A score in the range of -1 to -0.5 typically indicates negative sentiment, between -0.5 and 0.5 neutral sentiment, and 0.5 to 1 positive sentiment. 7 The subjectivity score captures the number of words that carry sentiment as a proportion of total number of words. 8 Complex words are words with three or more syllables, and that are not proper nouns. 9 This is in line with literature whereby central bank monetary policy press documents are generally observed to have FK and FOG scores in the range of 12-18 years and 17-23 years, respectively. 10 The Reserve Bank’s consumer confidence survey is being conducted in 19 cities since March 2021 (13 cities in the previous rounds) and the results of the September 2023 round are based on responses from 6,077 respondents. 11 The sample AE countries are: Canada, Czech Republic, European Union, Israel, Japan, Norway, Singapore, South Korea, Sweden, Switzerland, Taiwan, United Kingdom and United States. The sample EMEs are: Brazil, Colombia, Hungary, India, Indonesia, Mexico, Nigeria, Peru, Philippines, Russia, Romania, South Africa and Thailand. 12 Based on 36-month moving average. Headline inflation has been undergoing considerable volatility, breaching the upper tolerance band of 6 per cent in July-August, due to repeated supply side shocks even as core inflation has been moderating. Industrial and farm input price pressures have eased while nominal rural wage growth has been firming up. Going forward, the inflation trajectory will be shaped by weather conditions and the evolution of global food and crude oil prices. Since the April 2023 MPR, consumer price index (CPI) headline inflation 1 has seen considerable volatility, moving in a wide range of 4.3 per cent to 7.4 per cent during February-August 2023. It initially moderated from 6.4 per cent in February 2023 to 4.3 per cent in May 2023. These gains were reversed from June on accentuation of food price pressures, and headline inflation surged to 7.4 per cent in July. In August, the onset of vegetable price correction softened it to 6.8 per cent. Core inflation (CPI excluding food and fuel) 2 has eased between February and August 2023 by 1.3 percentage points (Chart II.1). 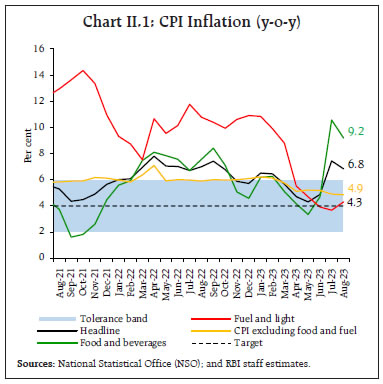 The Reserve Bank of India (RBI) Act enjoins the RBI to set out deviations of actual inflation outcomes from projections, if any, and the underlying reasons thereof. The April 2023 MPR had projected inflation at 5.1 per cent for Q1:2023-24 and 5.4 per cent for Q2 (Chart II.2). In Q1, actual inflation at 4.6 per cent trailed projection by 50 basis points (bps), as food inflation turned out to be lower than anticipated due to a muted seasonal pick-up in vegetables prices during April-May and a sustained decline in prices of edible oil. In Q2 (July-August), on the other hand, the actual outcome at 7.1 per cent exceeded the projection by 170 bps due to a steep rise in vegetables prices, particularly those of tomatoes. In fact, vegetable prices and even overall food prices registered the highest month over month increase in the current CPI series (2012=100) in July, resulting in the projection error. During H1:2023-24, headline inflation movements benefited from strong favourable base effects 3 averaging one percentage point during March-May 2023, which pulled down headline inflation from 6.4 per cent in February to 4.3 per cent in May. Thereafter, a pick-up in the price momentum, alongside waning base effects led to an uptick in headline inflation to 4.9 per cent in June. In July, an all-time high momentum in food prices (5.7 per cent) and strong momentum in fuel (1.8 per cent) led to a record monthly momentum of 290 bps in headline inflation, pushing the y-o-y inflation to 7.4 per cent. In August, a decline in momentum, along with favourable base effects helped soften inflation to 6.8 per cent (Chart II.3). 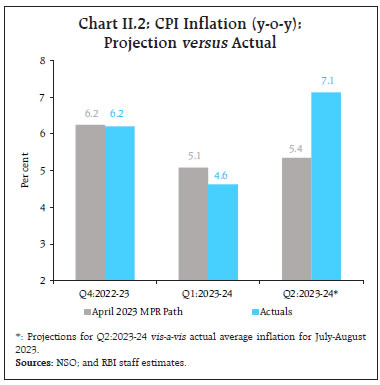 The CPI inflation distribution during 2023 vis-à-vis the earlier years was marked by a significant increase in standard deviation, mirroring the large variation in inflation rates, even as the mean of the distribution fell to 5.8 per cent in 2023 (January-August) from 6.8 per cent in the corresponding period of 2022 (Chart II.4). Inflation variability increased substantially across the CPI sub-groups during July-August 2023 following the vegetable price shock (Chart II.5). 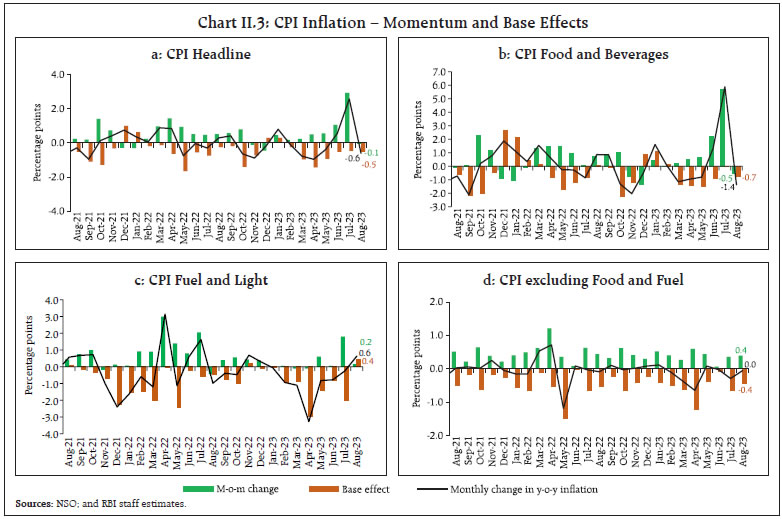 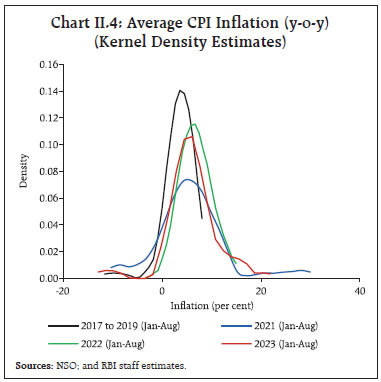 Diffusion indices (DIs) 4 softened during March-May 2023 as the fall in inflation was accompanied by a narrowing of the spread of price increases across the CPI basket, driven largely by prices of goods ( Chart II.6a). Moreover, unlike a year ago when price increases in excess of 4 per cent on a seasonally adjusted annualised rate (saar) basis were the norm across the CPI basket, there was a marked slowdown in the magnitude of price increases since March 2023 as measured by threshold DI 5 (Chart II.6b). During June-August, the diffusion of price increases broadened across goods and services, though a majority of items registered price increases of less than 4 per cent on a saar basis. 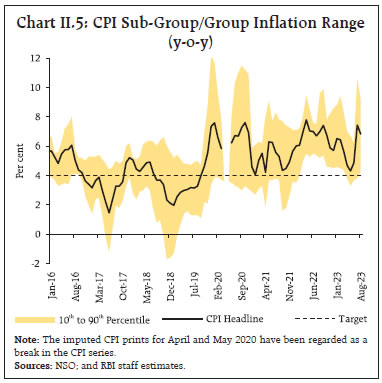 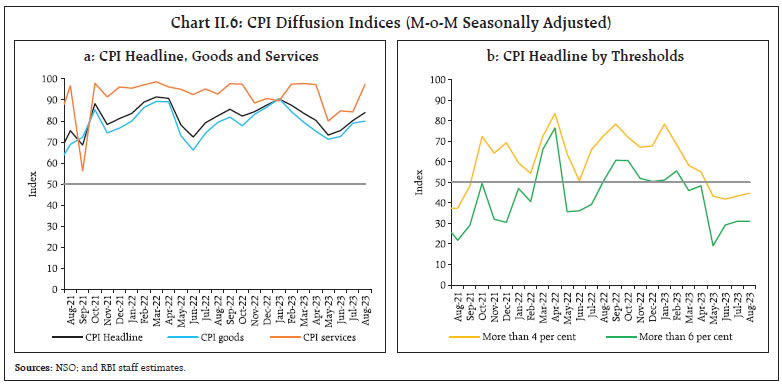 A historical decomposition of inflation using a vector autoregression (VAR) 6 model indicates that the moderation in inflation in Q1:2023-24 came from a waning of supply side shocks as also from the disinflation engendered by the transmission of past monetary policy actions. Of the 270 bps moderation in headline inflation (from 7.3 per cent in April-June 2022 to 4.6 per cent in April-June 2023), 130 bps was due to monetary policy tightening (a cumulative increase of 250 bps in the policy rate) and the remaining 140 bps was due to the waning of supply shocks. The jump in inflation in Q2:2023-24 (up to August) was entirely due to adverse supply shocks even though the restraining effects of cumulative monetary tightening were still playing out (Chart II.7a). Goods inflation (with a weight of 76.6 per cent in overall CPI) contributed around three-fourths of headline inflation during March-May 2023 and services (with a weight of 23.4 per cent) the remaining one-fourth. By August, the contribution of goods to overall inflation rose to 81 per cent (Chart II.7b). Within goods, perishable items (non-durable with a 7-day recall 7 ), particularly fruits, vegetables, and other food items such as eggs, meat, fish and milk were the main drivers. The contribution of semi-perishable items (non-durable goods with a 30-day recall) such as petroleum products, household items (particularly, washing soaps and powders), personal care items (like toiletries) and medicines declined from 46 per cent in March 2023 to 29 per cent in August. Similarly, the contribution of durables (goods with a 365-day recall) like clothing and footwear items, motor cycle/scooter, and household goods (furniture and electronic items) to overall inflation declined to 9 per cent in August 2023 from 14 per cent in March 2023. With the gradual moderation in the international commodity prices since September 2022, the contribution of imported components 8 to headline inflation turned negative towards the end of 2022, driven down by the y-o-y fall in the prices of edible oils, energy, electronic goods parts, and polymer (Chart II.7c). With the pick-up in the global commodity prices in July 2023, primarily driven by energy prices, the negative contribution of imported inflation lessened to (-)1.2 per cent in August. 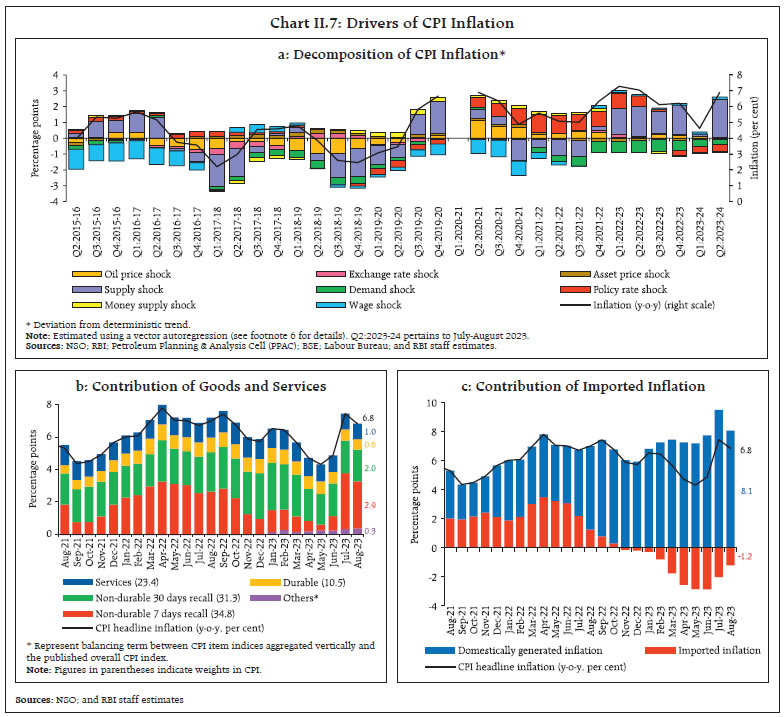 Food Group Food and beverages (weight of 45.9 per cent in the CPI basket) inflation, which was muted in Q1:2023-24 at 4.1 per cent, increased sharply to 10.6 per cent in July, led by the steep increase in vegetables prices. With corrections in the vegetable prices on fresh crop arrivals, food inflation moderated to 9.2 per cent in August. CPI food inflation excluding vegetables, however, increased to 6.4 per cent during July-August from 5.4 per cent in Q1 as inflation in respect of cereals, pulses, and spices remained elevated. Inflation in oils and fats remained in deflation, partially offsetting the upside pressures across other major sub-groups in the food basket (Chart II.8). The sharp increase in vegetables prices in July was due to supply disruptions caused by heavy rainfall and floods in the northern parts of the country and lower production due to pest attacks on crops in Karnataka and Maharashtra. Uneven rainfall distribution, delayed sowing of rice, and lower stock of wheat along with lower production of spices contributed to the hardening of prices in cereals and spices. 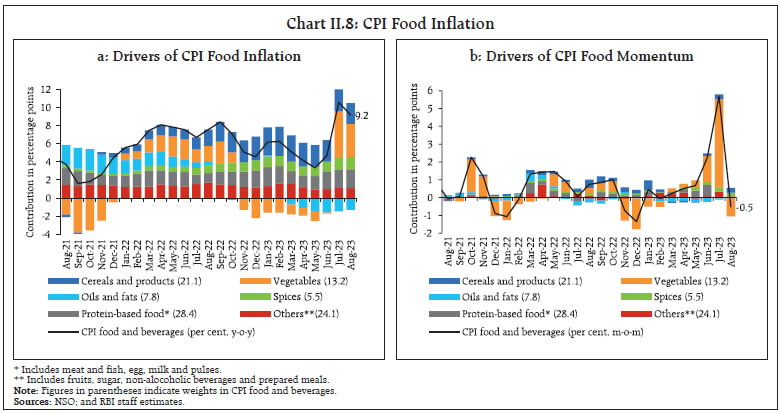 The overall food price build-up in 2023-24 was higher than historical patterns, driven by vegetables, spices, pulses, sugar and cereals. The price build-ups in six of the twelve sub-groups – fruits; meat and fish; milk; prepared meals; non-alcoholic beverages; and eggs – were lower than their long-term averages (Chart II.9). 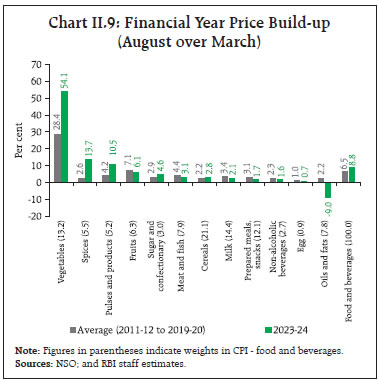 Inflation in cereals (weight of 9.7 per cent in the CPI and 21.1 per cent in the food and beverages group) remained elevated during April-August 2023 (Chart II.10). After a decline between March and May 2023, wheat prices surged as rabi wheat crop was impacted by unseasonal rains. Rice prices increased sharply as uneven rainfall distribution led to delay in kharif sowing. However, sowing eventually picked up (1.9 per cent over last year as on September 29, 2023) on account of revival in monsoon. As part of the supply side interventions to improve domestic supply and ease price pressures, the Government (i) announced to release a cumulative 5 million tonnes of wheat and 2.5 million tonnes of rice in the open market in a phased manner; (ii) imposed an export duty on parboiled rice, restricted exports of non-basmati rice and levied stock limits on wheat; and (iii) stopped the diversion of subsidised rice to distilleries for ethanol production. 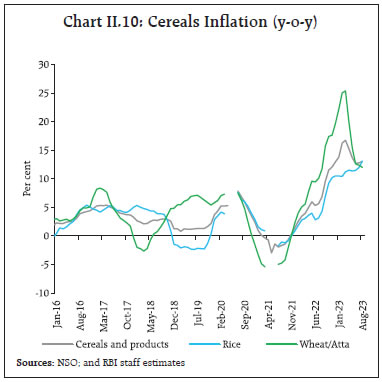 After being in deflation during November 2022-June 2023, prices of vegetables (weight of 6.0 per cent in the CPI and 13.2 per cent in the food and beverages group) increased sharply to record a y-o-y inflation of 37.4 per cent in July 2023, due to weather related crop damage and disrupted supply chains in North India. A pick-up in market arrivals and improved supply conditions caused inflation in this category to moderate to 26.1 per cent in August (Chart II.11). Among key vegetables, tomato prices, on a y-o-y basis, surged by 202.1 per cent in July. A revival in market arrivals moderated tomato price inflation to 180.3 per cent in August 2023. Potato prices have remained in deflation since February 2023 on account of higher production last year (an increase of 6.3 per cent in 2022-23 as per 1st advance estimates (AE) over 2021-22). Onion prices, which were in deflation during September 2021-May 2023, recorded an inflation of 23.2 per cent in August 2023 on lower production [(-) 2.1 per cent in 2022-23 1st AE over 2021-22] as well as low quality of the rabi crop reducing shelf life. Overall, the record price increase in July propelled the tomato, onion, and potato (TOP) group price build-up (July-August over March) to one of the largest ever seen in the current CPI series ( Chart II.12a). Vegetables excluding TOP – ginger, garlic, cauliflower, cabbage, brinjal and green chillies – also witnessed high price pressures in July due to rain induced supply disturbances. The price build-up in non-TOP vegetables during 2023-24 (up to August) was unprecedented by historical patterns and contributed substantially to the spike in vegetables inflation ( Chart II.12b). With the improving supply situation, the prices of vegetables excluding TOP corrected in August. To rein in prices, the government announced sale of tomatoes at concessional rates at several markets in the country during July-August 2023 and release of onions (under the Price Stabilisation Fund) at subsidised rates from the buffer stocks. 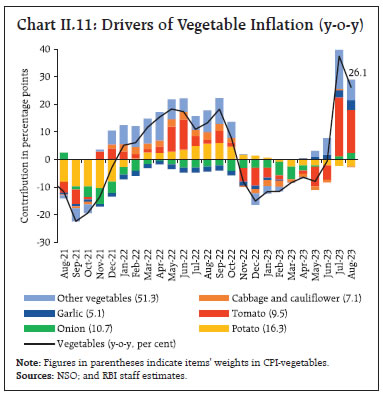 Inflation in fruits (weight of 2.9 per cent in the CPI and 6.3 per cent within the food and beverages group) has moderated since April 2023 on the back of higher production (0.2 per cent as per 2022-23 1st AE over 2021-22). However, there was an uptick in inflation in July-August 2023, primarily driven by a rise in apple prices to 21.3 per cent (y-o-y) in August from an average of 5.1 per cent in Q1:2023-24 as floods in Himachal Pradesh damaged apple plantations and led to supply disruptions. Mango prices remained in deflation since April 2023, while banana price inflation moderated from 21.8 per cent in March 2023 to 2.2 per cent in August on the back of comfortable production. 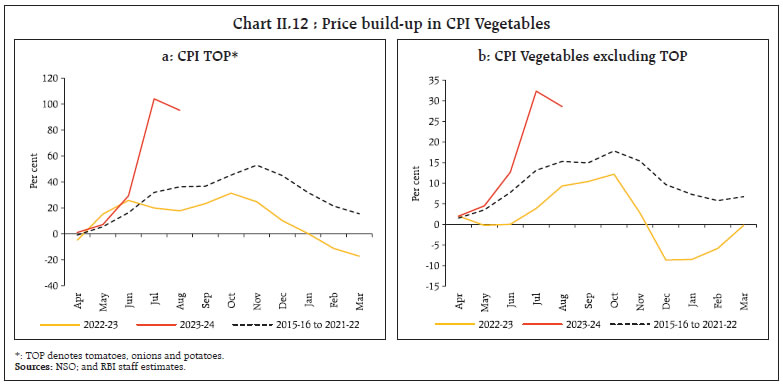 Inflation in pulses (weight of 2.4 per cent in the CPI and 5.2 per cent in the food and beverages group) increased gradually, with a substantial price build-up from April leading to a print of 13.0 per cent in August 2023. The uptick came from lower production and deficient kharif sowing. As per the 3rd AE of 2022-23, the kharif production of pulses was lower than the final estimates for 2021-22, particularly for tur and urad ((-) 18.7 per cent and (-) 3.2 per cent, respectively). Owing to the downward revision, the pulses stock-to-use (STU) ratio has also fallen. Furthermore, deficient kharif sowing of (-) 4.9 per cent in tur, (-) 1.3 per cent in urad and (-) 6.0 per cent in moong (as on September 29, 2023) also added to price pressures (Chart II.13 and Chart II.14). To contain price pressures and improve domestic availability, the government (i) imposed stock limits on tur and urad on June 2, 2023, which will be effective till December 31, 2023; (ii) removed procurement ceilings of 40 per cent for tur, urad and masoor under the Price Support Scheme (PSS) for 2023-24 to encourage higher sowing acreage; and (iii) decided to release tur from the national buffer in a calibrated manner. Prices of animal-based protein items increased sharply in H1:2023-24 (April-August), driven by milk and products (weight of 6.6 per cent in the CPI and 14.4 per cent within the food and beverages group) ( Chart II.15) which averaged 8.5 per cent during April-August 2023 as major milk co-operatives like Amul raised retail prices by ₹2-3 per litre twice from February 2023, citing high input costs. Prices of eggs, meat and fish eased in July-August 2023 due to low seasonal demand. 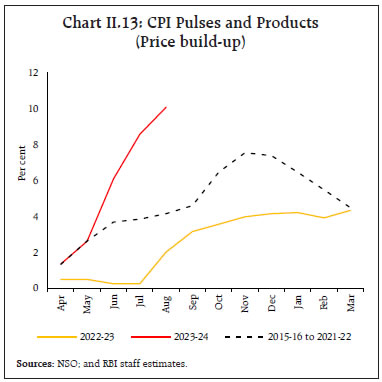 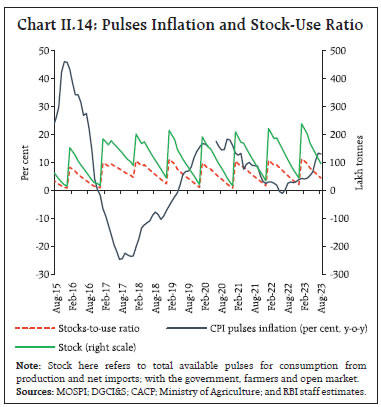 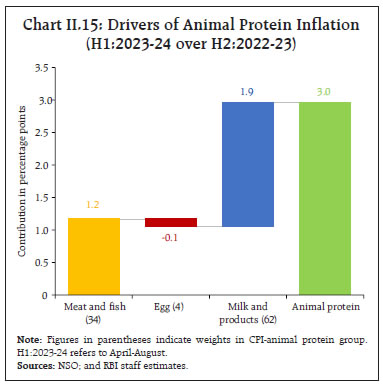 Prices of oils and fats (weight of 3.6 per cent in the CPI and 7.8 per cent within the food and beverages group) were in deflation during April-August 2023, reflecting falling international prices and higher domestic production of oilseeds (8.0 per cent as per 3rd AE of 2022-23 over 2021-22) (Chart II.16). As part of price stabilisation measures, the government reduced the basic import duty on refined soyabean oil and refined sunflower oil from 17.5 per cent to 12.5 per cent (on June 15, 2023, effective till March 31, 2024) and exempted imports of crude soybean oil and crude sunflower oil from basic customs duty and agriculture infrastructure and development cess (AIDC) till June 30, 2023 for tariff rate quota (TRQ) holders to ensure domestic availability and affordable prices. Ghee and butter price inflation remained at elevated levels, reflecting the pass-through of higher milk prices. 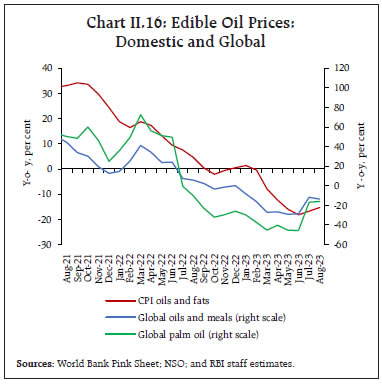 Inflation in prices of sugar and confectionery (weight of 1.4 per cent in the CPI and 3.0 per cent in the food and beverages group) increased gradually during April-August 2023, reflecting reduced production in 2022-23 season from the earlier estimate and the pickup in demand during summer months. Among other food items, inflation in prices of spices witnessed a sustained rise, averaging 19.9 per cent during April-August 2023 and driven mainly by jeera (cumin) and dry chillies due to subdued production for the second consecutive year in 2022-23 on account of poor weather conditions and crop substitution in major producing states. On a y-o-y basis, jeera recorded the highest increase in prices at 118.2 per cent in August; inflation in prices of dry chillies was also elevated averaging 24.2 per cent during April-August 2023. Inflation in prepared meals moderated gradually, reflecting the waning of the pass-through of past increases in input costs such as edible oils, LPG, and transport costs. Retail Margins Retail price margins – the difference of retail and wholesale prices 9 – remained broadly unchanged for cereals. Pulses price margins underwent an increase during July-September 2023, driven by retail prices of tur, urad, moong and gram. Price margins in edible oils (groundnut, soyabean, sunflower and mustard oil) remained elevated and steady even as wholesale prices registered a downward movement. Margins in vegetables prices picked up significantly during June-August 2023, owing to the sharp increase in retail margins in tomatoes (Chart II.17). With an easing of tomato prices starting the third week of August 2023, retail margins for vegetables softened in September 2023. The sensitivity of margins to wholesale prices in the TOP group is the highest for tomatoes and the lowest for potatoes (Box II.1). 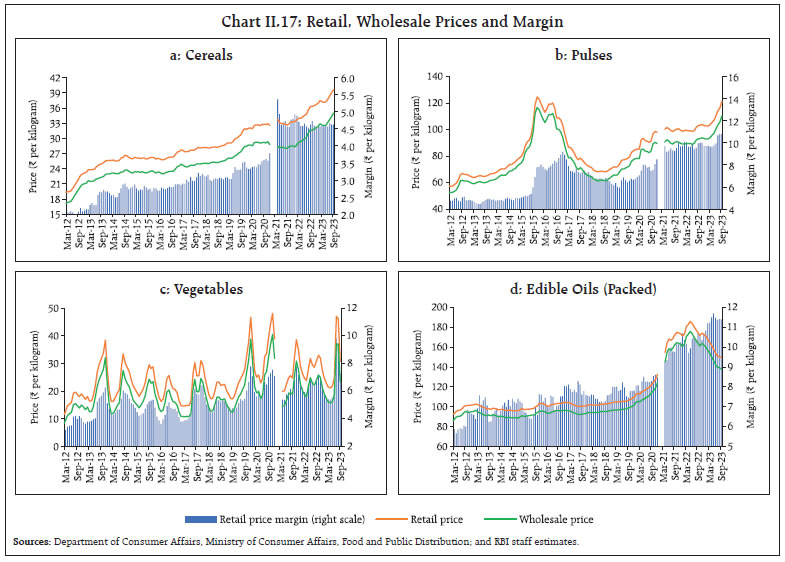
Fuel Group CPI fuel inflation moderated from 8.8 per cent in March 2023 to 3.7 per cent in July on account of softening of kerosene and domestic liquified petroleum gas (LPG) prices, before it rose to 4.3 per cent in August. With domestic prices of LPG kept unchanged between March and late August, the moderation came from favourable base effects. Kerosene prices remained in deflation during May-August 2023 on a y-o-y basis as domestic prices fell in line with international prices, aided by favourable base effects. Firewood and chips prices also moderated during March-August. Electricity prices, on the other hand, registered a substantial increase from May, leading to a record inflation (y-o-y) of around 13.5 per cent in August (Chart II.18). 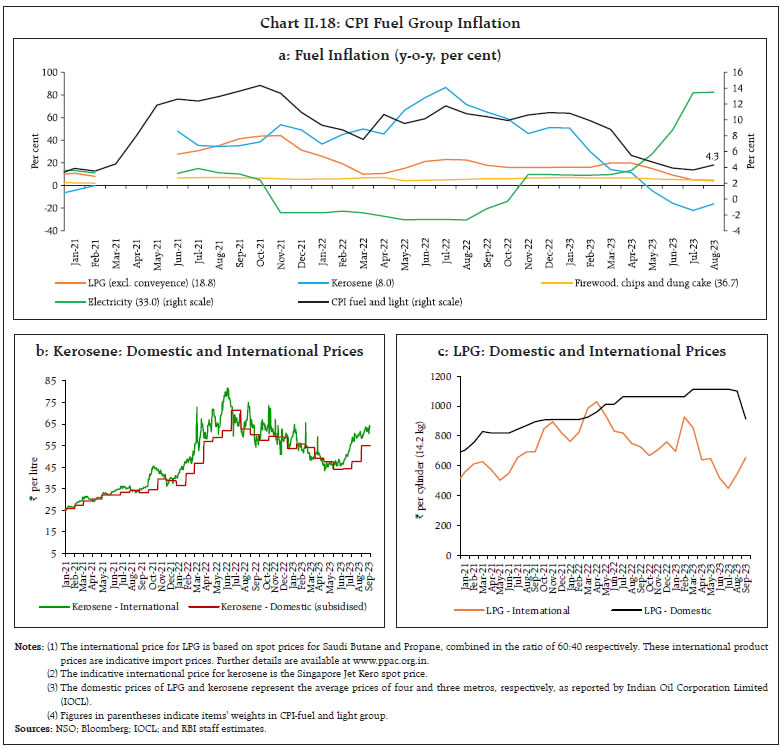 Core (CPI excluding Food and Fuel) Core inflation (CPI excluding food and fuel) eased from 6.1 per cent in February 2023 to 4.9 per cent during July-August. Exclusion-based measures of underlying inflation, which remove volatile items such as petrol, diesel, gold, and silver also witnessed moderation in the range of 130-140 bps during this period (Table II.1). Reversing the generalisation and persistence observed during 2022-23, core inflation softened during 2023-24 (April-August), along with a lower standard deviation (Chart II.19). During April-May 2023, threshold diffusion indices of core CPI items registering price increases of greater than 6 per cent (saar) as well that of 4 per cent (saar) moved into the contraction zone, indicating some abatement in the intensity of price pressures. During June-August, the diffusion index rebounded, but threshold core DIs for saar of greater than 4 per cent and 6 per cent remained in contraction ( Chart II.20). 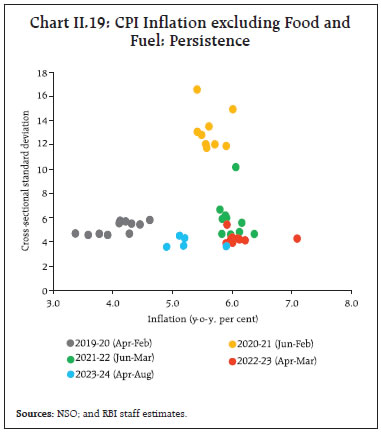 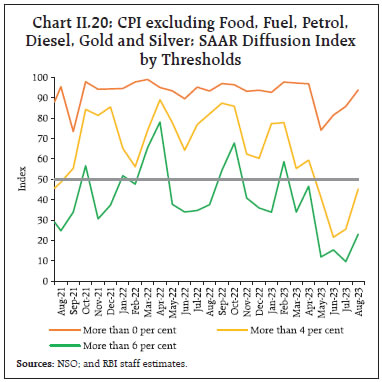 During 2023-24 (April-August), the contribution of transportation and communication and clothing and footwear sub-groups registered a significant softening (Chart II.21). 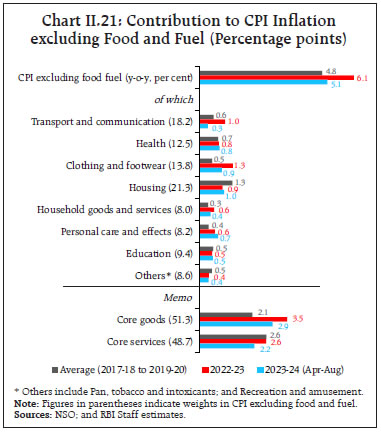 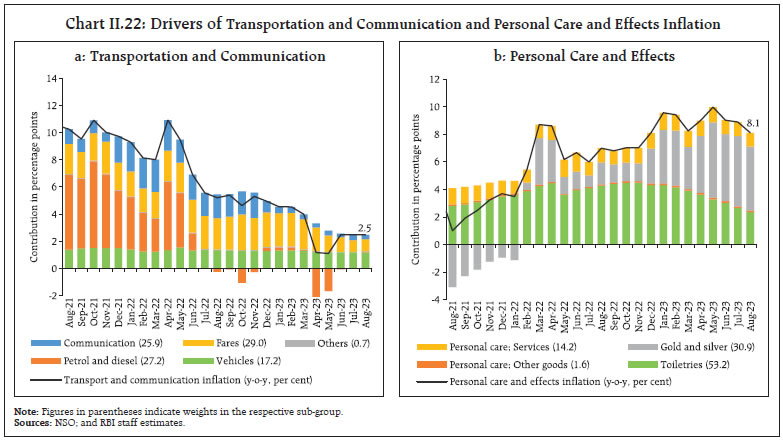 The movement of petrol and diesel prices into deflation during Q1:2023-24, along with a softening in transportation fares and communication services, led to the sharp moderation in transportation and communication inflation. A firming up of gold and silver prices kept personal care and effects inflation and its contribution to core inflation elevated (Chart II.22). A decomposition of CPI excluding food, fuel, petrol, diesel, gold, and silver inflation into its goods (with a weight of 20.7 per cent in the headline CPI) and services (weight of 23.0 per cent) components shows a softening in both the categories, but mainly led by goods. While core goods inflation moderated by 190 bps from 7.3 per cent in February 2023 to 5.4 per cent in August, services core inflation fell by around 90 bps to 4.2 per cent. The key drivers of the softening in goods inflation were clothing and footwear, household goods and personal care and effects (excluding gold and silver) (Chart II.23a). In the case of services, transportation fares (bus/tram/taxi fare, air fare) and communication services along with housing drove the moderation in inflation (Chart II.23b). Trimmed mean measures 11 also indicate a tempering of underlying inflation pressures, with weighted median inflation registering a decline of 140 bps between February and August 2023 (Table II.2). 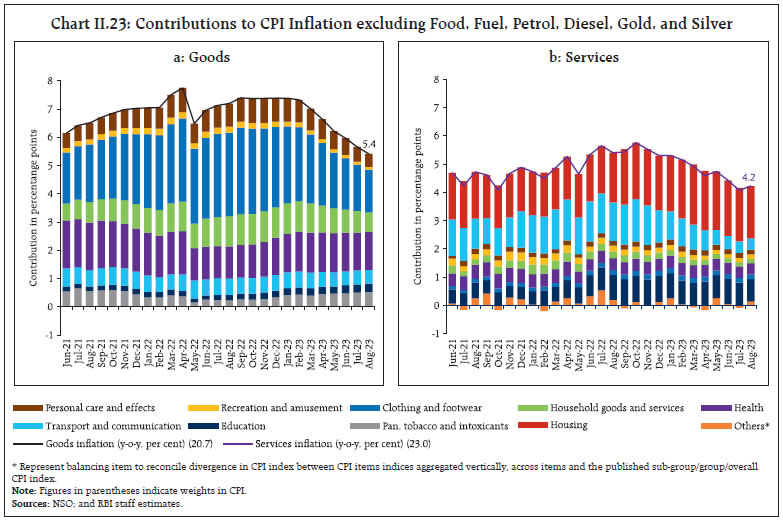 Other Measures of Inflation Sectoral measures of CPI inflation for rural areas, i.e., CPI agricultural labourers (CPI-AL) and rural labourers (CPI-RL) as also for industrial workers (CPI-IW) exceeded CPI headline inflation during March-June 2023 across most major groups. During July-August 2023, CPI-AL, CPI-RL, and CPI-IW edged up on higher food prices, in line with headline CPI. Wholesale price index (WPI) inflation, which was on a downward trajectory since October 2022, spiralled down into deflation in April-August, partly offset by higher vegetable prices in July, and fuel prices in August. The deflation in WPI pulled down the deflators for gross value added (GVA) and gross domestic product (GDP) in Q1:2023-24 (Chart II.24a). Overall, WPI inflation remained far below headline CPI inflation during March-August 2023, driven down by the fuel group – CPI contains transport fuel (petrol and diesel) prices of which have remained flat since August 2022, whereas WPI contains in addition to petrol and diesel, other fuels such as aviation turbine fuel, naphtha and furnace oil, all of which were by and large in deep deflation tracking international prices. In terms of other major groups, WPI inflation in food (particularly, cereals, milk and pulses), clothing and footwear, and pan, tobacco and intoxicants also ruled below the corresponding CPI groups/subgroups ( Chart II.24b). 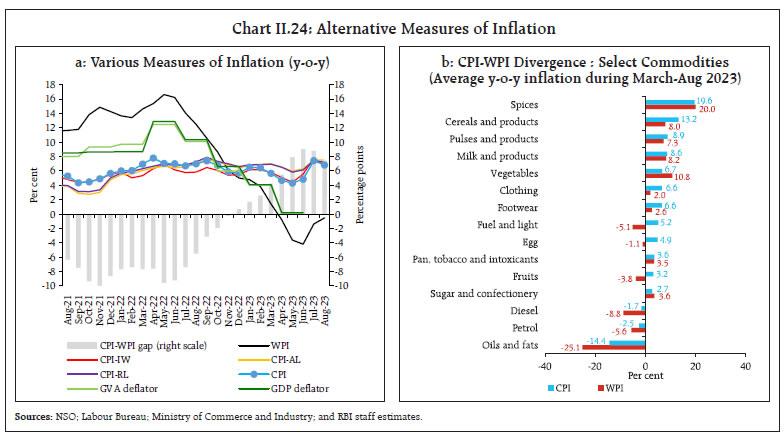 Costs, as measured by WPI inflation in industrial raw materials and farm inputs, entered negative territory in April-May 2023 and remained muted since then, reflecting easing international commodity prices ( Chart II.25). Prices of industrial inputs such as high-speed diesel (HSD), naphtha, aviation turbine fuel (ATF), bitumen, furnace oil, and petroleum coke were in deflation during April-August, mirroring international crude oil price movements. The other contributory factors were non-food primary articles, particularly cotton and oilseeds, whose prices declined due to lower international prices and higher domestic production. Minerals price inflation, however, recorded an uptick during July-August 2023 driven by metals, particularly copper, on rising demand coupled with limited supply owing to constraints on new mining projects worldwide, increased taxes and environmental regulations. Farm input price inflation receded and turned negative from May 2023, driven by moderation in the prices of HSD and pesticides. Inflation in the price of WPI electricity – a key input in both industrial and farm inputs – declined sharply post April 2023 on account of a substantial decrease in coal prices coupled with favourable base effects. 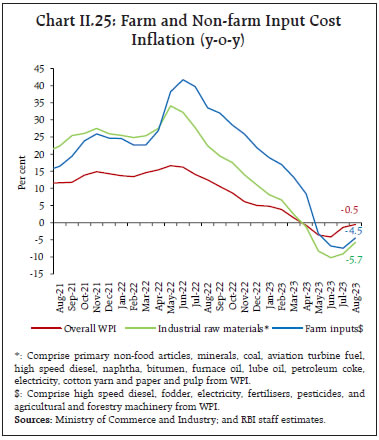 Nominal rural wage growth accelerated to 6.6 per cent in July 2023 from 5.7 per cent in March 2023, with both agricultural and non-agricultural wages rising by more than 6 per cent ( Chart II.26). While the increase in agricultural wage growth was recorded primarily in ploughing, picking works, horticulture, watering and irrigation works, packaging, and plant protection works, that in non-agricultural wages were broad based across the rural sector. In the organised sector, staff cost growth (y-o-y) quickened in Q1:2023-24 in the manufacturing sector. In the services sector, staff cost growth (y-o-y) decelerated, notwithstanding positive momentum, due to a strong favourable base effect. The share of staff cost in the value of production rose in Q1 for both manufacturing and services sectors (Chart II.27). 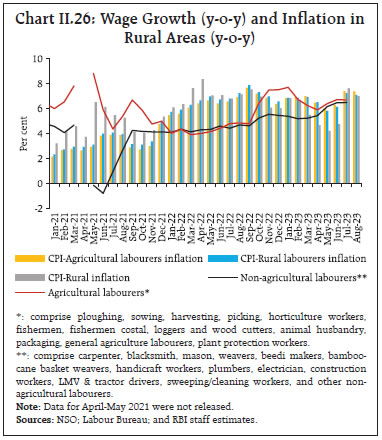 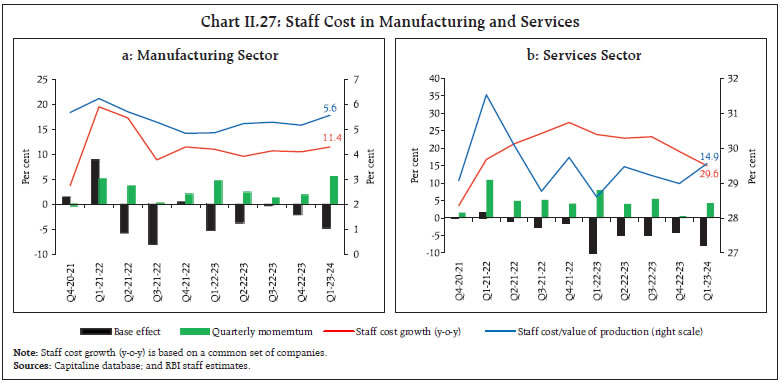 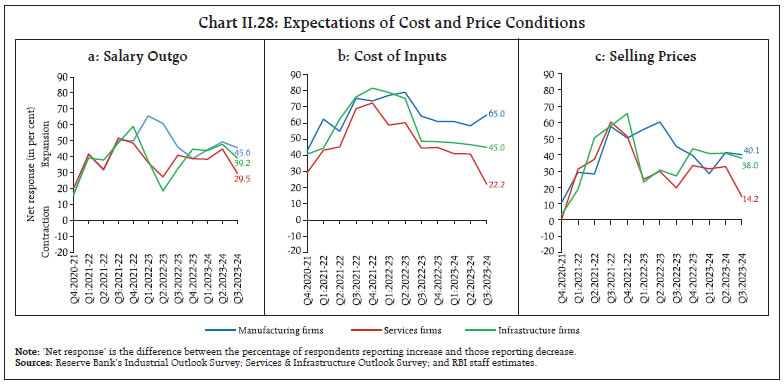 As per the firms polled in the Reserve Bank’s enterprise surveys12, the pace of salary outgoes for the manufacturing, infrastructure and services sectors is expected to moderate in Q3:2023-24. Both input cost pressures and selling prices are expected to moderate in Q3 for services and infrastructure sectors. Manufacturing firms expect an uptick in input prices in Q3, with selling price growth to be marginally lower over the previous quarter (Chart II.28). 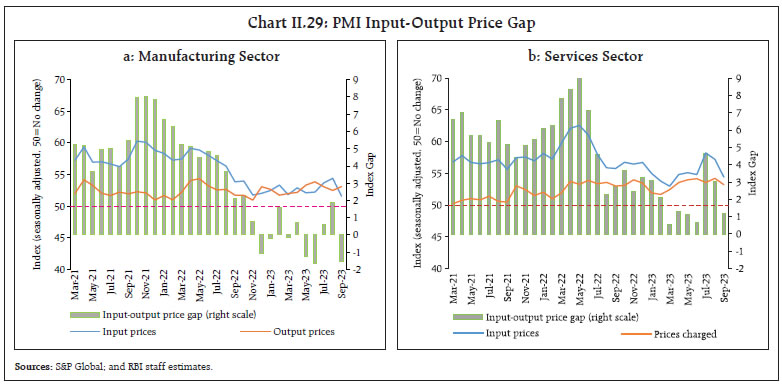 One year ahead business inflation expectations 13 of firms polled by the Indian Institute of Management, Ahmedabad, remained stable at 4.3 per cent during July-August 2023 with a moderate rise in cost pressures and improvement in sales expectations. As per manufacturing firms polled for the purchasing managers’ index (PMI), the pace of increase in input prices which quickened for the third successive month in August 2023, significantly retreated in September due to reduction in aluminium and oil prices. Higher raw materials, labour costs and increased demand led to an increase in output prices in July-September albeit at a slower pace than in May-June 2023. For services sector, the pace of increase in input prices started to fall in August-September 2023 converging towards its long-run average which also led to easing in prices charged to a six-month low. The input-output price gap reversed for manufacturing sector in September 2023 while it narrowed for services sector. (Chart II.29). Climate events imparted substantial volatility to the inflation trajectory in H1:2023-24. Going forward, the overall inflation and the food inflation trajectory will likely be shaped by the intensity of El Niño conditions, the impact of the skewed south-west monsoon and global energy and food prices. Pro-active supply side measures assume importance in mitigating the adverse impact of supply shocks in the short-run. Medium-term policies to encourage crop diversification, promote climate-resilient crops, improve storage conditions, facilitate value addition in agriculture and augment agricultural supply chains would make food prices more resilient to climate vagaries. Monetary policy would persevere in its efforts to maintain price stability, to progressively align inflation with the target rate, thereby securing the prerequisite conditions for a high and sustainable growth over the medium term. __________________________________________________________________________________ 1 Headline inflation is measured by year-on-year (y-o-y) changes in the all-India consumer price index (CPI) produced by the National Statistical Office (NSO). 2 Core CPI, i.e., CPI excluding food and fuel is worked out by eliminating the groups ‘food and beverages’ and ‘fuel and light’ from the headline CPI. 3 A change in CPI year-on-year (y-o-y) inflation between any two months is the difference between the current month-on-month (m-o-m) change in the price index (momentum) and the m-o-m change in the price index 12 months earlier (base effect). For more details, see Box I.1 of the MPR, September 2014. 4 The CPI diffusion index, a measure of dispersion of price changes, categorises items in the CPI basket according to whether their prices have risen, remained stagnant or fallen over the previous month. The higher the reading above 50, the broader is the expansion or generalisation of price increases; the further is the reading below 50, the broader is the price decline across items. 5 Threshold diffusion indices capture the dispersion of price increases in CPI basket beyond the specified saar thresholds of 4 per cent and 6 per cent. 6 Historical decomposition estimates the contribution of each shock to the movements in inflation over the sample period (Q4:2010-11 to Q2:2023-24) based on a vector autoregression (VAR) with the following variables (represented as the vector Yt) – crude oil prices (US$ per barrel); exchange rate (INR per US$), asset price (BSE Sensex), CPI; the output gap; rural wages; the policy repo rate; and money supply (M3). All variables other than policy repo rate are y-o-y growth rates. The VAR can be written in reduced form as: Yt =c + A Yt-1 + et; where e t represents a vector of shocks. Using Wold decomposition, Yt can be represented as a function of its deterministic trend and sum of all the shocks et. This formulation facilitates decomposition of the deviation of inflation from its deterministic trend into the sum of contributions from various shocks. 7 The CPI weighting diagrams use the modified mixed reference period (MMRP) data based on the 2011-12 Consumer Expenditure Survey conducted by the National Sample Survey Office (NSSO). Under MMRP, data are collected on expenditures incurred for frequently purchased items – edible oil, eggs, fish, meat, vegetables, fruits, spices, beverages, processed foods, pan, tobacco and intoxicants – during the last seven days; for clothing, bedding, footwear, education, medical (institutional), durable goods, during the last 365 days; and for all other food, fuel and light, miscellaneous goods and services including non-institutional medical services, rents and taxes, data relate to the last 30 days. 8 Global commodities that drive domestic prices include petroleum products, coal, electronic goods, gold, silver, chemical products, metal products, textiles, cereals, milk products, and vegetables oils – these together have a weight of 36.4 per cent in the CPI basket. 9 Item level retail and wholesale prices are aggregated at respective subgroups using item level CPI weights. Data for January-March 2021 have been excluded due to changes in price collection mechanism and item varieties by DCA. 10 Margins have been computed as the difference between retail and wholesale prices. Monthly retail and wholesale prices of TOP provided by Department of Consumer Affairs (DCA), GoI have been used for the analysis. 11 While exclusion-based measures drop a fixed set of volatile items (for example, food and fuel) in each period, trimmed measures exclude items located in the tails of the inflation distribution - items displaying changes more than the specified threshold in prices each month are excluded, and the items dropped differ from month to month. 12 Industrial Outlook Survey; and Services and Infrastructure Outlook Survey. 13 Based on the monthly Business Inflation Expectations Survey (BIES) of the Indian Institute of Management, Ahmedabad. The survey polls a panel of business leaders primarily from the manufacturing sector about their inflation expectations in the short and medium term. Domestic economic activity held up well in H1:2023-24, underpinned by private consumption and investment activity. The sustained buoyancy in services, consumer and business optimism, government’s continued thrust on capex, and healthy balance sheets of banks and corporates brighten the outlook. Geopolitical tensions, geoeconomic fragmentation, signs of a global economic slowdown and El Niño conditions pose risks. Underpinning the resilience of domestic economic activity in H1:2023-24, private consumption was driven by stable urban demand and a gradual revival in rural demand. Investment activity gained traction from sustained government capex. On the other hand, weak external demand restrained domestic activity. On the supply side, the broad-based buoyancy of services activity was sustained by the strong momentum driving contact-intensive services. Agriculture activity has withstood the vicissitudes of the south-west monsoon. Manufacturing sector extended a modest recovery on the back of moderating input cost pressures and improving profit margins. Aggregate demand conditions exhibited buoyancy with real gross domestic product (GDP) posting a growth of 7.8 per cent (year-on-year, y-o-y) in Q1:2023-24, surpassing its pre-pandemic level by 13.6 per cent ( Chart III.1 and Table III.1). The momentum of GDP – quarter-on-quarter (q-o-q) seasonally adjusted annualised growth rate (saar) – exhibited the usual seasonal decline in Q1:2023-24 in line with the post-pandemic trends, albeit the pace of contraction was less than a year ago. GDP Projections versus Actual Outcomes The April 2023 Monetary Policy Report (MPR) had projected real GDP growth at 7.8 per cent for Q1:2023-24. Actual growth turned out to be the same as the projection (Chart III.2). 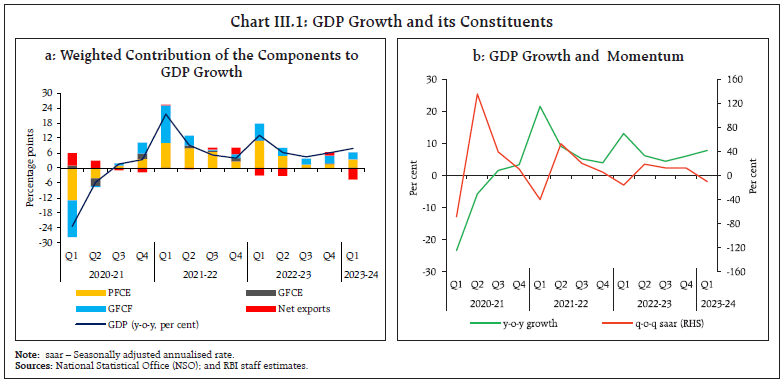 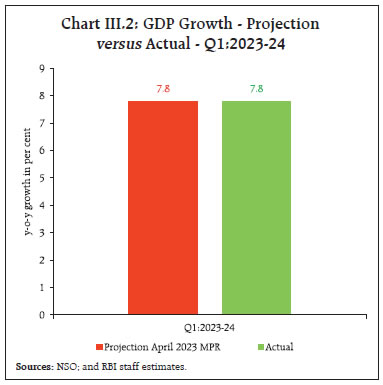 III.1.1 Private Final Consumption Expenditure Private final consumption expenditure (PFCE) – the mainstay of aggregate demand – rose by 6.0 per cent in Q1:2023-24 and contributed 3.5 percentage points to overall GDP growth. Amongst the high frequency indicators (HFIs) of urban consumption, domestic air passenger traffic and passenger vehicle sales recorded sustained growth in H1 (Chart III.3a and b); however, consumer durables were subdued during April-July, dragged down by textiles, readymade garments, and cut and polished diamonds (Chart III.3c). Bank credit to households remained supportive of urban consumption ( Chart III.3d). Rural demand showed incipient signs of recovery in H1 (Chart III.4). Tractor sales recovered during May-August, exceeding pre-pandemic levels. Motorcycle sales also expanded in Q1 but dipped in July-August and trailed last year levels. Consumer non-durables and sales volume of major fast-moving consumer goods (FMCGs) improved in H1. Fertiliser sales recovered in July-August after a dip in Q1 with the progress of kharif sowing. 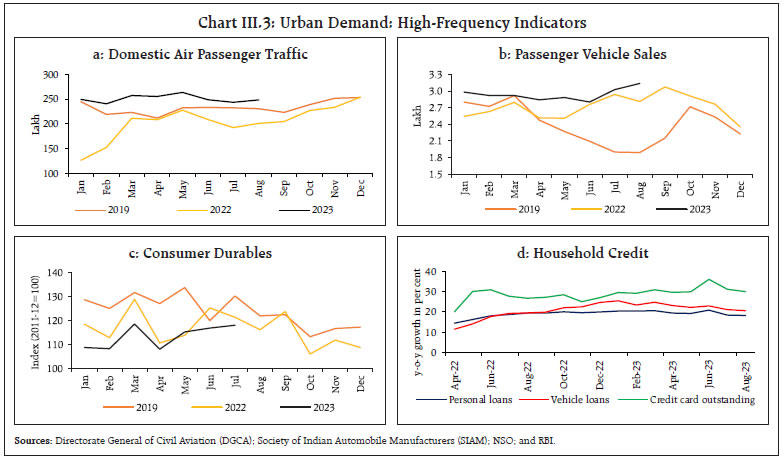 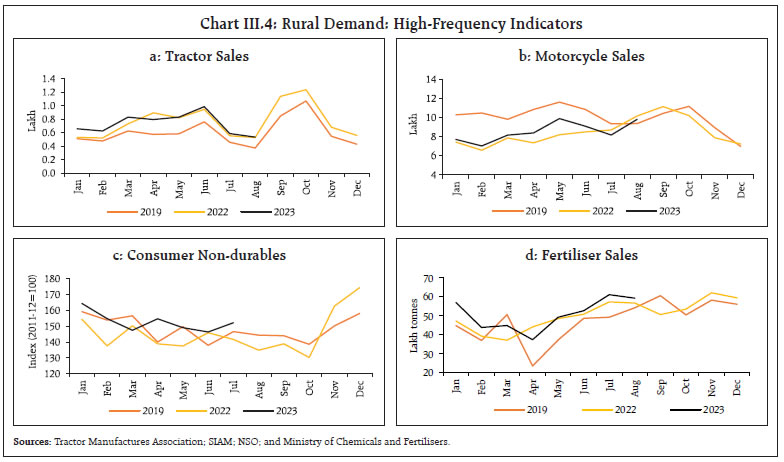 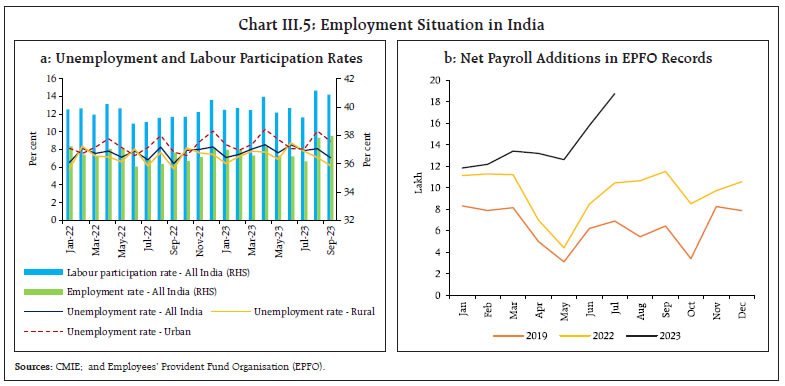 The labour force participation rate1 inched up to 40.9 per cent in September 2023 from 39.8 per cent in March (Chart III.5a). The unemployment rate increased to 8.9 per cent in September from 8.6 per cent in March in urban areas while in rural areas it moderated to 6.2 per cent from 7.8 per cent during this period. The Employees’ Provident Fund Organisation (EPFO) payrolls data point to an improvement in employment conditions in the organised sector during June-July (Chart III.5b). III.1.2 Gross Fixed Capital Formation Gross fixed capital formation (GFCF) expanded by 8.0 per cent in Q1:2023-24, driven up by the government’s capex push and a modest uptick in private sector investment. The share of GFCF in GDP was 34.7 per cent in Q1, the same as a year ago. Amongst the key underlying indicators, imports of capital goods expanded during April-August, led by machinery, electrical and non-electrical goods and iron and steel ( Chart III.6a). Railway locomotives, separators, bodies of trucks and buses supported the domestic production of capital goods (Chart III.6b). Coincident indicators of construction activity – steel consumption and cement production – posted strong growth in H1, bolstered by both residential spending and government’s infrastructure push ( Chart III.6c and d). Capacity utilisation (CU) in the manufacturing sector2 recorded a seasonal dip to 73.6 per cent in Q1:2023-24 from 76.3 per cent in Q4:2022-23, close to the long-term average of 73.7 per cent 3. Seasonally adjusted capacity utilisation improved to 75.4 per cent from 74.1 per cent (Chart III.7). Stretched capacity utilisation in manufacturing presages the need for new capacity additions to keep pace with the strength of underlying domestic demand in the economy. The interest coverage ratio (ICR)4 of listed non-financial private companies in the manufacturing and information technology (IT) sectors persisted at high levels in Q1, indicating comfortable debt servicing capacity. The ICR of non-IT services companies also ruled above the threshold level of one (Chart III.8). 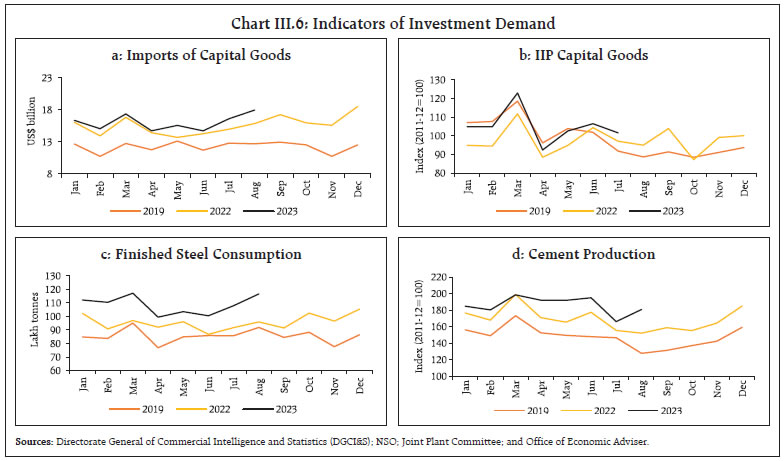 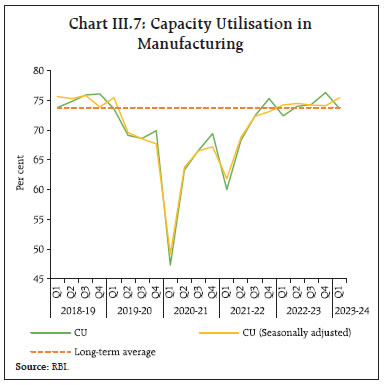 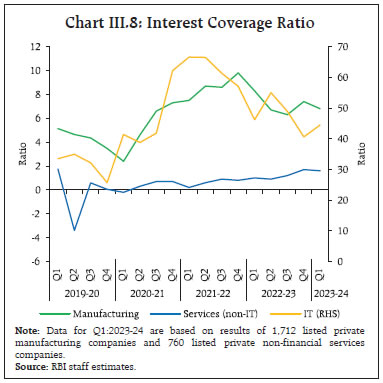 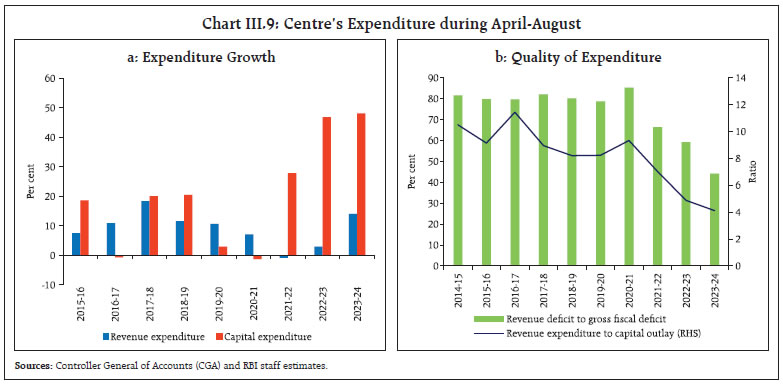 III.1.3 Government Consumption Government final consumption expenditure (GFCE) contracted by 0.7 per cent in Q1:2023-24, pulling down GDP growth. The central government’s revenue expenditure excluding interest payments and subsidies grew by 13.1 per cent (y-o-y) during April-August 2023 5. The outgo on major subsidies surged by 32.5 per cent during April-August due to higher food and fertiliser subsidies. Capital expenditure expanded by 48.1 per cent (y-o-y) during April-August, driven by 35.3 per cent increase in capital outlay, led by railways sector (Chart III.9a). The revenue expenditure to capital outlay (RECO) ratio decreased to 4.1 in April-August from 4.9 a year ago, indicative of the ongoing qualitative improvement in central government expenditure (Chart III.9b). On the receipts side, the central government’s gross tax revenues increased by 16.5 per cent y-o-y during April-August 2023, driven by a growth of 26.1 per cent in direct taxes. Indirect tax revenues expanded by 7.9 per cent y-o-y, aided by goods and services tax (GST) collections and custom duties (Table III.2 and Chart III.10). GST collections (centre plus states) drew buoyancy from improving economic activity and compliance. Custom duty receipts surged - despite a contraction in merchandise exports and imports - on account of, inter alia, higher export and import duties for a few items. Union excise duties inched down, partly on account of the cut in excise duty on petrol and diesel in May 2022. Overall, net tax revenue of the central government increased by 14.8 per cent during April-August. 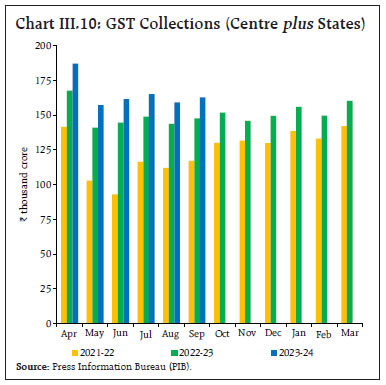 The central government’s non-tax revenues jumped by 79.4 per cent during April-August 2023 due to higher dividends and profits (Chart III.11). The Reserve Bank of India’s dividend rose to ₹87,416 crore from ₹30,307 crore last year. During April-August, the central government’s gross fiscal deficit (GFD) stood at 36.0 per cent of the full year’s budget estimates (BE), higher than 32.6 per cent a year ago. 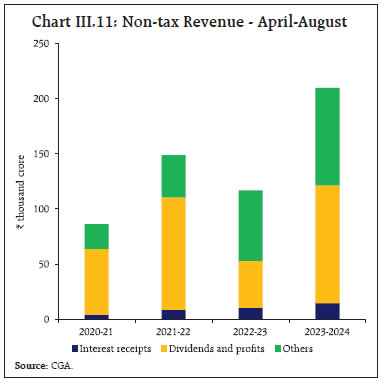 Turning to state governments, their consolidated GFD is budgeted at 3.1 per cent of the GDP in 2023-24, i.e., within the 3.5 per cent limit stipulated by the central government. Growth in revenue receipts is budgeted to accelerate, led by tax revenue (Table III.3 and Chart III.12a). Capital spending is expected to rise by 40.3 per cent in 2023-24 on top of 18.5 per cent a year ago, boosted by the support of ₹1.3 lakh crore from the central government under the ‘Scheme for Special Assistance to States for Capital Investment’. The revenue expenditure to capital outlay ratio is budgeted to fall to 5.0 in 2023-24 from 6.1 in 2022-23. 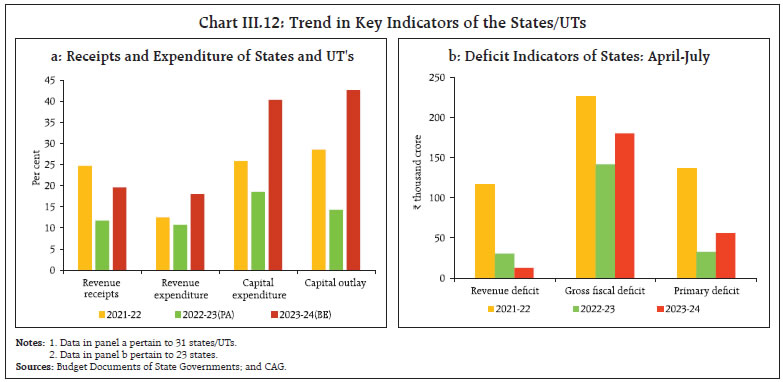 Amongst the key deficit indicators of the states/UTs, consolidated revenue deficit improved during April-July 2023, while gross fiscal deficit deteriorated due to front loading of capex during this period ( Chart III.12b). Capital expenditure of the states increased by 49.8 per cent y-o-y during April-July, aided by an additional instalment of tax devolution from the central government and an approval of ₹84,884 crores (as on July 25, 2023) from the centre under the ‘Scheme for Special Assistance to States for Capital Investment’. The Union Budget 2023-24 provided for gross and net market borrowings through dated securities at ₹15.43 lakh crore and ₹11.81 lakh crore, respectively. The centre’s gross issuances of market borrowings through dated securities amounted to ₹8.88 lakh crore during H1 (57.6 per cent of the full year’s budgeted amount) (Table III.4). The weighted average cost of issuances during H1 at 7.2 per cent was marginally lower than 7.3 per cent a year ago, while the weighted average maturity elongated to 17.6 years from 15.7 years. During H2, the Centre's gross market borrowings through dated securities have been planned for ₹6.55 lakh crore. States raised gross market borrowings of ₹3.58 lakh crore during H1 as against ₹4.37 lakh crore in the indicative calendar. During Q3:2023-24, indicative calendar has placed states gross market borrowings at ₹2.37 lakh crore. To meet the transitory mismatches between receipts and expenditure, the Ways and Means Advances (WMA) limit for the central government for H1 was ₹1.5 lakh crore, and it has been fixed at ₹50,000 crore for H2. For states/ union territories, the WMA limits remained at ₹47,010 crore as recommended by the Advisory Committee on Ways and Means Advances to State Governments (Chairman: Shri Sudhir Shrivastava). III.1.4 External Demand India’s external demand was weighed down by the slowing global economy, persisting geopolitical tensions, and geoeconomic fragmentation. Merchandise exports and imports (US$ terms) have been in contraction territory since February 2023. Services trade exhibited slowdown during April-August amidst global headwinds. According to the NSO, exports of goods and services contracted by 7.7 per cent in real terms, while imports of goods and services grew by 10.1 per cent, resulting in a sharp jump in the drag from net exports to (-) 6.4 per cent of GDP in Q1:2023-24 from (-) 0.1 per cent in Q4:2022-23 and (-) 2.3 per cent a year ago. Merchandise exports (US$ terms) fell by 11.9 per cent y-o-y during April-August 2023, and merchandise imports by 12.1 per cent. The merchandise trade deficit moderated to US$ 98.9 billion in April-August 2023 from US$ 112.9 billion a year ago as the decline in imports outpaced that in exports (Chart III.13). Merchandise exports experienced a broad-based downturn across commodities. During April-August 2023, 18 out of 30 major commodities (with a share of 73.9 per cent in the export basket) registered a decline on y-o-y basis, led by petroleum products, gems and jewellery and engineering goods. On the other hand, electronic goods, iron ore and drugs and pharmaceuticals, accounting for 13.5 per cent of total merchandise exports 6, contributed positively to export growth (Chart III.14). Overall, non-oil exports fell by 7.5 per cent during this period. 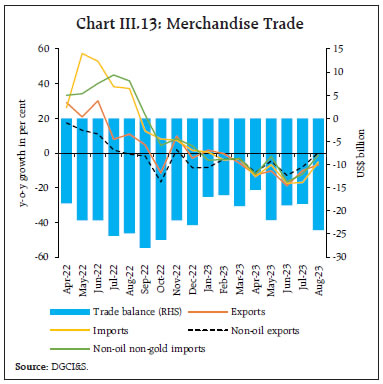 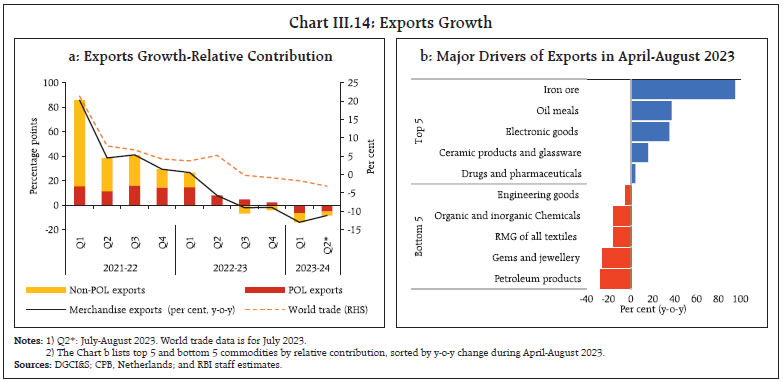 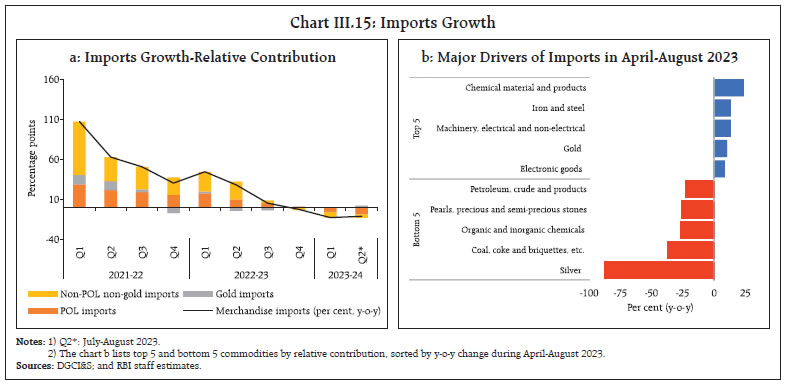 In the case of imports, 17 major commodities, accounting for 55.4 per cent of the imports basket, registered contraction during April-August 2023, driven by petroleum and crude products, coal and chemicals. Electronic goods, machinery, electrical and non-electrical products and gold imports, on the other hand, expanded (Chart III.15). Non-oil non-gold imports fell by 9.0 per cent. Services exports were buoyed by software services, business and financial services and travel services in Q1:2023-24. Services exports growth moderated substantially to 6.8 per cent during April-August 2023 from 32.1 per cent a year ago, partly reflecting slowdown in key partner countries (Chart III.16). Services imports posted a muted growth of 0.9 per cent in Q1:2023-24, with decline in outgoes under transportation servces. Services imports declined by 1.5 per cent y-o-y in July-August 2023. On a balance of payments basis, the current account deficit narrowed to 1.1 per cent of GDP in Q1:2023-24 from 2.1 per cent of GDP in the corresponding period of the previous year on the back of lower merchandise trade deficit, higher net surplus in services exports and robust inward remittances. In the financial account, net FDI inflows moderated to US$ 5.8 billion during April-July 2023 amidst a broader fall in global FDI flows ( Chart III.17). Manufacturing, financial services, business services, and computer services were the major recipient sectors while Singapore, Japan, the Netherlands, the USA and Mauritius were the major source countries of inward FDI to India. 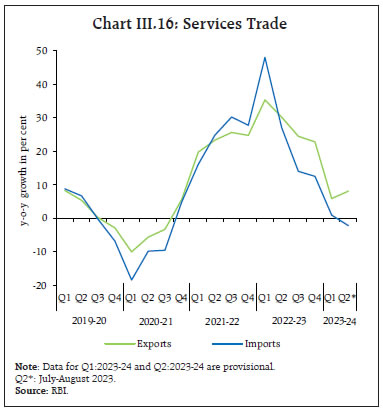 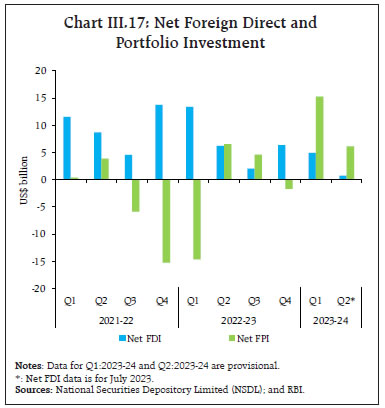 Foreign portfolio investment (FPI) rebounded mainly through the equity route in response to investors’ positive outlook on domestic growth and corporate earnings. FPI inflows of US$ 20.5 billion were recorded in H1:2023-24 as against an outflow of US$ 8.1 billion during the same period last year. External commercial borrowing (ECB) flows also exhibited a turnaround, with net inflows at US$ 4.5 billion in 2023-24 (up to August) in comparison with net outflows of US$ 3.2 billion in the same period of last year, driven by higher disbursements. Net accretions to non-resident deposits inched up to US$ 3.0 billion during April-July 2023 from US$ 1.4 billion a year ago, mainly due to higher flows in Foreign Currency Non-Resident (FCNR-B) deposits. As on September 29, 2023, India’s foreign exchange reserves amounted to US$ 586.9 billion, equivalent to 10.1 months of projected merchandise imports in 2023-24 and 93.9 per cent of outstanding external debt at end-June 2023. Aggregate supply – measured by real gross value added (GVA) at basic prices – expanded by 7.8 per cent in Q1:2023-24 (11.9 per cent a year ago), led by services sector activity ( Table III.5). Moderating global energy and non-energy pricessupported value addition in both manufacturing andservices sectors. Petroleum product prices have an asymmetric impact on activity: the positive impactof easing prices is lower than the negative impactof an equivalent increase in prices (Box III.1).
The momentum of GVA was negative in Q1, reflecting the post-pandemic pattern (Chart III.18). III.2.1 Agriculture Real GVA in agriculture, forestry and fishing posted a growth of 3.5 per cent in Q1:2023-24 (2.4 per cent a year ago). The south-west monsoon (June-September 2023) remained uneven in terms of spatial and temporal rainfall distribution. After a sluggish start in June, the monsoon gained strength in July but lost momentum in August and rainfall deficiency for the month at 36 per cent touched a new record. The monsoon, however, recovered in September, which helped to narrow the cumulative rainfall deficit to 6 per cent below the long period average (LPA) (6 per cent above LPA a year ago), with 29 out of the 36 sub-divisions receiving normal or above normal rainfall (Chart III.19a and b). The area under kharif sowing during 2023-24 swas marginally higher than last year. Amongst the major crops, area under rice was 1.9 per cent higher while acreage under pulses and oilseeds was lower by 4.2 per cent and 1.6 per cent, respectively (Chart III.19c). As of September 29, 2023, the reservoir levels stood at 73 per cent of the full capacity — below the last year’s level of 89 per cent and the decadal average of 79 per cent (Chart III.19d). The production weighted rainfall (PRN) index was 93 as on September 30, 2023. The PRN for major crops was below normal except for cotton, pulses and oilseeds (Chart III.19e and f). 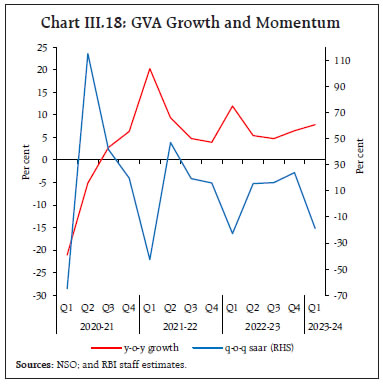 The government announced an increase of 5.3-10.4 per cent in minimum support prices (MSP) for kharif crops, ensuring a return of at least 50 per cent over the cost of production (as measured by A2 plus FL 7 ). The procurement of rice during the kharif marketing season 2022-23 ended at 570 lakh tonnes was 3.9 per cent lower than in the previous year. For wheat, on the other hand, the procurement at 262 lakh tonnes as on September 27, 2023 was 39.4 per cent higher than last year. As on September 16, 2023, buffer stocks of rice and wheat at 326.4 lakh tonnes and 252.2 lakh tonnes, respectively, were 2.4 times and 0.9 times respective buffer norms (Chart III.20a and b). 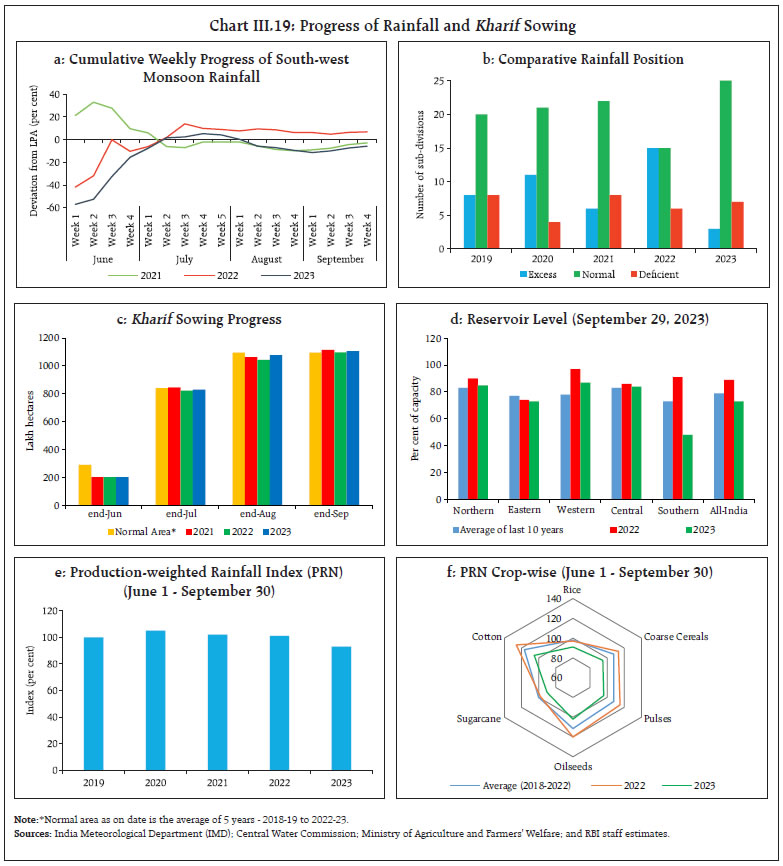 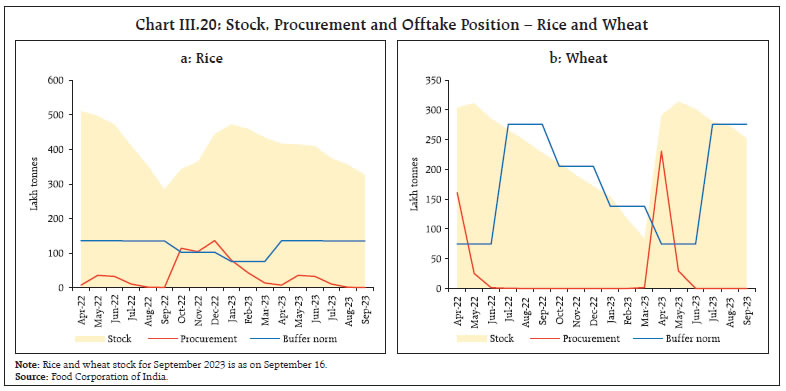 III.2.2 Industry Industrial GVA expanded by 4.6 per cent in Q1:2023-24 (7.3 per cent a year ago), driven by stronger manufacturing activity than a year ago, benefitting from easing input cost pressures and normalisation of supply chains (Chart III.21). The index of industrial production (IIP) posted a growth of 4.8 per cent y-o-y during April-July 2023 (9.2 per cent above the pre-pandemic level), supported by all its constituents – mining, manufacturing and electricity (Chart III.22 and Table III.6). Pharmaceuticals, basic metals, non-metallic mineral products, electrical equipment and motor vehicles were the main drivers of manufacturing activity. In terms of the use-based classification, the production of infrastructure and construction goods posted double digit growth, while that of consumer durables contracted. 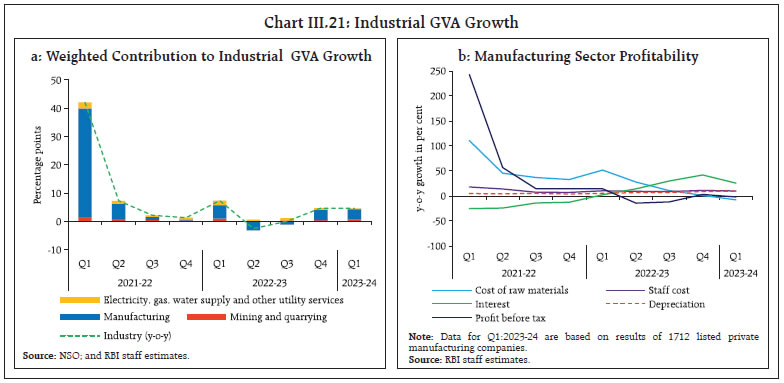 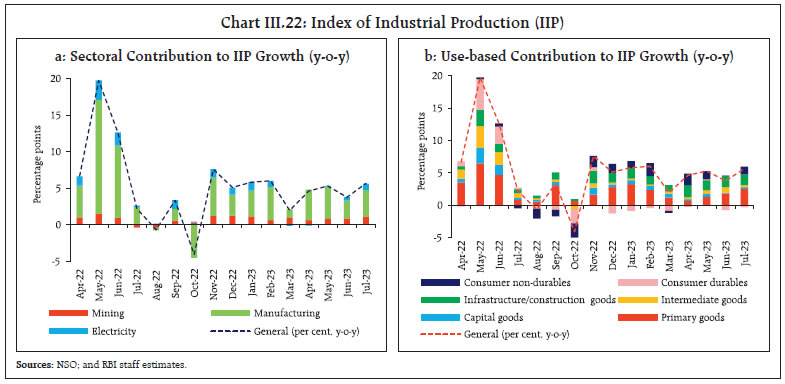 Electricity, gas, water supply and other utility services registered moderate growth, owing to lower household demand for electricity due to the relatively colder weather conditions during Q1. Electricity generation rose by 5.3 per cent y-o-y in April-August 2023 (10.6 per cent a year ago). Thermal and renewable sources recorded an increase of 6.3 per cent and 14.5 per cent, respectively, during April-August 2023 ( Chart III.23a). Region-wise, electricity demand remained strong in all regions except in the northern region. Demand in the northern region picked up in July-August ( Chart III.23b). 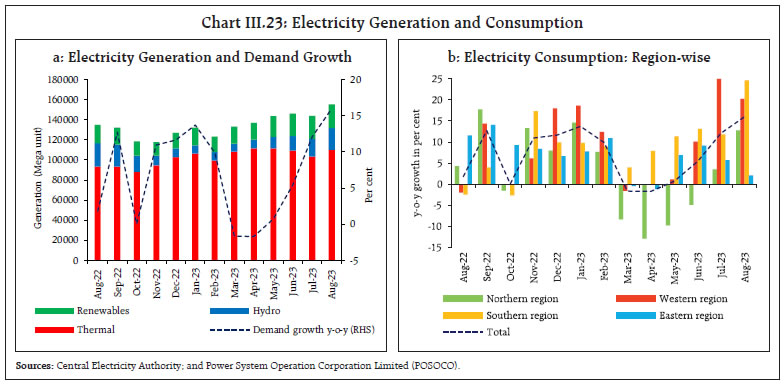 The manufacturing purchasing managers index (PMI) indicated improvement in overall business conditions. It rose to 57.9 in H1:2023-24 from 55.7 in Q4:2022-23, with pick up in domestic and export orders. The future output index also strengthened (Chart III.24a). 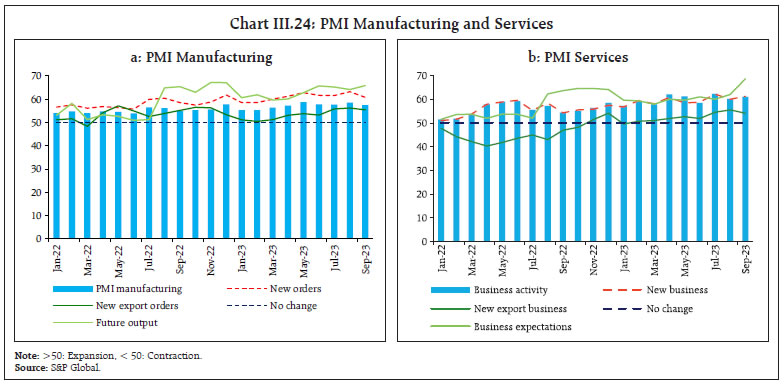 III.2.3 Services Services sector GVA recorded a robust growth of 10.0 per cent y-o-y in Q1:2023-24, exceeding the pre-pandemic level by 14.1.per cent. It was buoyed by sustained growth in contact-intensive services, financial services, real estate activities and revival in construction activity (Chart III.25a). Trade, hotels, transport, communication, and other services trailed the pre-pandemic level by 2.0 per cent. Residential housing demand and infrastructure spending by the government propelled a strengthening of construction activity. The traction in trade and transportation services continued in Q2, as reflected in high frequency indicators. GST collections and issuances of e-way bills – indicators of wholesale and retail trade – remained solid. Cement production and steel consumption reflected the improvement in construction activity (Chart III.25b). Domestic air passenger traffic expanded by 19.1 per cent in Q1 and by 24-26 per cent in July-August on the back of increased travel and business-related activities (Table III.7). High-speed diesel and toll collections point to a healthy growth in road transport in H1. Railway freight traffic and port cargo, after a muted growth of 1.1 per cent and 1.7 per cent, respectively, in Q1 made a smart recovery in Q2 especially in August. Real GVA growth in financial, real estate and professional services accelerated to 12.2 per cent in Q1:2023-24 from 8.5 per cent a year ago. Bank credit and deposits expanded by 15.3 per cent (y-o-y) and 12.3 per cent as on September 22, suggesting continued buoyancy in financial services. In the real estate sector, new launches and sales increased by 10.9 per cent and 8.4 per cent respectively on a y-o-y basis during Q1 and surpassed their pre-pandemic levels (Chart III.26a). According to the RBI’s all-India housing price index, housing prices increased by 5.1 per cent y-o-y in Q1, the highest in 19 quarters, led by Bengaluru, Delhi and Mumbai (Chart III.26b). Public administration, defence and other services (PADO) posted a robust growth of 7.9 per cent y-o-y in Q1 (21.3 per cent in Q1 of last year) primarily due to healthy growth in services like education, health, recreation and cultural services, which offset the muted growth in government consumption. 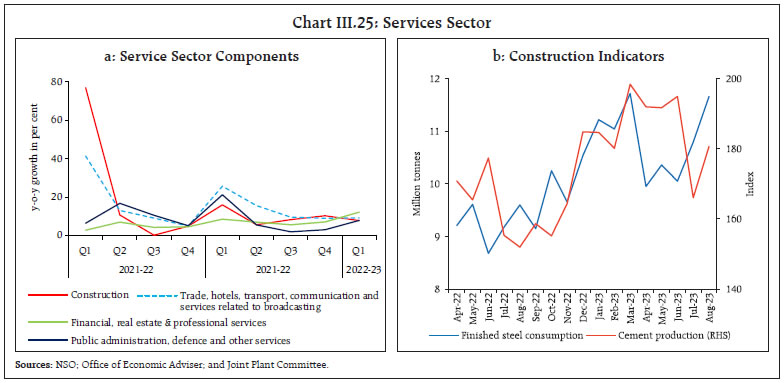 The services PMI strengthened to 60.6 in Q1:2023-24 and 61.1 in Q2 from 58.1 in Q4:2022-23, driven by demand and new business gains (Chart III.24b). The Composite PMI index inched up from 58.3 in Q4:2022-23 to 60.9 in Q1:2023-24 and further to 61.3 in Q2. 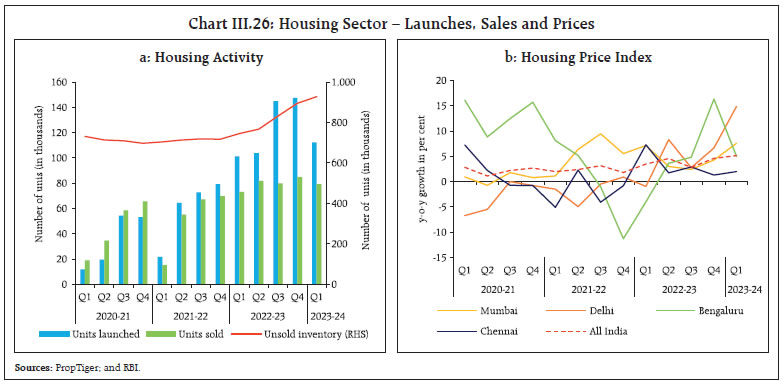 Domestic economic activity held up well in H1:2023-24, despite an accentuated drag from weak external demand. Private consumption improved across urban, and rural constituents. Investment activity drew strength mainly from government capex. Looking ahead, the sustained buoyancy in services, consumer and business optimism, government’s continued thrust on capex, healthy balance sheets of banks and corporates, and supply chain normalisation should support economic activity. Geopolitical tensions and geoeconomic fragmentation, volatility in global financial markets and energy prices, global economic slowdown and El Niño conditions pose risks to the domestic outlook. _________________________________________________________________ 1 Based on the Centre for Monitoring Indian Economy’s (CMIE) Consumer Pyramids data. 2 Based on RBI’s survey of order books, inventories and capacity utilisation. 3 Long term average is for the period Q1:2008-09 to Q1:2023-24 excluding Q1:2020-21. 4 The interest coverage ratio is the ratio of earnings before interest and taxes (EBIT) to interest expenses. 5 Growth was (-)7.3 per cent in Q1:2023-24 and 65.4 per cent in July-August 2023. The high July-August growth was partly due to base effect. 6 The share is based on April-August 2023. 7 A2 (out of pocket expenses) plus FL (family labour) includes all paid out costs such as expenses on hired labour, machines, rent paid for leased land, seeds, fertilisers, irrigation charges, depreciation as well as imputed value of family labour. IV. Financial Markets and Liquidity Conditions Domestic financial markets exhibited orderly movements and were range-bound during H1:2023-24. Bank lending and deposit rates increased, but the pass-through of the past rate hikes is still incomplete. Bank credit growth remained strong. Going forward, the Reserve Bank will conduct market operations to ensure financial stability while providing liquidity to meet the productive requirements of the economy. Introduction During H1:2023-24, global financial markets were volatile, reflecting heightened uncertainty around the trajectory of monetary policy. Sovereign bond yields firmed up with core inflation remaining sticky, tight labour markets and disinflationary resolve in monetary policy stances. Global equity markets gained during April-July 2023 on optimism about an early end to the tightening cycle, but they corrected subsequently on expectations of policy rates staying higher for longer. The US dollar remained volatile as it fell to a 15-month low in mid-July but recouped its losses subsequently. Swings in capital flows and tight global financial conditions posed challenges to macroeconomic and financial stability in emerging market economies (EMEs). IV.1 Domestic Financial Markets Domestic financial markets exhibited orderly movements. Money market rates were largely range bound while government bond yields eased from end-March 2023. The risk premium on corporate bonds moderated, equity market exhibited buoyancy and the INR underwent two-way movements. The transmission of cumulative policy rate changes led to a sustained firming up of bank deposit and lending rates. Growth in bank credit was robust, outpacing deposit expansion. IV.1.1 Money Market During H1:2023-24, money market rates oscillated within the policy corridor in tune with evolving liquidity conditions and market operations of the Reserve Bank (Chart IV.1a). On an average basis, the weighted average call money rate (WACR), the operating target of monetary policy, was 5 bps above the repo rate (Chart IV.1b). 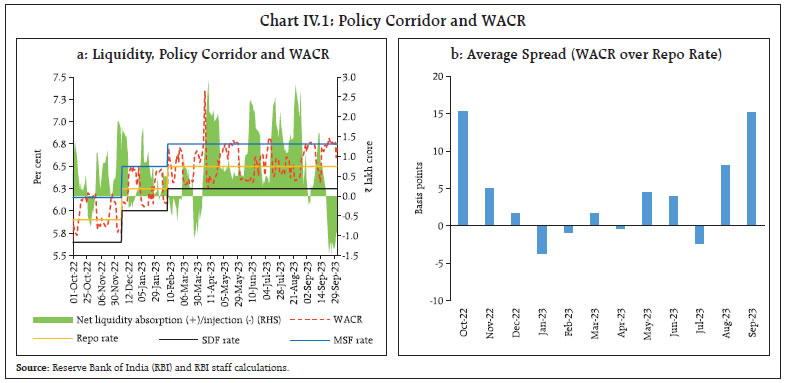 Other overnight money market rates viz., triparty repo (TREPS) and market repo moved in tandem with the WACR, which intermittently firmed up above the MSF rate – the ceiling of the LAF corridor – in August and September due to frictional liquidity tightness caused by advance tax payments, goods and services tax (GST) outflows and the incremental CRR (I-CRR) prescribed for all scheduled banks in August 2023. In the overnight call money segment, the weighted average rate (WAR) of traded deals 1 was 5 bps above the policy repo rate (on an average basis) while that of reported deals was 13 bps below during H1:2023- 24 (Chart IV.2a). The average monthly volume of traded deals (₹2.1 lakh crore) dominated the reported segment (₹0.1 lakh crore) due to the Reserve Bank’s directive to all eligible participants (including cooperative banks) to obtain NDS-CALL membership as well as the restoration of regular market hours in the call money market (Chart IV.2b). Consequently, the share of reported deals in the total call money market volume declined sharply from 33 per cent in September 2022 to less than 1 per cent in September 2023. Money market activity remained dominated by the collateralised segments, with the share of the uncollateralised call money market unchanged at 2.0 per cent in H1. The share of TREPS moderated to 64 per cent in H1 from 70 per cent in H2:2022-23, with a corresponding increase in the share of market repo to 34 per cent from 27 per cent (Chart IV.3). Among investors, mutual funds (MFs) remained the major lenders in the triparty repo segment (64 per cent share in H1 as compared with 67 per cent in H2:2022-23) as well as in the market repo segment (unchanged at 40 per cent). On the borrowing side, the share of public sector banks (PSBs) in TREPS and market repo declined to 50 per cent and 7 per cent, respectively, in H1 from 61 per cent and 15 per cent, respectively, in H2:2022-23. Among money market instruments, the yield on 3-month T-bills (TBs) was broadly aligned with the MSF rate in H1 while that on commercial paper (CP) and certificates of deposit (CDs) ruled above the MSF rate ( Chart IV.4). The spreads of TBs, CDs and CPs over the policy repo rate narrowed to 27 bps, 50 bps and 66 bps, respectively, in H1:2023-24 from 30 bps, 85 bps and 99 bps, respectively, in H2:2022-23. 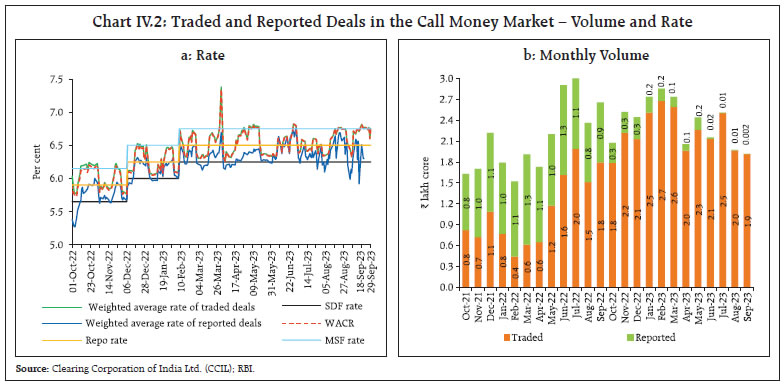 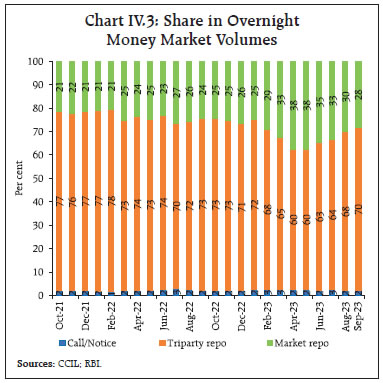 Fresh issuances of CDs moderated to ₹3.0 lakh crore in H1 (up to September 22) from ₹3.8 lakh crore in H2:2022-23 as deposit growth accelerated. Resource mobilisation through fresh issuances of CPs increased to ₹7.1 lakh crore during H1 from ₹6.4 lakh crore in H2:2022-23 (Chart IV.5a). The weighted average discount rate (WADR) of CP issuances declined to 7.15 per cent in H1:2023-24 from 7.21 per cent in H2:2022-23. Corporates remained the major issuers of CPs with a share of 39 per cent in H1 (Chart IV.5b). 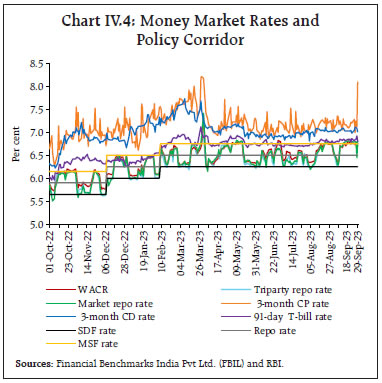 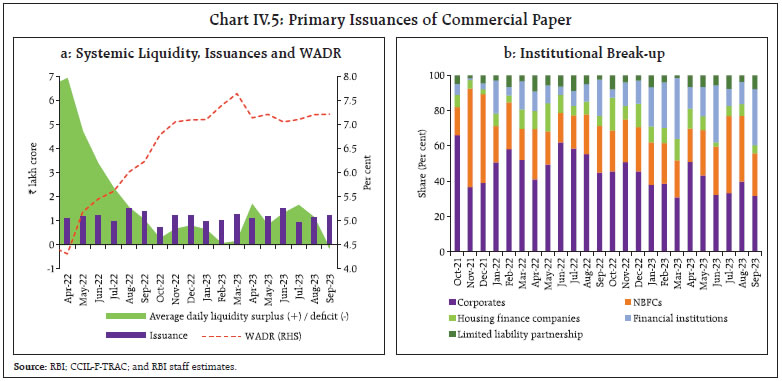 Among various maturity buckets, the 31-90 days segment had the largest share in fresh CP issuances [45 per cent in H1 as against 49 per cent in H2:2022- 23] (Table IV.1). IV.1.2 Government Securities (G-sec) Market During H1:2023-24, the 10-year G-sec yield softened by 9 bps reflecting domestic as well as global factors (Chart IV.6). Yields eased in April-May 2023 due to the MPC’s decision to pause, lower than expected domestic CPI inflation for March-April and softening US yields. In June, yields hardened taking cues from rise in US yields. Overall, the 10-year benchmark yield fell by 21 bps in Q1 to close at 7.10 per cent. In Q2, yields firmed up in July on the back of hardening US yields and crude oil prices but remained steady thereafter in August and September. On balance, yields rose by 12 bps to 7.22 per cent in Q2. 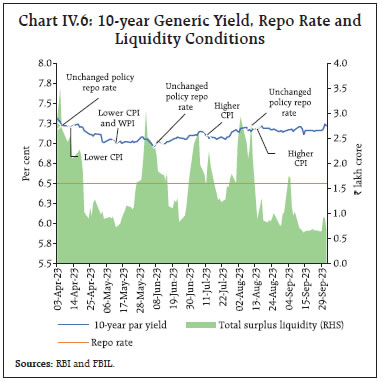 Yields on T-bills softened across tenors between end-March and end-September 2023, with market expectations remaining anchored on unchanged policy rates (Chart IV.7). The trading volume in G-secs and T-bills increased in H1:2023-24 vis-à-vis H2:2022-23 (Chart IV.8). Over the same period, the weighted average yield on traded G-secs declined by 20 bps while it increased by 15 bps for T-bills. 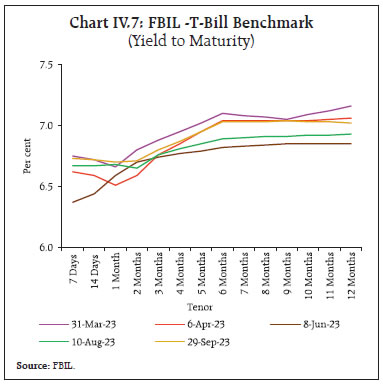 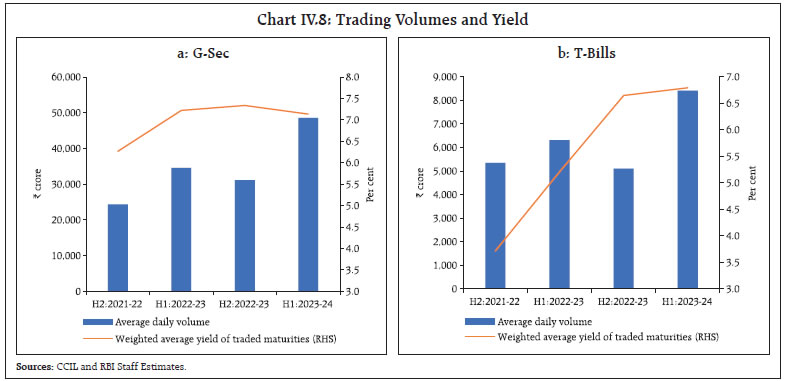 The overall dynamics of the yield curve are captured by its level, slope, and curvature 2 . During H1, the average level of yields softened by 2 bps while, the slope steepened by 8 bps. The curvature rose by 2 bps as yields in the mid-segment of the curve increased more than in the short and long segments ( Chart IV.9). In the Indian context, the level and curvature of the yield curve are found to have more information content on future macroeconomic outcomes than the slope, unlike in AEs. 3 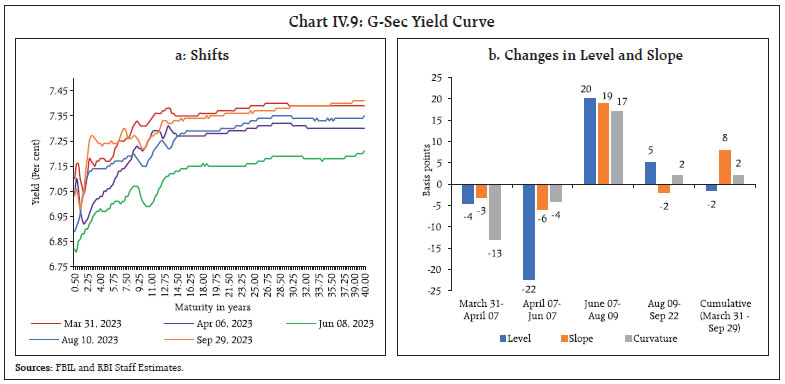 To facilitate debt consolidation, the Reserve Bank conducted six switch auctions on behalf of the Central Government amounting to ₹51,597 crore during H1. The weighted average maturity (WAM) of the outstanding stock of G-secs rose to 12.22 years at end- September 2023 from 11.94 years at end-March 2023. The weighted average coupon (WAC) at 7.28 per cent at end-September 2023 was marginally higher than 7.26 per cent as at end-March 2023. The weighted average spread of cut-off yields on state government securities (SGS) over the G-sec yields of comparable maturities was 24 bps in H1 (Chart IV.10). The average inter-state spread on securities of 10-year tenor (fresh issuances) was 1 bp in H1:2023-24 as against 4 bps in H2:2022-23. IV.1.3 Corporate Bond Market Corporate bond yields softened and spreads narrowed during H1:2023-24, mirroring G-sec yields. The average yield on AAA-rated 3-year bonds issued by non-banking financial companies (NBFCs) and corporates declined by 29 bps (to 7.83 per cent) and 24 bps (to 7.83 per cent), respectively, in September over March 2023. The average yield on issuances by public sector undertakings (PSUs), financial institutions (FIs) and banks softened by 10 bps to 7.65 per cent (Chart IV.11a). The risk premium (the spread over 3-year G-sec yields) moderated from 73 bps to 51 bps for NBFCs, from 68 bps to 51 bps for corporates and from 36 bps to 33 bps for PSUs, FIs and banks (Chart IV.11b). 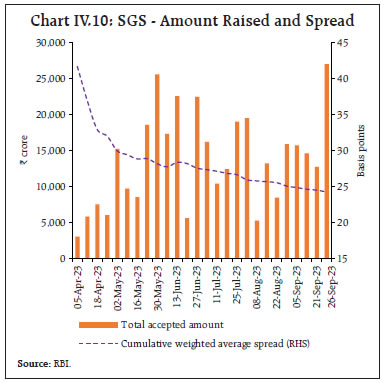 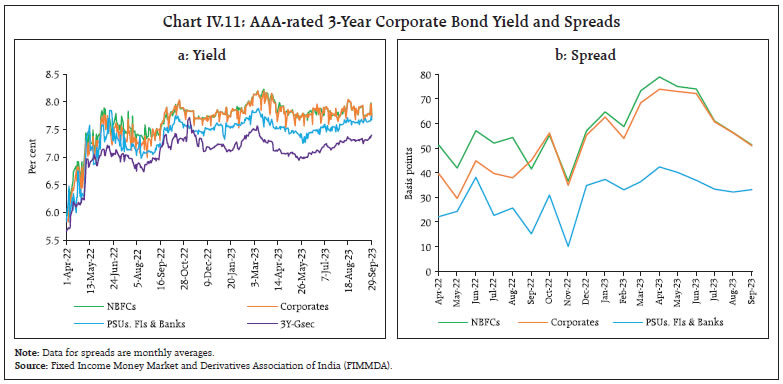 The reduction in risk premia was seen across tenors and the rating spectrum (Table IV.2). The average 3-year credit default swap (CDS) spreads for the State Bank of India’s paper trading overseas reduced by 26 bps while that of ICICI Bank moderated by 25 bps in H1:2023-24 over H2:2022-23. Primary issuances of corporate bonds rose during H1 (up to August 2023) to ₹3.4 lakh crore – substantially higher than ₹1.9 lakh crore during the corresponding period of 2022-23 – due to stable long term yields and cost advantage vis-a-vis bank loans (Chart IV.12a). Overseas issuances, however, remained muted. Almost the entire resource mobilisation in the corporate bond market (97.6 per cent) was through the private placement route (up to August 2023). Outstanding investments by foreign portfolio investors (FPIs) in corporate bonds decreased marginally to ₹1.03 lakh crore at end-September 2023 from ₹1.04 lakh crore at end-March 2023 with the utilisation of the approved limits declining from 15.5 per cent to 15.4 per cent (Chart IV.12b). Secondary market activity exhibited strong momentum, with daily average trading volume during H1 (up to August 2023) at ₹5,958 crore – 19.3 per cent higher than ₹4,994 crore in the corresponding period of the previous year (Chart IV.12c). 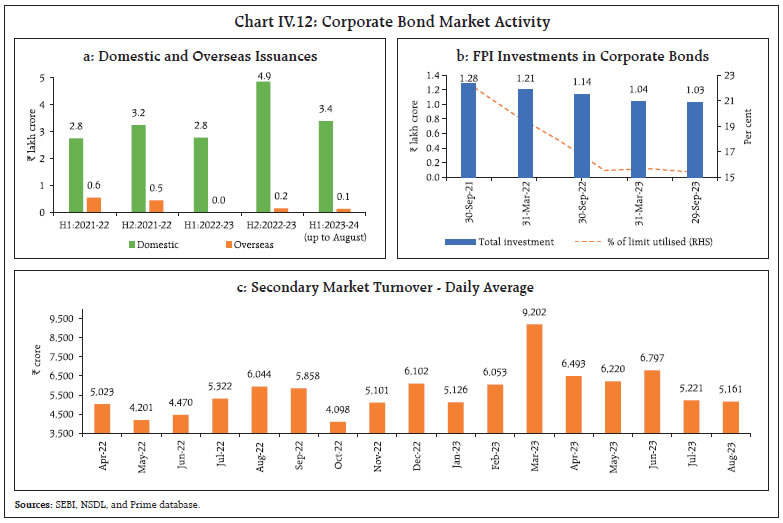 IV.1.4 Equity Market Domestic equity markets remained buoyant in H1:2023-24 due to strong buying support from foreign portfolio investors (FPIs), positive Q1 corporate earnings and a stable domestic economic outlook. From late July, however, markets reversed some of the earlier gains amidst weak global cues following the US sovereign rating downgrade and hawkish Fed monetary policy messages. The markets resumed upward momentum in September amidst optimism over moderating domestic inflation and positive industrial production data with the benchmark BSE Sensex closing at an all-time high of 67,839 on September 15, 2023. Thereafter, the US Fed's hawkish interest rate projections prompted some correction in equity prices. Overall, the BSE Sensex gained 11.6 per cent during H1 to close at 65,828. Equity market volatility was low, with the India VIX – which captures the short-term expected volatility of Nifty 50 – averaging 11.6 during H1 as compared with 15.1 in H2:2022-23 (Chart IV.13a). The Indian equity markets outperformed most EMEs and advanced economies (AEs) in H1 (Chart IV.13b). The 12-month trailing price-earnings ratio for the BSE Sensex at 23.0 as at end-September 2023 was around its 10-year average. Broader market indices outperformed the benchmark Sensex with the BSE MidCap and BSE SmallCap indices rising by 34.4 per cent and 39.3 per cent, respectively, during H1:2023-24. Foreign investors remained net buyers in equities in H1, with the flows touching a 10-month high in June 2023. In contrast, flows from domestic institutional investors (DIIs) were muted. Net purchases by DIIs and FPIs amounted to ₹0.39 lakh crore and ₹1.41 lakh crore, respectively in H1:2023-24 (Chart IV.14a). Despite an increase in the number of primary issuances, resource mobilisation in equity market declined to ₹0.51 lakh crore during H1 (up to August 2023) from ₹0.91 lakh crore in the corresponding period of the previous year (Chart IV.14b). 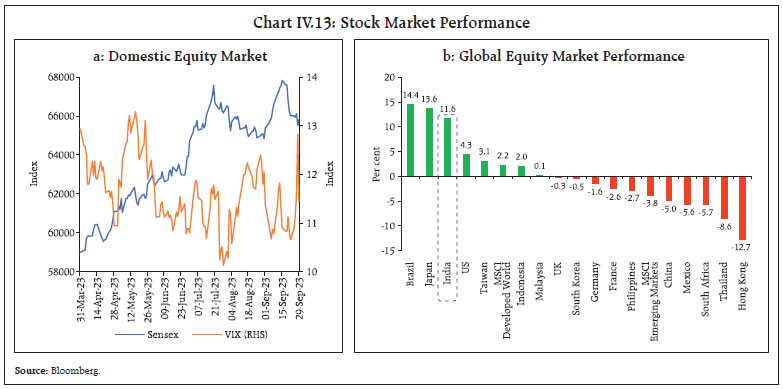 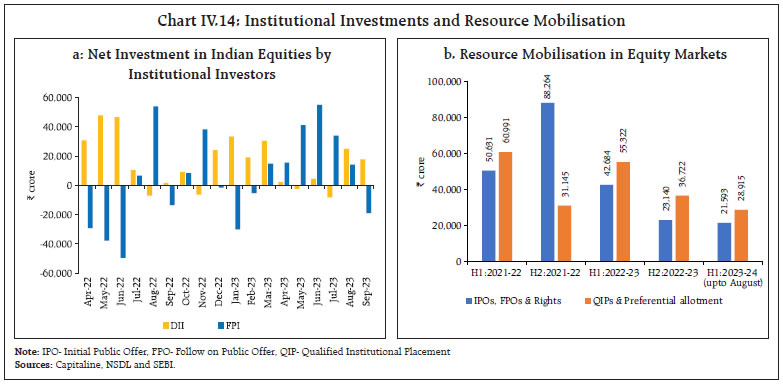 IV.1.5. Foreign Exchange Market The Indian rupee largely remained range-bound in H1:2023-24 (Chart IV.15a). It traded with an appreciating bias during April-July 2023, mainly on the back of stable macroeconomic fundamentals and revival in FPI flows. From August, the INR exhibited a depreciation bias, with the US dollar strengthening on the back of expectations about the US policy rate remaining higher for longer. The INR volatility – measured by the 1-month at the money (ATM) option implied volatility 4 – exhibited a declining tendency, averaging 3.6 per cent during H1, down from 5.3 per cent during H2:2022-23 (Chart IV.15b). 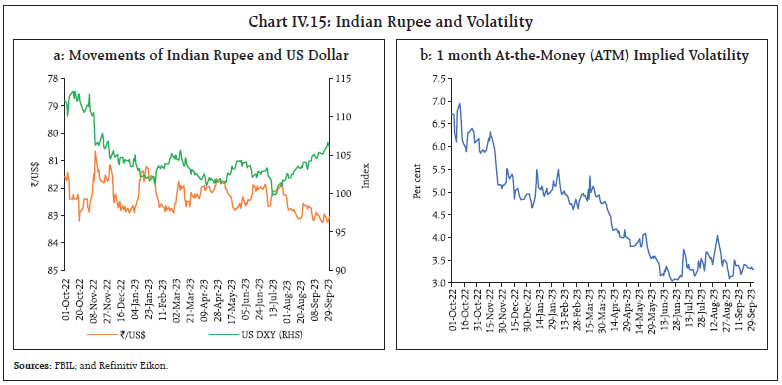 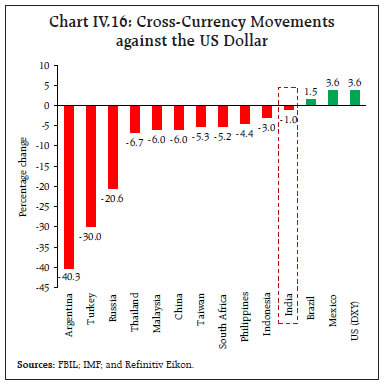 Between end-March and end-September 2023, the INR depreciated by 1.0 per cent against the US dollar although it outperformed many EME currencies like the Argentina Peso, the Turkish Lira, the Russian Ruble, the Thai Baht and the Malaysian Ringgit (Chart IV.16). In terms of the 40-currency real effective exchange rate, the INR appreciated by 5.4 per cent between March and end-September 2023 (Table IV.3). Forward premia eased across tenors during H1:2023- 24, driven by narrowing interest rate differentials. The 1-month forward premia declined to an average of 1.42 per cent in H1 from 2.38 per cent during H2:2022- 23 while the 12-month premia fell to 1.87 per cent from 2.25 per cent over the same period (Chart IV.17). IV.1.6 Credit Market 5 Bank credit6 growth remained strong in H1:2023-24 in tandem with economic activity. Non-food bank credit extended by scheduled commercial banks (SCBs) rose by 15.3 per cent (y-o-y) as on September 22, 2023 over and above a growth of 16.9 per cent a year ago ( Chart IV.18). 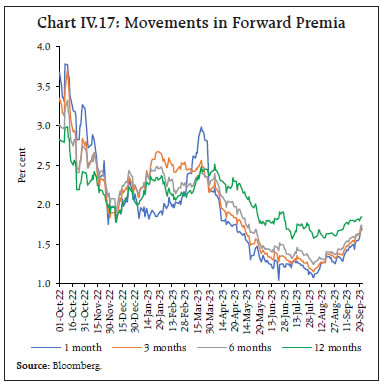 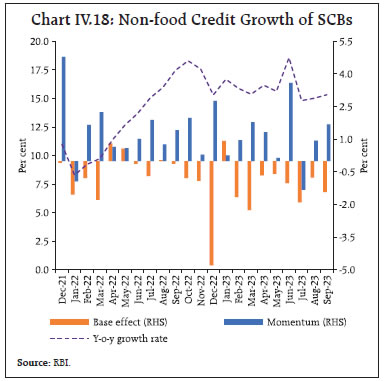 Credit growth remained higher for private sector banks (PVBs) (18.1 per cent as on September 22) vis-à-vis PSBs (14.4 per cent) (Chart IV.19a). PSBs were, however, the major driver of incremental bank credit (Chart IV.19b). Sector-wise, services and personal loans were the key avenues of bank credit deployment and their share in total incremental credit offtake rose in H1:2023-24 vis-à-vis the same period of the previous year. Personal loans and services credit contributed 37.7 per cent and 36.9 per cent, respectively, of incremental bank credit (y-o-y) in August 2023 (Chart IV.20). Bank lending to agriculture sector remained buoyant, with a growth of 16.6 per cent (y-o-y) in August 2023. Credit growth to industry decelerated to 6.1 per cent in August 2023, with flows to MSMEs (10.1 per cent) exceeding those to large industries (4.8 per cent). All the major industries, barring textiles and basic metals, experienced a slowdown in credit growth relative to August 2022. Credit growth to the infrastructure sector weakened, mainly due to decline in credit to the power and telecom sectors (Chart IV.21). 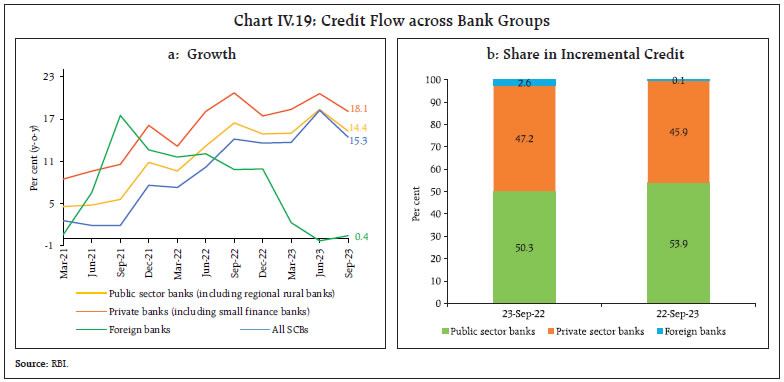 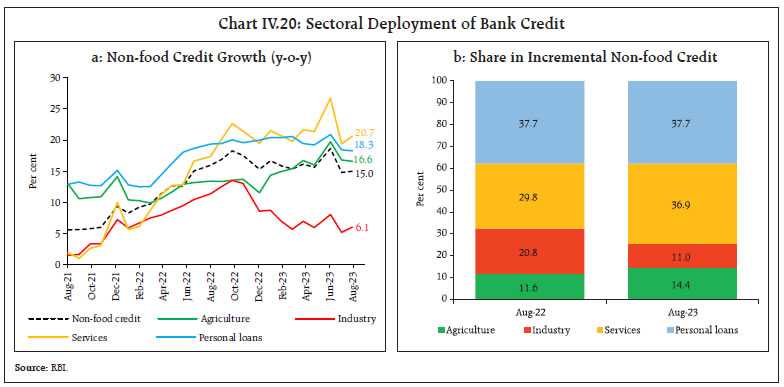 Services sector credit expanded by 20.7 per cent (y-o-y) in August, led by NBFCs. Within services, credit growth to commercial real estate and transport operators also improved ( Chart IV.22). 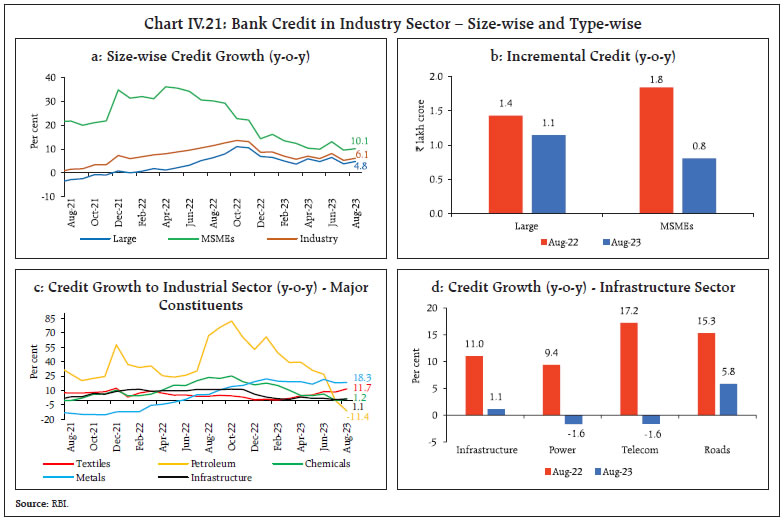 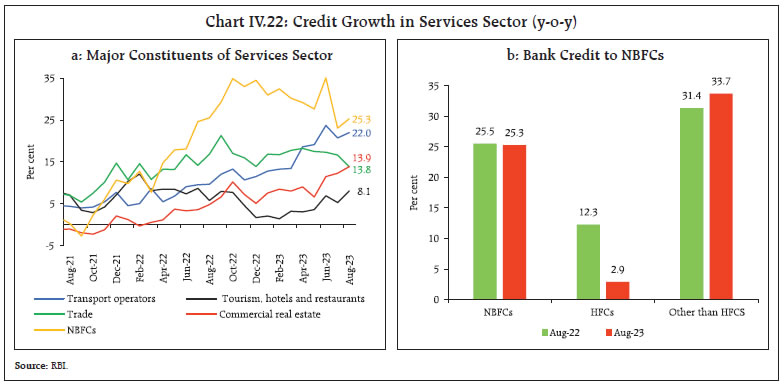 Retail loans rose by 18.3 per cent (y-o-y) in August and remained the prime contributor of overall credit growth. Credit to the housing sector recorded consistent double-digit expansion (13.8 per cent in August) while vehicle loan growth strengthened to 20.6 per cent. Credit card loans maintained high growth (30.0 per cent in August) reflecting inter alia the buoyancy in demand from contact-intensive services ( Chart IV.23). 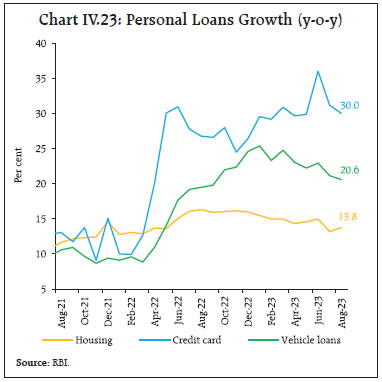 The composition of bank credit has witnessed substantial change over time, with an increasing proportion of credit now going to services and retail loans relative to industry ( Chart IV.24). Amidst these structural changes, the impact of bank credit on GDP growth appears to have strengthened (Box IV.1). 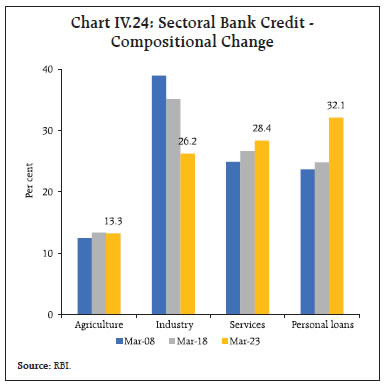
The asset quality of SCBs improved during H1:2023- 24, with the overall non-performing assets (NPA) ratio declining to 3.7 per cent in June 2023 from 5.7 per cent a year ago ( Chart IV.25a). Asset quality improved across all the major sectors over the same period (Chart IV.25b). Amidst sustained growth in bank credit, banks’ non-SLR investments (i.e., investments in CPs, and bonds, debentures and shares of public and private corporates) declined in H1:2023-24 as against an increase in H1:2022-23. The growth in adjusted non-food credit (i.e., non-food bank credit plus non-SLR investments) moderated to 14.4 per cent (y-o-y) as on September 22, 2023 from 15.1 per cent in the corresponding period of the previous year (Chart IV.26b). 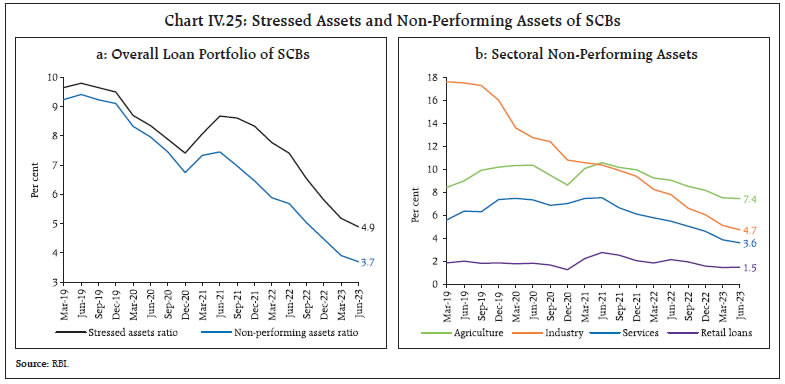 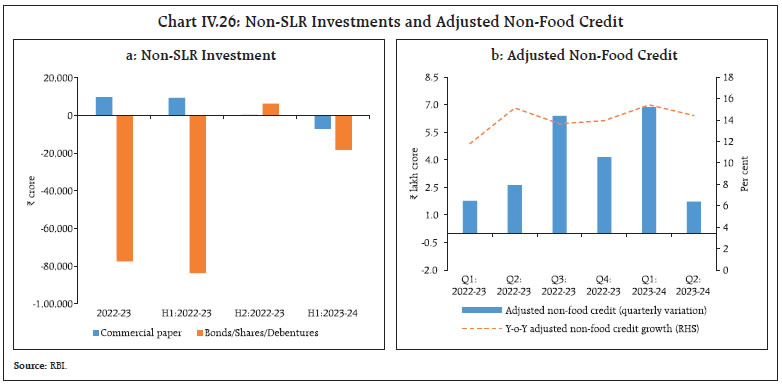 The excess holdings of statutory liquidity ratio (SLR) securities by banks was 8.8 per cent of their net demand and time liabilities (NDTL) as on August 25, 2023 as compared with 8.7 per cent at end-March 2023 ( Chart IV.27). Excess SLR holdings provide collateral buffers to banks for availing funds under the LAF and from collateralised markets. They are also a component of the liquidity coverage ratio. 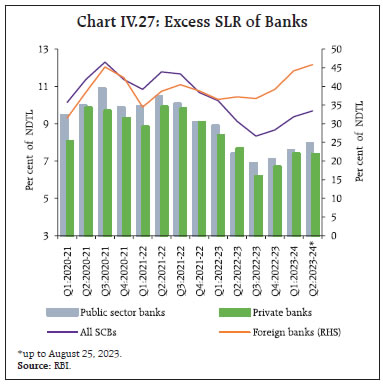 IV.2 Monetary Policy Transmission Bank lending and deposit rates rose further in H1:2023-24, reflecting the lagged impact of the policy rate hikes during May 2022-February 2023, the external benchmark-based lending rate (EBLR) system of loans pricing and the moderation of surplus liquidity. In response to the 250 bps increase in the policy repo rate since May 2022, the weighted average lending rates (WALRs) on fresh and outstanding rupee loans increased by 196 bps and 112 bps, respectively, during May 2022-August 2023. On the deposit side, the weighted average domestic term deposit rates (WADTDRs) on fresh and outstanding term deposits rose by 233 bps and 157 bps, respectively, over the same period. The transmission to outstanding term deposits during H1:2023-24 (up to August) at 44 bps outpaced transmission on the lending side (12 bps), with the repricing of an increasing proportion of term deposits at higher rates (Table IV.4). EBLR loans now dominate the floating rate loans. Their share increased from 44.0 per cent in March 2022 to 50.2 per cent in June 2023, while that of MCLR-linked loans declined from 48.6 per cent to 44.8 per cent during the same period (Chart IV.28). The increasing share of EBLR-linked loans with shorter reset periods and the increase in the MCLRs aided transmission to WALR on outstanding loans of SCBs. Bank-group wise, the proportion of EBLR-linked loans was the highest in the case of foreign banks (87.6 per cent), followed by PVBs (73.2 per cent) and PSBs (36.1 per cent). The transmission to WALR on fresh rupee loans during May 2022 to August 2023 was higher in the case of PSBs relative to PVBs, while transmission to lending rates on outstanding rupee loans was higher for PVBs ( Chart IV.29a). The lending rates of PVBs remained above those of PSBs (Chart IV.29b). The maximum transmission to lending and deposit rates was in the case of foreign banks, reflecting a higher share of low-cost and lower duration wholesale deposits in their total liabilities and a high share of EBLR-linked loans. 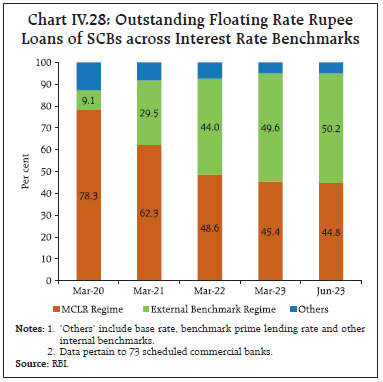 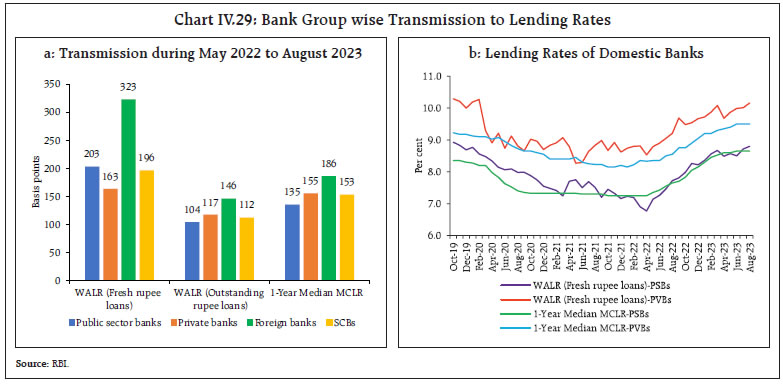 Sector-wise, the WALR on fresh rupee loans rose by 213 bps for large industry, 128 bps for MSMEs and 113 bps for housing loans (Chart IV.30a). For floating rate loans mandatorily linked to EBLR, the WALR on fresh loans rose by 173 bps for MSMEs loans, by 159 bps for vehicle loans, and by 127 bps for housing loans (Chart IV.30b). 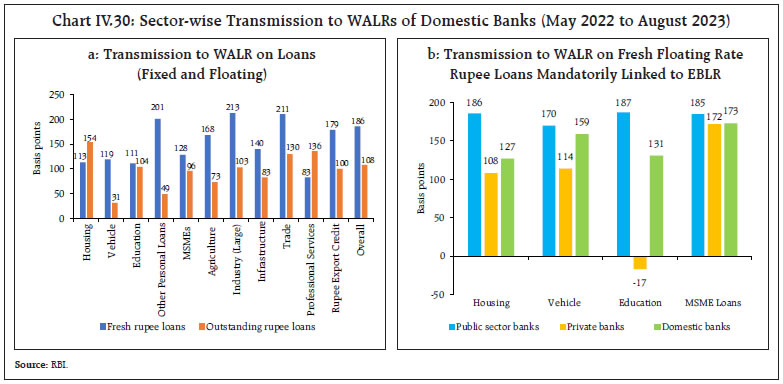 In the case of repo rate-linked loans, the spreads of WALR (fresh loans) over the policy repo rate narrowed, thereby moderating the transmission to actual lending rates on new loans ( Table IV.5). The WADTDR on fresh term deposits declined during H1:2023-24 while that on outstanding deposits rose with an increasing proportion of deposits getting renewed at higher deposit rates. Across bank groups, the transmission to WADTDR on fresh deposits was higher for PSBs as compared with PVBs. Across tenors, the maximum increase was observed for shorter maturities (up to 180 days) (Chart IV.31). While the increase in term deposit rates in the current tightening cycle has exceeded that in lending rates (both in terms of fresh and outstanding deposits/ loans), the savings deposit rates of banks – which are a third of total deposits – have remained almost unchanged, while current account balances (share of 9.6 per cent in total deposits) earn no interest. This has moderated the increase in the banks’ overall cost of funds and is mirrored in higher net interest margins (Chart IV.32). 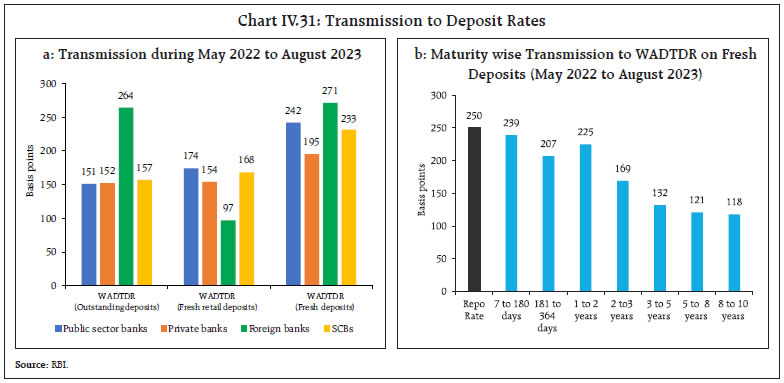 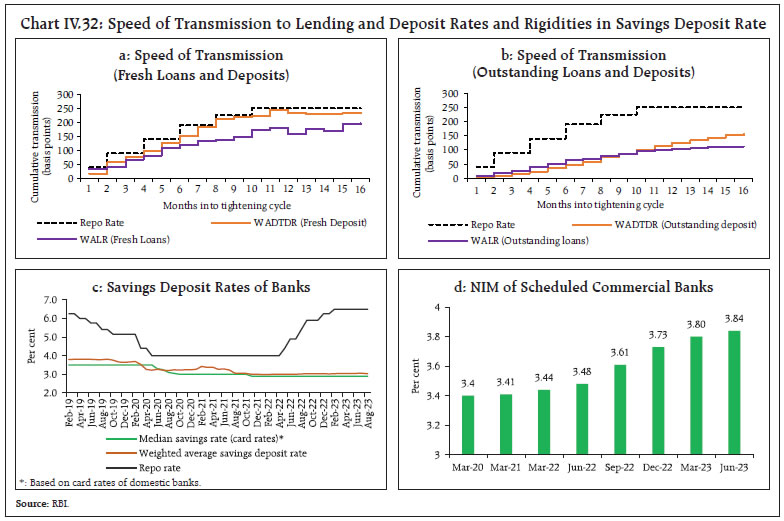 The Government of India (GOI) raised the interest rates on small savings instruments (SSIs), which are linked to secondary market yields on G-secs of comparable maturities, by 40-150 bps in five successive quarters beginning Q3:2022-23 (Chart IV.33). With these revisions, the actual interest rates on most SSIs are now better aligned with the formula-based rates ( Table IV.6). 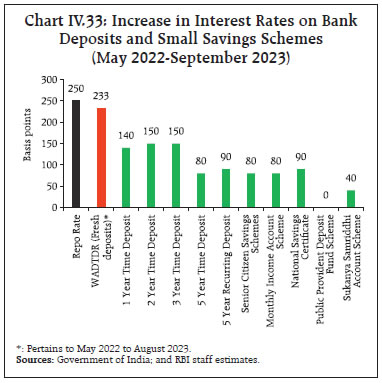 IV.3 Liquidity Conditions and the Operating Procedure The Reserve Bank of India (RBI) Act, 1934 requires the RBI to place the operating procedure relating to the implementation of monetary policy and changes thereto from time to time, if any, in the public domain. During H1:2023-24, the monetary policy committee (MPC) kept the policy repo rate unchanged at 6.5 per cent and continued with the stance of withdrawal of accommodation (see Chapter I). In consonance with the monetary policy stance, the increase in surplus liquidity (as discussed below) and the risks to price and financial stability from excess liquidity, the Reserve Bank imposed an incremental cash reserve ratio (I-CRR) of 10 per cent, effective from the fortnight beginning August 12, 2023, on the increase in NDTL of all scheduled banks between May 19 and July 28, 2023 7. It was indicated that the I-CRR would be reviewed on or before September 8, 2023 with a view to return the impounded funds to the banking system ahead of the festival season. On a review on September 8, the I-CRR was discontinued in a phased manner so that system liquidity is not subjected to sudden shocks and money markets function in an orderly manner: 25 per cent of the impounded I-CRR funds was released on September 9 and another 25 per cent on September 23 and the remaining 50 per cent are to be released on October 7. Drivers and Management of Liquidity During H1, liquidity conditions were impacted substantially by the return of currency to the banking system following the Reserve Bank’s decision on May 19 to withdraw ₹2,000 banknotes from circulation. In Q1, surplus liquidity shrank between April and mid-May with the seasonal expansion in currency in circulation (CiC) and the build-up of government cash balances. Between the third week of May and up to mid-June, liquidity conditions improved due to the (i) the return of ₹2,000 banknotes from circulation (Chart IV.34), (ii) an accelerated pace of Government spending before the onset of the monsoon season; and (iii) the Reserve Bank’s market operations. Advance tax payments and GST related outflows moderated surplus liquidity in the second half of June 2023. In Q2, liquidity surplus rose amidst the continued return of ₹2,000 banknotes, with the net average absorption under the LAF increasing from ₹0.8 lakh crore in May 2023 to ₹1.6 lakh crore in July. With the I-CRR coming into effect from August 12, system liquidity, although somewhat moderating, remained in surplus barring a few days. Thereafter, build-up of government cash balances due to advance tax collections and GST payments tightened liquidity conditions, particularly in the second half of September. Overall, net average absorption under the LAF at ₹1.1 lakh crore in H1 was higher than ₹0.4 lakh crore in H2:2022-23. Of the average total absorption of about ₹1.6 lakh crore in H1, ₹1.1 lakh crore (about 72 per cent) was through the standing deposit facility (SDF) while the remaining was mopped up through variable rate reverse repo (VRRR) operations – both main and fine-tuning – of various tenors. 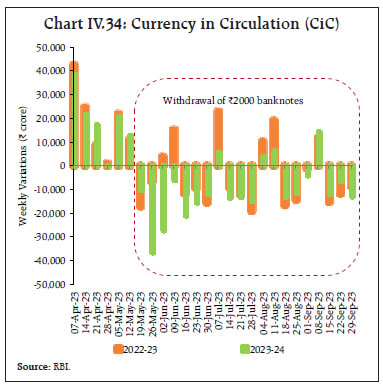 Overall, the build-up of government cash balances moderated surplus liquidity in H1 which was largely replenished by the return of currency to the banking system and the RBI’s market operations ( Table IV.7). In terms of liquidity management, absorptions under the LAF and increase in reserve requirements (through I-CRR) were the main instruments for mopping up the liquidity surplus. Borrowings under the MSF averaged ₹29,287 crore in H1, higher than ₹8,438 crore in H2:2022-23, peaking at ₹1.99 lakh crore on September 21. Net LAF (inclusive of MSF) slipped into deficit (injection mode) on August 21 for the first time in 2023-24 and remained so till August 23; therafter, it again turned into deficit mode from the second half of September. On a monthly basis, net LAF slipped into deficit in September 2023 - the first time since May 2019 - with an average daily net injection of ₹0.15 lakh crore. At the overall level, the deployment of large surplus funds under the SDF and simultaneous recourse to the MSF was symptomatic of skewed liquidity distribution within the banking system (Chart IV.35). The frictional liquidity conditions led to the WACR breaching the MSF rate on 18 occassions in H1:2023- 24 – six in May; three in June; five in August; and four in September with the average spread (over the MSF) on these days at 3 bps. 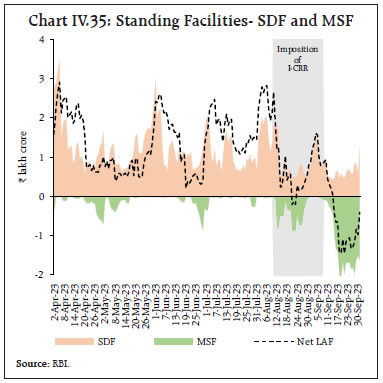 During H1:2023-24, the Reserve Bank’s liquidity management involved two-way operations. To assuage the liquidity tightness in the middle of May, a 14-day variable rate repo (VRR) auction (main operation) was conducted to inject liquidity amounting to ₹50,000 crore on May 19, 2023. Subsequently, however, with an improvement in liquidity conditions, a 14-day variable rate reverse repo (VRRR) auction (main operation) of ₹2.0 lakh crore was conducted on June 2 to absorb liquidity, followed by five fine tuning operations during June 5-13 of varying sizes – between ₹0.50 lakh crore to ₹1.0 lakh crore – with maturities between 2-4 days. To alleviate the liquidity stress caused by advance tax payments and GST outflows in the second half of June, a VRR fine tuning operation was conducted on June 19 injecting ₹75,004 crore into the banking system. With increased aversion among banks to park surplus funds for longer tenors, the Reserve Bank conducted six-fine tuning VRRR operations of 1-4 days maturity in July of size ₹1.0-2.0 lakh crore. Overall, 12 VRRR main operations and 11 VRRR fine tuning operations along with one VRR main operation and one VRR fine tuning operation were conducted in H1. The fine-tuning operations, on average, elicited better response from banks relative to the fortnightly 14-day main operations, with average bid-cover ratios of 0.46 and 0.35, respectively, in H1 (Chart IV.36). Banks need to hone their liquidity forecasting skills to efficiently assess liquidity requirements over the reserve maintenance cycle and bid accordingly in the main operation auctions, since fine tuning operations are neither a substitute of the main operation nor are they standing facilities – they are conducted at the discretion of the central bank as per operational requirements. Reserve money (RM) expanded by 6.4 per cent (y-o-y) as on September 29, 2023 as compared with 12.9 per cent a year ago (5.0 per cent adjusted for the first-round impact of the change in the CRR as against 10.3 per cent a year ago). Money supply (M3) increased by 10.8 per cent (y-o-y) as on September 22, 2023 as compared with 8.6 per cent in the corresponding period of the previous year (Table IV.8). 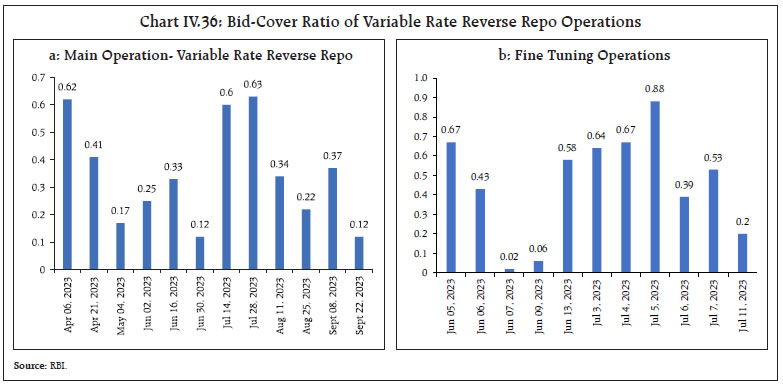 Domestic financial market conditions evolved in an orderly manner in H1:2023-24. Market rates, notwithstanding intermittent bouts of volatility, remained range-bound across segments, instruments, and the maturity spectrum. Bank credit offtake was sustained, supporting resilient economic activity. Bank lending and deposit rates exhibited a staggered but still incomplete adjustment to the past rate hikes. The INR remained broadly stable and outperformed several of its EME peers. The large liquidity accretion following the withdrawal of ₹2,000 banknotes from circulation was proactively managed by the Reserve Bank through multiple instruments. Going forward, the Reserve Bank will remain agile and nimble in conducting market operations to ensure financial stability while providing liquidity to meet the productive requirements of the economy. 1 ‘Traded deals’ are negotiated directly on the NDS-Call platform whereas ‘reported deals’ are over-the-counter (OTC) deals which are reported on the NDS-Call platform after the completion of negotiation of deals. 2 The level is the average of par yields of all tenors up to 30-years published by FBIL and the slope (term spread) is the difference in par yields of 3-months and 30-year maturities. The curvature is calculated as twice the 14-year yield minus the sum of 30-year and 3-month yields. 3 Patra, M.D., Joice, J., Kushwaha, K.M., and I. Bhattacharyya (2022), “What is the Yield Curve telling us about the Economy?”, Reserve Bank of India Bulletin, June. 4 Implied volatility is derived from an option’s price and depicts the markets’ expectations about the future volatility of the currency. 5 While overall bank credit and non-food credit data are based on Section-42 return (which covers all SCBs), sectoral non-food credit data are based on sector-wise and industry-wise bank credit (SIBC) return, which covers select banks accounting for about 93 per cent of total non-food credit extended by all SCBs. 6 Data on banking and select monetary aggregates exclude the impact of merger of a bank with a non-bank. 7 The existing cash reserve ratio (CRR), however, remained unchanged at 4.5 per cent. The global economy is slowing. Headline inflation remains above target in major economies, prompting central banks to persist with monetary tightening. Uncertainty about the monetary policy trajectory is imparting volatility to global financial markets. Stubborn core inflation, tightening financial conditions, high public debt, geopolitical tensions, geoeconomic fragmentation and extreme weather events pose downside risks to the global growth outlook. The global economy is slowing, with divergent growth trajectories across countries and sectors. Headline inflation is easing unevenly but it remains above targets in major economies, while core inflation (headline excluding food and energy) remains elevated. Major central banks have accordingly persisted with monetary tightening during April-September, albeit with some moderation in the pace. Financial markets remain unsettled, anticipating ‘higher for longer’ stances in the future conduct of monetary policy. Sovereign bond yields have firmed up while the US dollar is exhibiting sharp two-way movements since the April 2023 MPR. Global equity markets gained during April-July 2023 on optimism about an early end to monetary tightening but have corrected recently on expectations of more monetary policy actions. Risks to global growth prospects are tilted to the downside. V.1 Global Economic Conditions Global growth appears to have lost pace in the third quarter of 2023, dragged down by tight financial conditions, high inflation weighing on consumer spending, slowdown in the Chinese economy and renewed geopolitical hostilities. Lacklustre manufacturing and trade is holding back the revival, offsetting relatively robust services expansion. The International Monetary Fund (IMF) in its World Economic Outlook (WEO) update of July 2023 revised up the global growth projection for 2023 by 20 basis points (bps) to 3.0 per cent from its April projection of 2.8 per cent, with the projection for 2024 retained at 3.0 per cent. The global growth in 2023-2024 is expected to be sizeably below the 2022 outturn (3.5 per cent) and the historical average (2000 to 2019) of 3.8 per cent 1 . Amongst the advanced economies (AEs), the US economy grew by 2.1 per cent (quarter-on-quarter, seasonally adjusted annualised rates (q-o-q, saar)) in Q2:2023, similar to its Q1 outturn (2.2 per cent) ( Table V.1). This growth was driven by non-residential fixed investment, consumer spending, and government spending, though exports and residential fixed investment contracted. Tightness in the labour market persisted, with the unemployment rate at 3.8 per cent in August. The US composite S&P global purchasing managers’ index (PMI 2) at 50.2 in September 2023 signalled its weakest performance since February 2023. In the euro area, real GDP growth remained subdued at 0.5 per cent (q-o-q, saar) in Q2 (0.2 per cent in Q1) due to flat household consumption demand and contraction in exports. Services exhibited resilience, benefitting from strong demand for tourism and other leisure-related activities. The Eurozone composite PMI remained in contraction for the fourth consecutive month at 47.2 in September due to deteriorating demand and a sharp drop in new orders. The unemployment rate was 6.4 per cent in August 2023, broadly comparable with 6.5 per cent in March. The UK’s GDP grew by 0.8 per cent in Q2:2023 (q-o-q, saar) (1.3 per cent in Q1), supported by the extension of an energy price guarantee by the government to ease the cost of living, as well as fall in energy and commodity prices. The labour market remains tight, notwithstanding an increase in the unemployment rate to 4.3 per cent in May-July 2023, the highest since late-2021. The UK composite PMI at 48.5 in September was the weakest since January 2023 and signalled a reduction in private sector output amidst weak manufacturing activity. Japan’s GDP growth accelerated from 3.2 per cent in Q1:2023 (q-o-q, saar) to 4.8 per cent in Q2, led by car exports and inbound tourism benefiting from a weaker yen. The composite PMI (au Jibun Bank) remains in expansion since the beginning of 2023, though it declined from 52.9 in April 2023 to 52.1 in September. Amongst emerging market economies (EMEs), China’s real GDP moderated to 3.2 per cent (q-o-q, saar) in Q2 from 9.1 per cent in Q1. The upturn in economic activity following the reopening of the economy waned amidst weakened consumer spending, lower exports and the beleaguered real estate sector. The composite PMI (Caixin) slowed to a 9-month low at 50.9 in September, as both manufacturing and services PMIs moderated despite remaining in expansionary territory, with the latter falling more sharply. Chinese economy is projected by the IMF to grow by 5.2 per cent in 2023 and 4.5 per cent in 2024 (Table V.2). China undertook monetary easing and provided regulatory relaxation for its real estate sector to stimulate the economy. Amongst other major EMEs, Brazil’s GDP growth decelerated from 4.0 per cent (y-o-y) in Q1:2023 to 3.4 per cent in Q2. The labour market remained resilient albeit with some moderation. The composite PMI fell to a 29-month low of 49.0 in September from 50.6 in August amid contraction in both manufacturing and services sectors. The South African economy grew by 1.6 per cent (y-o-y) in Q2:2023 from 0.2 per cent in the previous quarter, with a rise in investment demand and government expenditure. The composite PMI for South Africa fell to 49.9 in September, indicating stagnation after expanding for the first time in six months in August. The Russian economy grew by 4.9 per cent (y-o-y) in Q2:2023 after four consecutive quarters of contraction, with a recovery in domestic demand. The composite PMI posted 54.7 in September, with upturns in manufacturing and services output. In ASEAN 3 economies, GDP growth was steady in Q2:2023, buoyed by tourism as inflation moderated. The ASEAN manufacturing PMI slipped into contraction territory for the first time in 25-months to 49.6 in September from 51.0 in August, driven by the downturn in factory orders and decline in new export business. Amongst high frequency indicators, the OECD composite leading indicators (CLIs) for September 2023 remained near its trend for several economies (Chart V.1a). The global composite PMI fell to 50.5 in September, its lowest reading since January as the services PMI moderated sequentially. The manufacturing PMI downturn continued, despite a marginal pick-up in September, as output, new orders and employment contracted (Chart V.1b). Global merchandise trade volume declined by 1.7 per cent (y-o-y) in Q2:2023 due to a slowdown in global economic activity, geopolitical tensions and geoeconomic fragmentation ( Chart V.2a). It fell by 3.2 per cent in July, marking its steepest contraction since August 2020. According to the WTO goods trade barometer, the export orders component remains weak. In its July 2023 WEO update, the IMF projected world trade (goods and services) growth to decelerate from 5.2 per cent in 2022 to 2.0 per cent in 2023. Reflecting the subdued global trade outlook, the Baltic Dry Index (BDI), a benchmark of shipping costs of dry bulk, trailed its 2022 average (Chart V.2b). 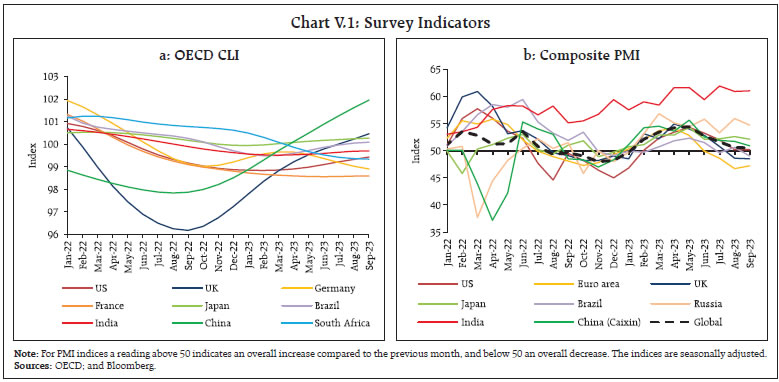 V.2 Commodity Prices and Inflation Global commodity prices declined by 4.2 per cent (q-o-q) in Q2:2023 in terms of the Bloomberg commodity price index before rising from July 2023 onwards on higher energy prices and the collapse of the Black Sea grain deal (Chart 3a). Global food prices, according to the Food and Agriculture Organization (FAO), eased by 3.2 per cent (q-o-q) in Q2:2023 and a further 1.7 per cent in Q3 (up to August), primarily driven by a correction in the prices of cereals and dairy products. Meat and sugar prices, which had hardened in Q2, softened in Q3, while vegetable oil prices reversed the easing in Q2 and rose in Q3 ( Chart V.3b). 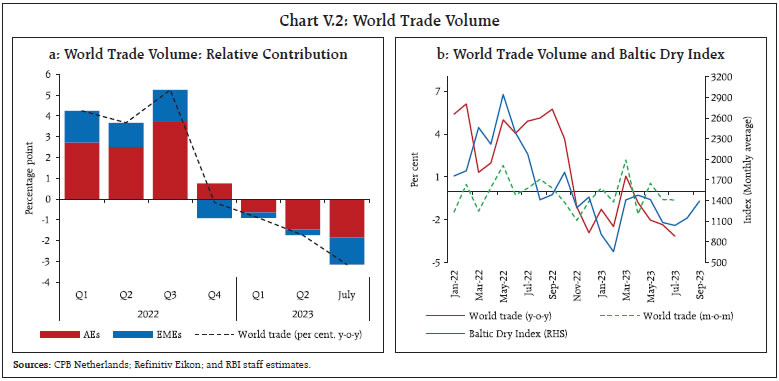 Crude oil prices have firmed up since the last MPR. They initially softened during Q2, largely reflecting weak global economic demand (Chart V.3c). Crude oil prices rose sharply in Q3 in response to cuts in oil supplies by Saudi Arabia and Russia that were extended through the rest of 2023. Brent crude prices crossed US$ 90 per barrel in September, touching their highest level since November 2022. According to the World Bank, natural gas prices softened by 28.4 per cent in Q2 because of high inventories as heating demand declined owing to a mild winter. The softening continued till July before prospects of a strike at a liquefied natural gas producer in Australia intensified fears of disruption to global supplies in August. Overall, natural gas prices edged up by 2.2 per cent in Q3 ( Chart V.3c). Base metal prices have generally remained stable since April 2023 in view of weak economic activity in China and sustained monetary tightening worldwide. Gold price rebounded in the first half of Q2 on safe haven demand amidst bank failures in the US and Europe. It fell in June as central banks’ purchases slowed down and retail demand for gold moderated. 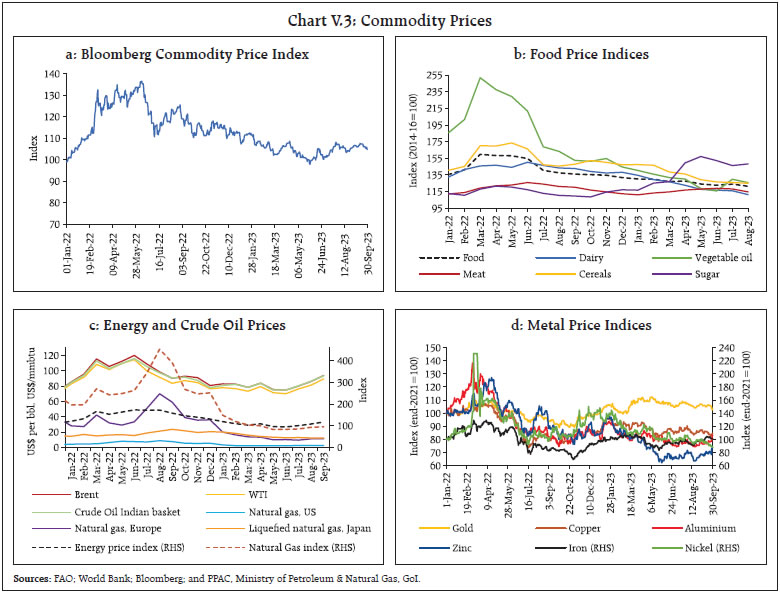 Gold price declined further in August as the US dollar strengthened. In September, most base metals prices hardened on Chinese stimulus measures to support the housing market through relaxation in requirements for mortgage down payments and interest rates (Chart V.3d). Consumer Price Inflation Consumer price inflation is easing, reflecting softening energy and food prices, improving supply chains and tighter monetary policy. It is, however, ruling well above targets, especially in AEs ( Table V.3). Core inflation is relatively sticky, and the pace of moderation is tardy (Box V.1). Core goods inflation eased as demand and supply for consumer goods moved into better balance. Services price inflation remains strong, contributing to wage pressures. According to the IMF’s WEO July 2023 update, global inflation is projected to moderate from an annual average of 8.7 per cent in 2022 to 6.8 per cent in 2023 and further to 5.2 per cent in 2024 but would remain above the pre-pandemic (2017-19) level of 3.5 per cent. In the US, headline CPI inflation decelerated from 5.0 per cent (y-o-y) in March 2023 to 3.0 per cent in June but then hardened to 3.7 per cent in August. Core CPI inflation eased from 5.6 per cent to 4.3 per cent during the same period. Inflation in terms of the personal consumption expenditure (PCE) price index – the US Federal Reserve (Fed)’s preferred measure of inflation – moderated from 4.4 per cent in March to 3.5 per cent in August (Chart V.4a), while core PCE inflation fell from 4.8 per cent to 3.9 per cent (Chart V.4b).
In the Euro area, CPI inflation eased by 260 bps to 4.3 per cent in September 2023 from 6.9 per cent in March. Core inflation (inflation excluding energy, food, alcohol and tobacco) moderated by only 120 bps to 4.5 per cent in September. In the UK, CPI inflation eased to 6.7 per cent in August 2023 from 10.1 per cent in March 2023 while core inflation at 6.2 per cent in August was unchanged from its level in March. In Japan, CPI inflation (all items less fresh food) was 3.1 per cent in August 2023, the same level as in March, though core inflation (inflation excluding fresh food and energy) edged up to 4.3 per cent in August from 3.8 per cent in March 2023. Amongst major EMEs, CPI inflation in Brazil moderated during March-June 2023 but then edged up to 4.6 per cent in August 2023 (Chart V.4c). In Russia, it rose to 5.2 per cent in August 2023 from 3.5 per cent in March, partly due to currency depreciation. 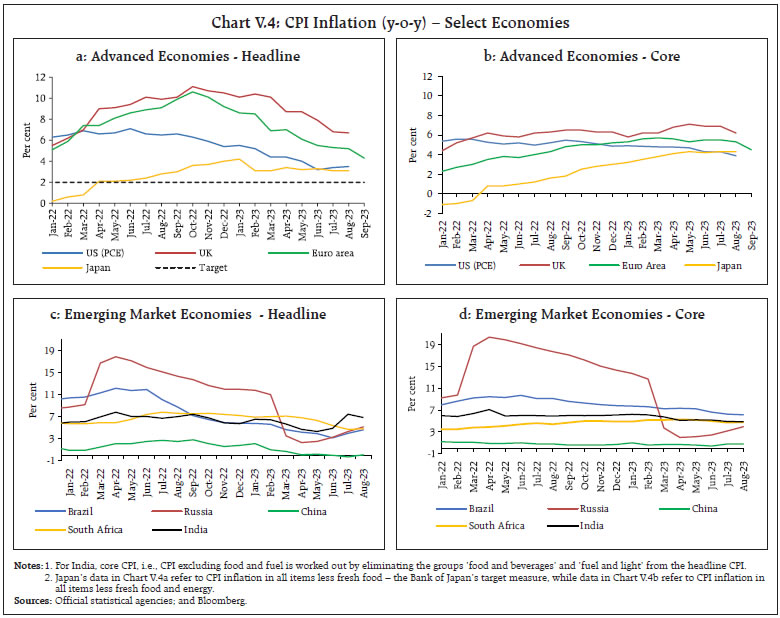 In South Africa, CPI inflation softened to 4.8 per cent in August 2023 from 7.1 per cent in March. In China, headline inflation remained subdued during 2023 – it moderated from 0.7 per cent in March 2023 to 0.1 per cent in August (with a temporary descent into deflation of 0.3 per cent in July), reflecting weak demand. Core inflation across EMEs has generally remained stickier than headline inflation ( Chart V.4d). During Q2 and Q3 of 2023, major central banks across AEs and EMEs hiked their benchmark rates in steps of 25 bps or retained their policy rates at restrictive levels. A few central banks especially among EMEs initiated an easing cycle in response to a softening inflation trajectory. After initiating the tightening cycle in March 2022, the US Fed raised the target range for the federal funds rate in all its subsequent policy meetings till May 2023 although it reduced the size of rate increase to 25 bps from hikes of 50 and 75 bps in 2022. In its June 2023 meeting, the Federal Open Market Committee (FOMC) decided to pause for the first time in over a year following a cumulative increase of 500 bps. In its July meeting, the Fed raised the target range of the federal funds rate by 25 bps to 5.25-5.50 per cent, taking it to its highest level in 22 years and maintained the level in its September meeting ( Chart V.5a). As per the Summary of Economic Projections released in September 2023, the majority of FOMC participants expected the federal funds rate to be in the range of 5.5-5.75 per cent by end 2023 and 5.0-5.25 per cent by end 2024, indicating further monetary tightening this year and fewer rate cuts next year as compared to June projections. The US Fed also continued with its balance sheet reduction policy. The ECB increased its policy rate by 25 bps in each of its May-September 2023 meetings, cumulatively increasing the benchmark rate by 450 bps. In its May 2023 meeting, it decided to discontinue reinvestments under the Asset Purchase Programme (APP) from July 2023 while continuing to reinvest the principal payments from maturing securities purchased under the Pandemic Emergency Purchase Programme (PEPP) until at least the end of 2024. In its July meeting, the ECB reduced the remuneration of minimum reserves to zero per cent (the remuneration was at the deposit facility rate earlier). The Bank of England (BoE) raised its policy rate in its May 2023 meeting by 25 bps, followed by 50 bps in June and 25 bps in August, taking the cumulative increase to 515 bps in the current tightening cycle that started in December 2021. The BoE maintained its policy rate at 5.25 per cent in its September meeting while announcing an enhanced reduction of £100 billion in the stock of UK government bonds. Amongst other major AEs, the Bank of Canada raised its policy rate by 25 bps each in its June and July 2023 meetings after a pause in the previous two meetings (March and April 2023) – a cumulative hike of 475 bps in the current tightening cycle. It kept the rate unchanged in its September 2023 meeting. The Reserve Bank of Australia raised its cash rate target by 25 bps each in its May and June meetings while pausing in the July-September meetings. It has cumulatively increased its policy rate by 400 bps since May 2022. The Norges Bank and the Bank of Korea have raised their policy rates by 375 bps and 250 bps, respectively, since 2022 while the Central Bank of Iceland and the Czech National Bank effected cumulative hikes of 725 bps and 325 bps, respectively (Chart V.5a). On the other hand, the Bank of Japan (BoJ) remained an outlier, maintaining an accommodative stance with the overnight interest rate on hold at minus 0.1 per cent. The BoJ in its July 2023 meeting, however, amended the conduct of yield curve control (YCC) to incorporate greater flexibility regarding the upper and lower bounds as references. It offered to purchase 10-year Japanese government bonds at 1.0 per cent every business day through fixed-rate purchase operations, instead of the previous 0.5 per cent. 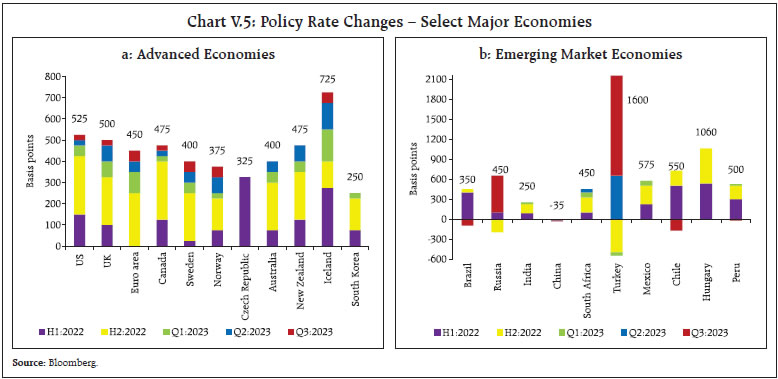 Amongst the BRICS, the Banco Central do Brasil started a rate cut cycle in August 2023 with a reduction of 50 bps after raising rates cumulatively by 1175 bps between March 2021 and August 2022. It was followed by another 50 bps cut in September 2023. The South African Reserve Bank continued with the tightening cycle and increased its policy rate by 50 bps in its May 2023 meeting, cumulatively increasing its benchmark rate by 475 bps before pausing in its July and September meetings. The People’s Bank of China (PBoC) adopted an accommodative monetary policy stance, effecting its first cut in 10 months in the policy rates in June 2023. In August, it further reduced its 1-year Loan Prime Rate (LPR) and 7-day reverse repurchase agreements rate by 10 bps each and the 1-year medium-term lending facility loans rate by 15 bps while maintaining the 5-year LPR at 4.20 per cent. In September it reduced its reserve requirement ratio by 25 bps for all banks except those that have implemented a 5 per cent reserve ratio. The Bank of Russia (BoR) switched gears by commencing a tightening cycle in July 2023, increasing the policy rate by 100 bps to contain price stability risks, following it by increases of 350 bps in an off-cycle meeting in August and 100 bps in the September meeting, taking the policy rate to 13.0 per cent. Earlier, it had cumulatively cut the policy rate by 1250 bps between April-September 2022 and held it steady for the next 6 meetings until June 2023 (Chart V.5b). Amongst Asian EMEs, the Bank of Thailand, which embarked on the tightening cycle in August 2022, raised the rate by 25 bps in all its subsequent meetings. The Bank Indonesia maintained its policy rate at 5.75 per cent in all its meetings since February 2023. In Latin America, central banks of Mexico and Colombia held their policy rates constant in all meetings since May 2023. On the other hand, Chile lowered its policy rate by 175 bps to 9.5 per cent during July-September 2023, after hiking it by 1075 bps between July 2021 and October 2022. Peru cut its policy rate by 25 bps in its September meeting after holding it steady for seven months. Among European EMEs, Poland embarked on a rate cutting cycle, lowering its policy rate by 75 bps in its September meeting after keeping it on hold since October 2022. The central bank of Turkey raised its policy rate by 2150 bps between June and September 2023, after cutting it cumulatively by 550 bps between August 2022 and February 2023. Global financial markets exhibited high flux during Q2 and Q3, responding to changing expectations on the monetary policy trajectory. Markets turned buoyant during April-July 2023 as prospects of hard landing receded and hopes of an end to the monetary tightening cycle in the US, earlier than expected, gained ground. Financial markets corrected in Q3 on stronger data and 'higher for longer' monetary policy stances. Overall, bond yields have firmed up since the last MPR. The US dollar has remained volatile with a strengthening bias since August. The EME currencies broadly weakened since Q2:2023. Equity markets, in terms of MSCI world index, gained 1.6 per cent since end March reflecting gains in AEs equity markets (Chart V.6a). Among AEs, US S&P 500 gained about 8 per cent in Q2:2023 supported by better economic data, optimism over the peaking of policy rates and a rally in technology stocks. In August and September, however, sentiment took a blow from the rise in long-term bond yields and the hawkish tone in minutes of the FOMC’s July meeting and FOMC's statement of September. Overall, the US S&P index rose by 4.3 per cent during April-September 2023. The European stock market underperformed, given relatively weak economic data. The UK’s stock indices declined in Q2 as consumer price inflation slowed less than anticipated, but reversed the trend in Q3 with lower than expected inflation print. The Japanese market outperformed its peers on continuation of ultra-accommodative monetary policy by the BoJ. EME equities, barring China and South Africa in Q2, gained, tracking global cues and reaping benefits of an early commencement of the tightening cycle leading to lower inflation prints (Chart V.6b). In Q3, however, EME equities barring Russia and India corrected on tighter financial conditions globally and volatile capital flows. Chinese stocks lost ground amidst the flagging economic recovery. Portfolio outflows exerted downward pressures on equities. 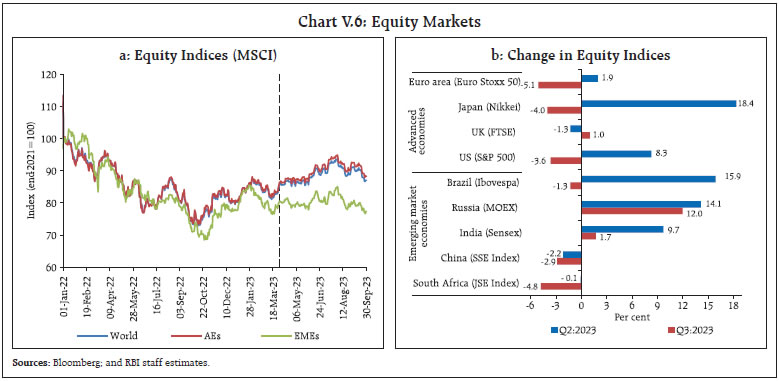 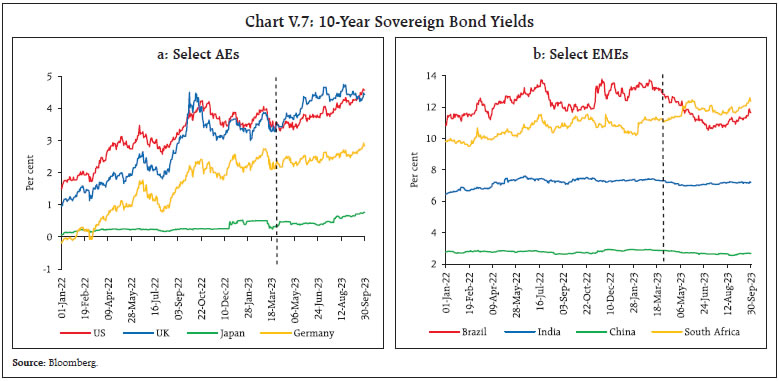 Sovereign bond yields across major AEs hardened in Q2:2023 and Q3, reflecting ongoing monetary tightening and the slow pace of disinflation. The US 10-year treasury yield rose by 37 bps during Q2 and rose further in Q3 to its highest level since 2007 following a hawkish policy stance, announcement of larger debt issuance by the US Treasury and the sovereign rating downgrade by Fitch Ratings. The German 10-year bond yield broadly tracked the US market while the UK 10-year yield hardened before moderating on a benign inflation print for July. The 10-year Japanese Government bond yield hardened by 36 bps during Q3 pushed up by the BoJ’s incorporation of greater flexibility in its conduct of yield curve control (Chart V.7a). Bond yields in several EMEs exhibited a hardening bias, driven by domestic monetary tightening as well as global cues (Chart V.7b). Brazilian 10-year bond yield softened in the second quarter of 2023 by 219 bps following modest inflation prints. In Q3:2023, Brazilian yield edged up marginally as investors reassessed the outlook on the Selic rate after July's CPI print exceeded the central bank's target of 3.25 per cent. In the currency markets, the US dollar weakened in April 2023 but strengthened in May on increased safe haven demand amidst debt ceiling concerns and uncertain global economic prospects ( Chart V.8a). It reversed the uptrend in June and July, falling to a 15-month low on optimism about a policy pivot by the Fed. Resilient US economic data and expectations of rates staying higher for longer led to a stronger dollar in August-September. The US dollar’s volatility was mirrored in the EME currencies, exacerbated by swings in capital flows (Chart V.8b). The MSCI Emerging Market Currency Index declined by around 1 per cent in Q2:2023 and by 0.4 per cent in Q3. 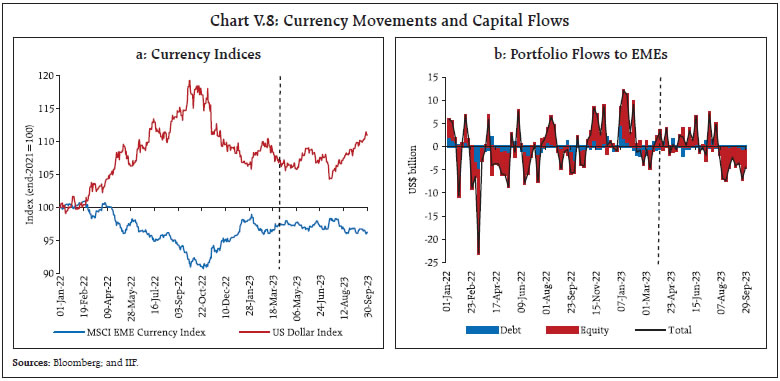 Global growth is losing momentum, with downside risks to the outlook from stubborn core inflation, tight financial conditions, high public debt, weak recovery in China, geopolitical tensions, geoeconomic fragmentation and extreme weather events. Inflation is easing unevenly across countries but rules above the target, especially in advanced economies. Core inflation is softening at a more moderate pace than the headline amidst strong labour markets. The uncertainty about the monetary policy trajectory is imparting volatility to global financial markets. Swings in capital flows, volatile currency movements, elevated debt burden and tight financial conditions pose sizeable downside risks to the outlook for EMEs, especially those with large external financing needs in an environment in which financial conditions are tightening. ___________________________________________________________________________________________________________ 1 The OECD in its Interim Economic Outlook (September 2023) revised up global growth forecast for 2023 to 3.0 per cent and revised it down to 2.7 per cent for 2024 from June 2023 projections of 2.7 per cent and 2.9 per cent, respectively. 2 The references to PMIs are to S&P Global indices, unless specified otherwise. 3 Association of Southeast Asian Nations (ASEAN) includes Brunei, Cambodia, Indonesia, Laos, Malaysia, Myanmar, Philippines, Singapore, Thailand and Vietnam. 4 The results are broadly similar for the full sample and the pre-COVID sample.
|
|||||||||||||||||||||||||||||||||||||||||||||||||||||||||||||||||||||||||||||||||||||||||||||||||||||||||||||||||||||||||||||||||||||||||||||||||||||||||||||||||||||||||||||||||||||||||||||||||||||||||||||||||||||||||||||||||||||||||||||||||||||||||||||||||||||||||||||||||||||||||||||||||||||||||||||||||||||||||||||||||||||||||||||||||||||||||||||||||||||||||||||||||||||||||||||||||||||||||||||||||||||||||||||||||||||||||||||||||||||||||||||||||
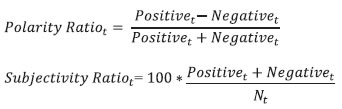

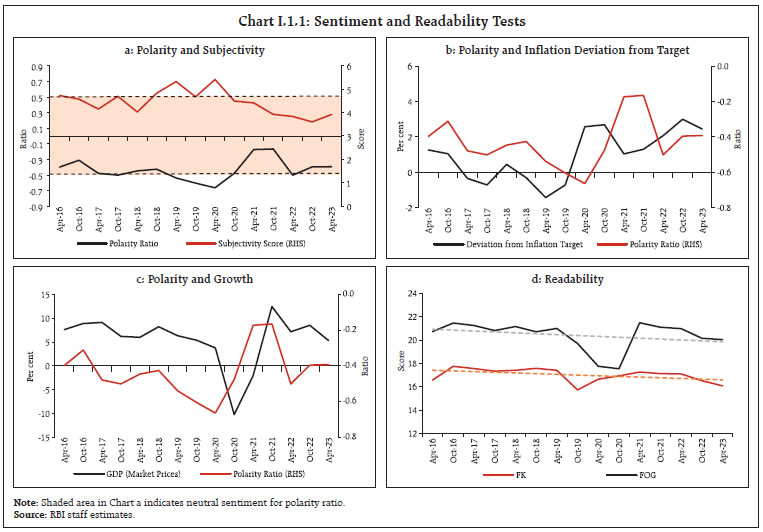

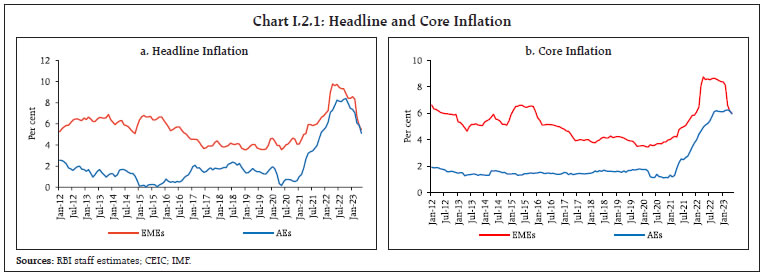
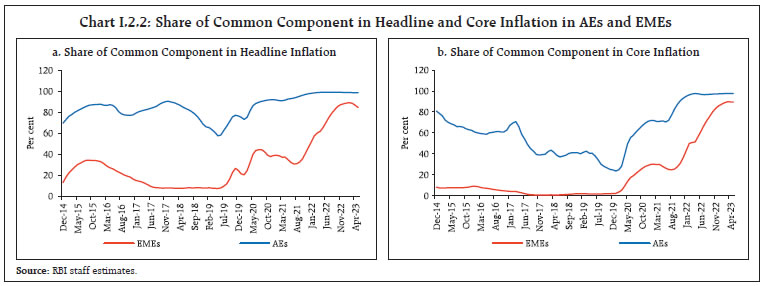
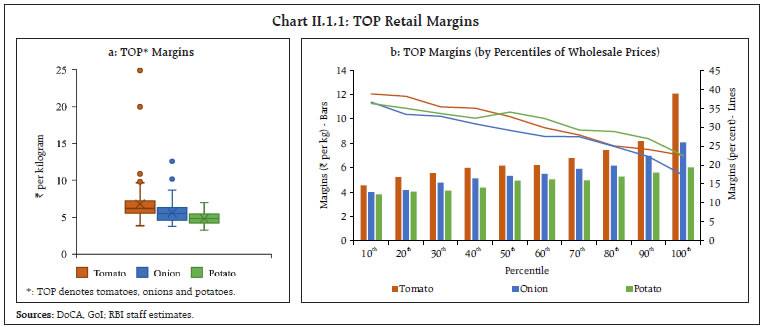

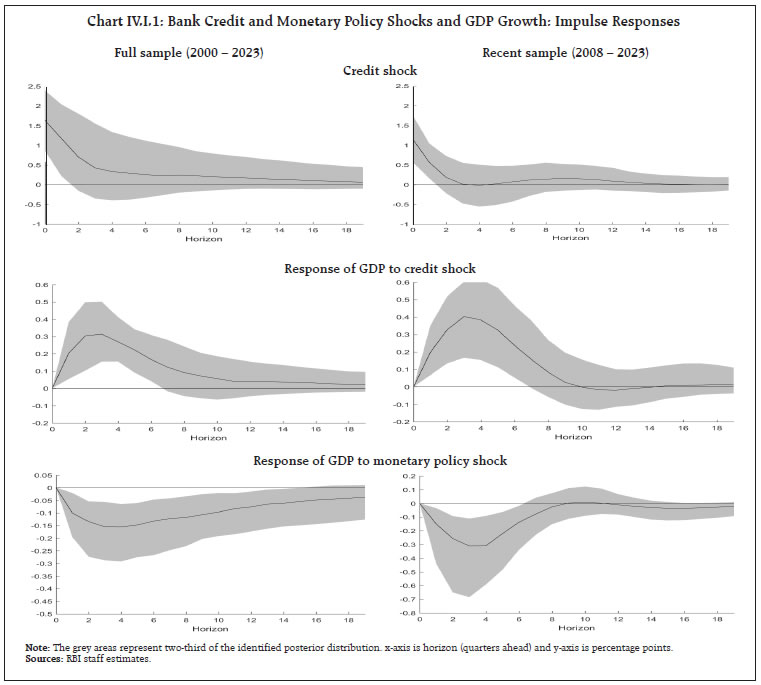
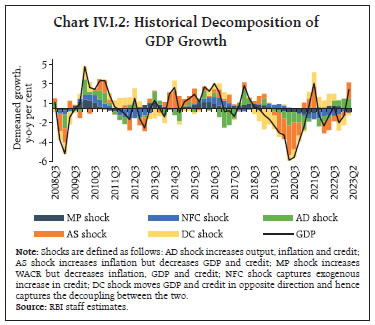

Share this page:


Install the RBI mobile application and get quick access to the latest news!
Scan the QR code to install our app


Page Last Updated on:


