Non-Banking Financial Institutions (NBFIs) play an important role in the Indian financial system given their unique postion of providing complimentarity and competitiveness to banks. On account of intensification of the global financial crisis in September 2008, some impact was experienced in the sector, thereby creating liquidity constraints for NBFIs. In response, the Reserve Bank introduced special fixed term rate Repo under liquidity adjustment facility (LAF) to banks exclusively for the purpose of meeting the funding requirements of Non-Banking Financial Companies (NBFCs). Besides, certain precautionary measures were taken by the Reserve Bank since October 2008 to enhance the availability of liquidity to NBFCs. These steps indirectly helped in dealing with the market pressure which had been building up. All India Financial Institutions (AIFIs) were extended refinance facilities of Rs.16,000 crore. Ceiling on aggregate resource mobilisation and umbrella limit were raised for EXIM Bank and NHB; select AIFIs were allowed to offer market related yield to maturity (YTM). Financial Institutions (FIs) exhibited robust performance in terms of assistance sanctioned and disbursements, balance sheet size and net profit. The weighted average cost of long term resources raised by AIFIs witnessed a mixed trend. Asset quality of FIs improved during the year vis-à-vis the previous year. Regulation of NBFIs in India was being progressively strengthened well before the onset of the global financial crisis. The Reserve Bank undertook regulatory and supervisory policy initiatives in terms of capital to risk weighted asset ratio (CRAR), exposure norms and classification of assets. While the balance sheet size of Primary Dealers (PDs) moderated during the period mainly on account of decline in secured loans and decline in Government securities, their financial indicators like net profit and return on average assets improved during 2008-09 vis-à-vis 2007-08.
1. Introduction
6.1 While the Indian financial system is dominated by banks, NBFIs play an important role by complementing banks in providing a wide range of financial services. Banks have an edge in providing payment and liquidity related services, while NBFIs tend to offer enhanced equity and risk based products. NBFIs are heterogeneous as a group, functionally as well as in terms of size and nature of activities. The major intermediaries that are included in the NBFI group are Development Finance Institutions (DFIs), insurance companies, non-banking financial companies (NBFCs), primary dealers (PDs) and capital market intermediaries such as mutual funds. The NBFIs are providing medium to long-term finance to different sectors of the economy.
6.2 In the wake of the recent global financial crisis and its fall out on the financial institutions (FIs), the Reserve Bank took a number of measures to preserve financial stability and arrest the moderation in the growth momentum. To ensure adequate availability of liquidity in the system and maintain conditions conducive for flow of credit to all productive purposes, particularly to the housing, export and industrial sectors, the Reserve Bank provided special refinance facilities to the Small Industries Development Bank of India (SIDBI),the National Housing Bank (NHB) and the Export-Import (EXIM) Bank of India in December 2008. The ceiling on aggregate resources mobilised by SIDBI, NHB and EXIM Bank, and the ‘umbrella limit’ for NHB and EXIM Bank were also raised. The Reserve Bank took policy initiatives for NBFCs also. As a measure aimed at expanding rupee liquidity, the Reserve Bank provided a special repo window under the LAF for NBFCs. In addition, an existing special purpose vehicle (SPV) was used as platform to provide liquidity support to NBFCs. In December 2008, systemically important non-deposit taking NBFCs (NBFCs-ND-SI) were permitted, as a temporary measure, to raise foreign currency short term borrowings under the approval route subject to certain conditions.
6.3 During 2008-09, the combined balance sheets of FIs, viz., National Bank for Agriculture and Rural Development (NABARD), SIDBI, NHB and EXIM Bank, continued to expand. The financial performance of FIs also improved. Net interest income as well as non-interest income of these FIs increased during 2008-09. The asset quality of the FIs improved as net non-performing assets (NPAs) to net loans ratio declined significantly during 2008-09. The NBFIs in the Indian financial system continued to be resilient as the Reserve Bank had taken various measures to minimise the adverse effects of the ongoing financial crisis on the system.
6.4 NBFCs have been competing with and complementing the services of commercial banks for a long time. The NBFCs as a whole account for 9.1 per cent of assets of the total financial system. The Committee on Financial Sector Assessment (CFSA), 2009 observed that NBFCs are largely compliant in areas relating to licensing, permissible activities, capital adequacy, risk management process, credit risk, problem assets, large exposures, supervisory approach, supervisory techniques and supervisory reporting. However, the assessment has revealed that there are certain gaps in areasrelating to home-host co-operation, transfer of significant ownership, major acquisitions, exposure to related parties, market, liquidity and operational risks, internal control and interest rate risk in the banking book. The CFSA’s recommendations in this regard will be looked into by the Reserve Bank.
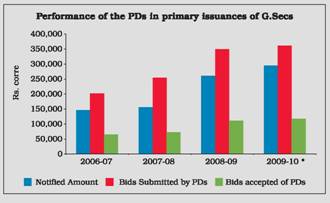
6.5 In order to strengthen the market infrastructure of Government securities market and make it vibrant, liquid and broad-based, the PDs system was introduced by the Reserve Bank in 1995. The PDs system is designed to facilitate Government’s market borrowing programme and improve the secondary market trading system by contributing to price discovery, enhancing liquidity and turnover, encouraging voluntary holding of Government securities amongst a wider investor base. The PDs system developed significantly over the years and currently it serves as an effective conduit for conducting open market operations. As of end-September 2009, there were 19 PDs, of which 11 were Bank-PDs and eight stand-alone PDs.
6.6 In this perspective, spread over five sections, this chapter analyses the performance of FIs in section 2. Section 3 explains the trends and developments relating to NBFCs and RNBCs. Activities and performance of PDs have been elaborated in section 4, followed by the conclusion in section 5.
2. Financial Institutions
6.7 Based on the major activity undertaken by FIs, they are classified into three broad categories. First, there exists the term-lending institution - EXIM Bank, whose main activity is direct lending by way of term loans and investments. Second, there are refinance institutions such as NABARD, SIDBI and NHB, which mainly extend refinance to banks as well as NBFIs. In the third category, there are investment institutions such as LIC, which deploy their assets largely in marketable securities. State/regional level institutions are a distinct group and comprise State Financial Corporations (SFCs), State Industrial and Development Corporations (SIDCs) and North Eastern Development Finance Corporation Ltd. (NEDFi). Some of these FIs have been notified as Public Financial Institutions by the Government of India under Section 4A of the Companies Act, 1956.
6.8 As on March 31, 2009, there were four FIs viz., EXIM Bank, NABARD, NHB and SIDBI which were under full-fledged regulation and supervision of the Reserve Bank. Industrial Investment Bank of India (IIBI), a financial institution with headquarter at Kolkata is in the process of voluntary winding up in view of its very poor financial position.
Regulatory Initiatives for Financial Institutions
6.9 In the wake of the emerging global
developments and their fall out on financial
institutions, the Reserve Bank received requests
from select FIs for liquidity support for on-lending
to HFCs/NBFCs/MFIs and exporters, and
accordingly, took a number of measures as follows:
Refinance Facility to SIDBI, EXIM Bank and NHB
6.10 As a measure to encourage flow of credit
to sectors, which were coming under pressure
due to the ongoing global financial crisis, in
December 2008, the Reserve Bank provided
refinance facilities of Rs.7,000 crore, Rs.5,000
crore and Rs.4,000 crore for SIDBI, EXIM Bank
and NHB, respectively, under the relevant
provisions of the Reserve Bank of India Act,
1934. The availment of refinance by the above
FIs under this facility is restricted to a period
of 90 days and the amount could be flexibly drawn and repaid during the period. The facility
could be rolled over and would be available up
to March 31, 2010. Advances under this facility
are charged at the repo rate under the LAF of
the Reserve Bank. The funds provided under
the refinance facility should be utilised as per
the policy approved by the Board of therespective financial institutions, and in adherence to the extant exposure norms for these entities. To facilitate monitoring, the financial institutions are required to submit a weekly report on the utilisation of the refinance facility to the Reserve Bank. The amount outstanding under the special refinance facility remained small up to February 2009 for each institution, but picked up in the subsequent months. The utilisation of refinance facility as at end-June 2009 is indicated in Table VI.1.
Ceiling on Aggregate Resources Mobilised by SIDBI, NHB and EXIM Bank
6.11 The ceiling on aggregate resources mobilised was raised to 12 times of the net owned funds (NOF) for SIDBI and NHB and 13 times of NOF for EXIM Bank with effect from December 8, 2008 for a period of one year from the existing norm of 10 times of NOF as per the last balance
sheet, subject to meeting CRAR requirements.
Umbrella Limit for EXIM Bank and NHB
6.12 The ‘umbrella limit’ for FIs which consists of aggregate borrowings through five specified instruments, viz., term deposits, term money borrowings, certificates of deposits (CDs), commercial papers (CPs) and inter-corporate deposits (ICDs) should not at any time exceed 100 per cent of their NOF as per its latest audited balance sheet. The umbrella limit was raised to 200 per cent of NOF for one year with effect from December 8, 2008 for EXIM Bank and January 15, 2009 for NHB, subject to review and subject to Asset Liability Management (ALM) guidelines of the Reserve Bank.
Table VI.1: Utilisation of Refinance Facilities | (Amount in Rs. crore) | AIFIs | Refinance Sanc
tioned | Cumulative Amount drawn up to June 26, 2009 | Cumulative Amount Disbursed up to June 26, 2009 | No. of Benefi
ciaries | 1 | 2 | 3 | 4 | 5 | SIDBI | 7,000 | 5,684 | 4,971 | 33* | | | | 988 | 1,043 | 22** | | | | 7,747 | 1,841 | 5,179 | EXIM Bank | 5,000 | 3,000 | 3,478 | 35 | NHB | 4,000 | 3,979 | 3,979 | 14# | Total | 16,000 | 21,398 | 15,312 | 5,283 | * : State Finance Corporations (SFCs) and banks.
** : Non-banking Finance Companies (NBFCs).
# : Housing Finance Companies (HFCs). |
Select AIFIs Allowed to Offer Market-related Yield to Maturity
6.13 While issuing bonds/debentures, the select
FIs viz., SIDBI, NHB, EXIM Bank and NABARD
can offer market related YTM. Accordingly, the
current stipulation that the yield to maturity
offered at the time of issue of bonds should not
exceed 200 basis points above the YTM on the
Government of India securities of equal residual
maturities would not apply with effect from
December 8, 2008 for a period of one year.
Prudential Guidelines on Treatment of Restructuring of Advances of Select AIFIs
6.14 The guidelines regarding treatment of
restructuring of advances issued to banks have
been mutatis mutandis applied to the select FIs.
Provisions relating to certain activities generally
not undertaken by FIs, such as extending
working capital, overdrafts and personal loans
would, however, not be applicable to them.
Operations of Financial Institutions
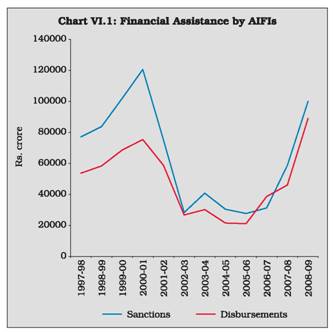
6.15 Financial assistance sanctioned and disbursed by FIs sharply increased during 2008-09 as compared to that in the previous year. A major part of the increase in financial sanctions and disbursements was accounted for mainly by investment institutions (especially LIC) followed by the term lending institutions (Table VI.2 and Appendix Table VI.1).
6.16 During 2008-09, though there was increase in both financial assistance sanctioned and disbursed by FIs, the increase in disbursements (93.3 per cent) was more pronounced than the sanctions (70.2 per cent) (Table VI.2) (Chart VI.1).
Assets and Liabilities of FIs
6.17 The combined balance sheets of select FIs (NABARD, NHB, SIDBI and EXIM Bank) during 2008-09 expanded sharply by 20.8 per cent over the previous year. On the liabilities side, the resources raised by way of bonds and debentures declined by 9.3 per cent during 2008-09. However, deposits and borrowings registered sharp increases of 80.7 per cent and 20.0 per cent, respectively. On the asset side, loans and advances continued to expand by 21.5 per cent and investment portfolio also recorded an increase of 21.8 per cent. Cash and bank balances and other assets registered an increase of 22.7 per cent and 8.8 per cent, respectively. Within liability, the share of deposits increased from 20.2 per cent to 30.2 per cent while other items showed a marginal to moderate decline. Composition of assets remain roughly unchanged during 2008-09 as that of 2007-08 (Table VI.3).
Table VI.2: Financial Assistance Sanctioned and Disbursed by Financial Institutions | (Amount in Rs. crore) | Category | Amount | Percentage Variation | 2007-08 | 2008-09 | 2008-09 | S | D | S | D | S | D | 1 | 2 | 3 | 4 | 5 | 6 | 7 | (i) | All-India Term-Institutions* | 18,696 | 17,379 | 33,660 | 31,604 | 80.0 | 81.9 | (ii) | Specialised Financial Institutions# | 366 | 189 | 597 | 283 | 63.1 | 49.7 | (iii) | Investment Institutions@ | 39,670 | 28,460 | 65,731 | 57,086 | 65.7 | 100.6 | Total Assistance by FIs (i+ii+iii) | 58,732 | 46,028 | 99,988 | 88,973 | 70.2 | 93.3 | S : Sanctions. D : Disbursements.
* : Relating to IFCI, SIDBI and IIBI.
# : Relating to IVCF, ICICI Venture and TFCI.
@ : Relating to LIC and GIC & erstwhile subsidiaries (NIA,UIIC & OIC).
Note : All data are provisional.
Source : Respective Financial Institutions. |
Resources Mobilised by FIs
6.18 Resources raised by the FIs during 2008-09 were considerably higher than those during the previous year. While the short-term resources raised witnessed a sharp rise during 2008-09 as compared with that a year ago, the long-term and foreign currency resources raised declined. NHB mobilised the largest amount of resources, followed by EXIM Bank and SIDBI. Foreign currency resources raised by EXIM Bank moderated while that by SIDBI expanded sharply during 2008-09 (Table VI.4 and Appendix Table VI.2).
6.19 Resources raised by FIs from the money market rose sharply during 2008-09 with the utilisation of umbrella limit reaching 58.0 per cent as compared to 22.9 per cent in the previous year (Table VI.5).
Table VI.3: Liabilities and Assets of Financial Institutions
(As at end-March) | (Amount in Rs. crore) | Item | Amount | Percentage
Variation | 2008 | 2009 | 2008-09 | 1 | 2 | 3 | 4 | Liabilities | | | | 1. | Capital | 4,000 | 4,300 | 7.5 | | | | (2.2) | (2.0) | | 2. | Reserves | 17,137 | 19,069 | 11.3 | | | | (9.5) | (8.8) | | 3. | Bonds and Debentures | 57,741 | 52,390 | -9.3 | | | | (32.1) | (24.1) | | 4. | Deposits | 36,298 | 65,591 | 80.7 | | | | (20.2) | (30.2) | | 5. | Borrowings | 33,716 | 40,443 | 20.0 | | | | (18.7) | (18.6) | | 6. | Other Liabilities | 31,020 | 35,579 | 14.7 | | | | (17.2) | (16.4) | | Total Liabilities/Assets | 1,79,912 | 2,17,372 | 20.8 | | | | (100.0) | (100.0) | | Assets | 1. | Cash and Bank Balances | 15,835 | 19,430 | 22.7 | | | | (8.8) | (8.9) | | 2. | Investments | 6,694 | 8,155 | 21.8 | | | | (3.7) | (3.8) | | 3. | Loans and Advances | 1,47,008 | 1,78,595 | 21.5 | | | | (81.7) | (82.2) | | 4. | Bills Discounted / Rediscounted | 2,044 | 2,145 | 5.0 | (1.1) | (1.0) | | 5. | Fixed Assets | 539 | 570 | 5.6 | | | | (0.3) | (0.3) | | 6. | Other Assets | 7,792 | 8,477 | 8.8 | | | | (4.3) | (3.9) | | Note: 1. Data pertain to four FIs, viz., NABARD, NHB, SIDBI and EXIM Bank. IIBI Ltd. was under voluntary winding up as on March 31, 2009.
2. Figures in parentheses are percentages to total liabilities/ assets.
Source : 1. Balance sheets of respective FIs.
2. Unaudited OSMOS Returns of NHB. |
Sources and Uses of Funds
6.20 Total sources/deployment of funds of FIs increased sharply by 39 per cent during 2008-09. 65.0 per cent of the funds of FIs were raised internally, which recorded a growth of 91.5 per cent. External sources, which contributed 30.7 per cent of sources of funds during 2008-09 as compared to 51.7 per cent during previous year, recorded a decline of 17.4 per cent due to turmoil in global financial markets. A large part of the funds raised were used for fresh deployments (65.5 per cent), followed by repayment of past borrowings (19.0 per cent) during 2008-09. The fresh deployment registered a growth of 55.1 per cent and other deployment 137.9 per cent during 2008-09 over 2007-08. (Table VI.6 and Appendix Table VI.3)
Table VI.4: Resources Mobilised by Financial Institutions | (Amount in Rs. crore) | Institution | Total Resources Raised | Total
Outstanding
(As at end-March) | Long-term | Short-term | Foreign Currency | Total | 2007-08 | 2008-09 | 2007-08 | 2008-09 | 2007-08 | 2008-09 | 2007-08 | 2008-09 | 2008 | 2009 | 1 | 2 | 3 | 4 | 5 | 6 | 7 | 8 | 9 | 10 | 11 | EXIM Bank | 6,825 | 3,197 | 2,180 | 8,905 | 5,553 | 3,800 | 14,558 | 15,902 | 31,716 | 37,202 | NABARD | 12,198 | 4,252 | 1,422 | 3,494 | - | - | 13,620 | 7,746 | 32,630 | 26,867 | NHB | 3,100 | 3,124 | 8,016 | 16,881 | - | - | 11,116 | 20,005 | 17,313 | 16,503 | SIDBI | 4,531 | 5,625 | 461 | 8,811 | 92 | 1,361 | 5,084 | 15,797 | 14,665 | 24,487 | Total | 26,654 | 16,198 | 12,079 | 38,091 | 5,645 | 5,161 | 44,378 | 59,450 | 96,324 | 1,05,059 | – : Nil/Negligible
Note : Long-term rupee resources comprise borrowings by way of bonds/debentures; and short-term resources comprise CPs, term deposits, ICDs, CDs and borrowing from the term money. Foreign currency resources comprise largely bonds and borrowings in the international market.
Source: Respective FIs |
Cost and Maturity of Borrowings
6.21 The weighted average cost of long-term resources raised by AIFIs recorded a mixed trend during 2008-09 (Table VI.7 and Appendix Table VI.4). The weighted average maturity of long-term resources raised by FIs increased, except for EXIM Bank and NHB during 2008-09.
Table VI.5: Resources Raised by Financial Institutions from the Money Market | (Amount in Rs. crore) | Instrument | 2006-07 | 2007-08 | 2008-09 | 1 | 2 | 3 | 4 | A. | Total | 3,293 | 4,458 | 15,247 | | | i) | Term Deposits | 89 | 508 | 2,222 | | | ii) | Term Money | - | 250 | 1,184 | | | iii) | Inter-corporate Deposits | - | - | - | | | iv) | Certificate of Deposits | 663 | 2,286 | 5,633 | | | v) | Commercial Paper | 2,540 | 1,414 | 6,207 | Memo: | | | | B. | Umbrella Limit | 19,001 | 19,500 | 26,292 | C. | Utilisation of Umbrella limit
(A as percentage of B) | 17.3 | 22.9 | 58.0 | - : Nil/Negligible.
Source : Fortnightly Return of Resource mobilised by Financial Institutions. |
Table VI.6 : Pattern of Sources and Deployment of Funds of Financial Institutions* | (Amount in Rs. crore) | Item | 2007-08 | 2008-09 | Percentage Variation 2008-09 | 1 | 2 | | 3 | A) | Sources of Funds (i+ii+iii) | 2,13,954 | 2,97,296 | 39.0 | | | | (100.0) | (100.0) | | | | (i) | Internal | 1,00,944 | 1,93,294 | 91.5 | | | | | (47.2) | (65.0) | | | | (ii) | External | 1,10,604 | 91,314 | -17.4 | | | | | (51.7) | (30.7) | | | | (iii) | Others@ | 2,406 | 12,688 | 427.3 | | | | | (1.1) | (4.3) | | B) | Deployment of Funds (i+ii+iii) | 2,13,954 | 2,97,296 | 39.0 | | | | (100.0) | (100.0) | | | | (i) | Fresh Deployment | 1,25,522 | 1,94,711 | 55.1 | | | | | (58.7) | (65.5) | | | | (ii) | Repayment of | 69,096 | 56,592 | -18.1 | | | | past borrowings | (32.3) | (19.0) | | | | (iii) | Other Deployment | 19,333 | 45,993 | 137.9 | | | | | (9.0) | (15.5) | | | | | of which: | | | | | | | Interest Payments | 6,916 | 8,809 | 27.4 | | | | | (3.2) | (3.0) | | * : EXIM Bank, NABARD, NHB and SIDBI.
@: Includes cash and balances with banks, balances with the Reserve Bank and other banks.
Note : Figures in parentheses are percentages to the totals.
Source : Respective FIs. |
Table VI.7: Weighted Average Cost and Maturity of Long-term Resources Raised by Financial Institutions | Institution | Weighted Average cost (per cent) | Weighted Average Maturity in years | 2007-08 | 2008-09 | 2007-08 | 2008-09 | 1 | 2 | 3 | 4 | 5 | EXIM Bank | 8.2 | 9.0 | 3.0 | 2.5 | SIDBI | 8.2 | 6.5 | 1.0 | 3.4 | NABARD | 9.5 | 9.5 | 4.0 | 4.3 | NHB | 7.7 | 7.4 | 2.8 | 2.8 | Note : Data are provisional.
Source : Respective FIs. |
Lending Rates
6.22 NHB, SIDBI and EXIM Bank raised their Prime Lending Rates (PLRs) marginally during 2008-09 as compared to the previous year (Table VI.8).
Table VI.8: Long-term PLR Structure of Select inancial Institutions | (Per cent) | Effective | NHB | EXIM Bank | TFCI | 1 | 2 | 3 | 4 | March 2008 | 10.50 | 13.50 | 12.00 | March 2009 | 10.75 | 14.00 | 12.50 | Source : Respective FIs. |
Financial Performance of Financial Institutions
6.23 Net interest income and non-interest income of FIs increased by 22.5 per cent and 31.1 per cent, respectively. However, in contrast with the decline in the previous year, the wage bill increased by 26.1 per cent during 2008-09. The operating profit increased by 33.5 per cent during the year. The net profit of FIs also increased despite higher provisions for taxation (Table VI.9).
Table VI.9: Financial Performance of Select All-India Financial Institutions | (Amount in Rs. crore) | Item | 2007-08 | 2008-09 | Variation | 2007-08 | 2008-09 | Amount | Percentage | Amount | Percentage | 1 | 2 | 3 | 4 | 5 | 6 | 7 | A) | Income (a+b) | 11,541 | 14,274 | 2,467 | 27.2 | 2,733 | 23.7 | | | a) | Interest Income | 9,934 | 12,169 | 1,796 | 22.1 | 2,234 | 22.5 | | | | | (86.1) | (85.3) | | | | | | | b) | Non-Interest Income | 1,607 | 2,106 | 671 | 71.8 | 499 | 31.1 | | | | | (13.9) | (14.8) | | | | | B) | Expenditure (a+b) | 8707 | 10,492 | 1,812 | 26.3 | 1,785 | 20.5 | | | a) | Interest Expenditure | 7,277 | 8,977 | 1,362 | 22.9 | 1,699 | 23.4 | | | | | (83.6) | (85.6) | | | | | | | b) | Operating Expenses | 1,430 | 1,516 | 450 | 46.6 | 86 | 6.0 | | | | | (16.4) | (14.4) | | | | | | | | of which : Wage Bill | 287 | 362 | -139 | -32.7 | 76 | 26.4 | C) | Provisions for Taxation | 936 | 1,190 | 304 | 48.1 | 254 | 27.2 | D) | Profit | | | | | | | | | Operating Profit (PBT) | 2,834 | 3,782 | 656 | 30.1 | 948 | 33.5 | | | Net Profit (PAT) | 1,898 | 2,592 | 352 | 22.7 | 694 | 36.6 | E) | Financial Ratios@ | | | | | | | | | Operating Profit | 1.6 | 1.7 | | | | | | | Net Profit | 1.1 | 1.2 | | | | | | | Income | 6.4 | 6.6 | | | | | | | Interest Income | 5.5 | 5.6 | | | | | | | Other Income | 0.9 | 1.0 | | | | | | | Expenditure | 4.8 | 4.8 | | | | | | | Interest Expenditure | 4.0 | 4.1 | | | | | | | Other Operating Expenses | 0.8 | 0.7 | | | | | | | Wage Bill | 0.2 | 0.2 | | | | | | | Provisions | 0.5 | 0.6 | | | | | | | Spread (Net Interest Income) | 1.4 | 1.4 | | | | | @ : As percentage of total assets.
Note : Figures in parentheses are percentage shares to the respective total.
Source : Annual Accounts of respective FIs.2) Unaudited OSMOS returns of NHB (As at June-end). |
Table VI.10: Select Financial Parameters of Financial Institutions (As at end-March) | (Per cent) | Institution | Interest Income/
Average Working Funds | Non-interest Income/Average Working Funds | Operating Profits/Average Working Funds | Return on Average Assets | Net Profit
per Employee
(Rs. crore) | 2008 | 2009 | 2008 | 2009 | 2008 | 2009 | 2008 | 2009 | 2008 | 2009 | 1 | 2 | 3 | 4 | 5 | 6 | 7 | 8 | 9 | 10 | 11 | EXIM Bank | 7.6 | 7.8 | 1.2 | 0.8 | 2.3 | 2.4 | 1.0 | 1.2 | 1.5 | 2.1 | NABARD | 6.1 | 6.5 | 0.1 | 0.1 | 2.0 | 1.9 | 1.4 | 1.3 | 0.3 | 0.3 | NHB* | 7.5 | 8.0 | 0.3 | 0.3 | 1.1 | 1.7 | 0.6 | 1.2 | .. | .. | SIDBI | 8.5 | 8.8 | 0.7 | 1.1 | 3.1 | 5.3 | 1.6 | 3.1 | 0.2 | 0.3 | .. : Not Available.
* : Position as at end-June as per OSMOS returns. In case of NHB, total assets have been taken in lieu of average working funds.
Source : 1. Respective FIs,
2. Unaudited off-site Returns for NHB. |
6.24 The interest income and the non-interest income as percentage of working funds (except EXIM Bank) increased for all FIs. Operating profit as percentage of working funds and return on average assets (ROA) improved for all FIs except NABARD. The ROA was the highest for SIDBI followed by NABARD, EXIM Bank and NHB
(Table VI.10).
Soundness Indicators: Asset Quality
6.25 It is significant to note that the FIs recorded improvement in their asset quality during 2008-09 notwithstanding the fall out of the ongoing global financial crisis. In terms of net NPA to net loans ratio, the asset quality of SIDBI and EXIM Bank improved during the year. Net NPA ratio of NABARD, however, increased marginally (Table VI.11).
6.26 Improvement in asset quality was also observed in terms of a substantial increase in standard assets of the FIs except NHB in which there is a slight decrease in the standard assets. Furthermore, none of the FIs had any assets in the ‘loss’ assets category as at end-March 2009
(Table VI.12).
Capital Adequacy
6.27 The capital adequacy ratio of all the FIs continued to be significantly higher than the minimum stipulated norm of 9 per cent. Notwithstanding this, CRARs of NABARD, NHB and SIDBI at end-March 2009 were lower than those in the previous year, while CRAR of EXIM Bank increased at end-March 2009 compared to the previous year (Table VI.13).
3. Non-Banking Financial Companies
6.28 The Reserve Bank of India Act, 1934 was amended in January 1997 to provide a comprehensive legislative framework for regulation of NBFCs. The amended Act, inter alia, provided for compulsory registration and minimum NOF for all NBFCs. It also gave the Reserve Bank powers to determine policies and issue directions to NBFCs regarding income recognition, accounting standards, NPAs, capital adequacy, deployment of funds as well as purposes for which advances would be made, etc.
Table VI.11: Net Non-Performing Assets (As at end-March) | (Amount in Rs. crore) | Institution | Net NPAs | Net NPAs/ Net Loans (per cent) | 2008 | 2009 | 2008 | 2009 | 1 | 2 | 3 | 4 | 5 | EXIM Bank | 83 | 79 | 0.29 | 0.23 | NABARD | 19 | 30 | 0.02 | 0.03 | NHB* | - | - | - | - | SIDBI | 49 | 26 | 0.25 | 0.08 | All FIs | 151 | 135 | 0.10 | 0.07 | - : Nil/Negligible.
* : Position as at end-June as per OSMOS returns
Source : Respective FIs. |
Table VI.12: Asset Classification of Financial Institutions (At end-March) | (Amount in Rs. crore) | Institution | Standard | Sub-Standard | Doubtful | Loss | 2008 | 2009 | 2008 | 2009 | 2008 | 2009 | 2008 | 2009 | 1 | 2 | 3 | 4 | 5 | 6 | 7 | 8 | 9 | EXIM Bank | 28,694 | 34,077 | 41 | 21 | 42 | 58 | - | - | NABARD | 82,853 | 98,822 | 2 | 7 | 17 | 23 | - | - | NHB* | 17,427 | 16,851 | - | - | - | - | - | - | SIDBI | 19,927 | 30,854 | 24 | 23 | 25 | 3 | - | - | All FIs | 1,48,901 | 1,80,605 | 67 | 51 | 84 | 85 | - | - | - : Nil/Negligible.
* : Position as at end-June.
Source : 1. Respective FIs.
2. Unaudited Off-site returns for NHB. |
Regulatory and Supervisory Initiatives
6.29 Regulation of non-banking entities is being progressively strengthened and the process had started before the onset of the global financial crisis. Issues relating to the level playing field between bank sponsored NBFCs and non bank associated NBFCs and other issues of regulatory convergence and regulatory arbitrage were examined with respect to systemic implications. Non Deposit taking NBFCs with asset size of Rs.100 crore and above were defined as systemically important and an elaborate prudential framework was put in place.
6.30 Initially, with a view to protect the interests of depositors, regulatory attention was mostly focused on NBFCs accepting public deposits (NBFCs-D). Over the years, however, this regulatory framework has been widened to include issues of systemic significance. The sector is being consolidated and while deposit taking NBFCs have decreased both in size as well as in terms of the quantum of deposits held by them, NBFCs-ND have increased in terms of number and asset size. NBFCs-ND-SI (NBFCs-ND with asset size of Rs.100 crore and above) are subject to CRAR and exposure norms prescribed by the Reserve Bank.
Table VI.13: Capital Adequacy Ratio of Select Financial Institutions As at end-March | (Per cent) | Institution | 2002 | 2003 | 2004 | 2005 | 2006 | 2007 | 2008 | 2009 | 1 | 2 | 3 | 4 | 5 | 6 | 7 | 8 | 9 | EXIM Bank | 33.1 | 26.9 | 23.5 | 21.6 | 18.4 | 16.4 | 15.1 | 16.8 | NABARD | 36.9 | 39.1 | 39.4 | 38.8 | 34.4 | 27.0 | 26.6 | 25.9 | NHB* | 22.1 | 27.9 | 30.5 | 22.5 | 22.3 | 21.7 | 24.7 | 17.7 | SIDBI | 45.0 | 44.0 | 51.6 | 50.7 | 43.2 | 37.5 | 41.8 | 34.2 | * : Position as at end-June.
Source : 1. Respective FIs.
2. Unaudited Off-site returns for NHB. |
6.31 The changing regulatory policy also recognised that those activities of NBFCs which are creating productive asset must be given special consideration. Accordingly, reclassification of NBFCs was effected in December 2006, in terms of which companies financing real/physical assets for productive/ economic activities would be classified as Asset Finance Companies (AFCs). The other two categories of NBFCs would be Loan Companies
(LCs) and Investment Companies (ICs).
Monitoring of Frauds in NBFCs
6.32 In July 2008, the Reserve Bank revised the approach towards monitoring of frauds in NBFCs issued in March 2008. Accordingly, NBFCs were advised to report frauds in their subsidiaries and affiliates/joint ventures.
Guidelines for Securitisation Companies (SCs) and Reconstruction Companies (RCs)
6.33 The Reserve Bank revised the formats of quarterly statements to be submitted by Securitisation Companies/Reconstruction Companies (SCs/RCs) in September 2008. The revised statements would capture, inter alia, data on position of owned fund of the SCs/RCs (including FDI component); position of acquisition/realisation of financial assets from banks/FIs by the SCs/RCs in terms of the SARFAESI Act, 2002; and information as regards security receipts (SRs) issued, redeemed and outstanding at the end of particular quarter.
6.34 It was clarified that a SC/RC was neither a ‘bank’ nor a ‘financial institution’ under the provisions of the SARFAESI Act. Therefore, the acquisition of financial assets by a SC/RC from another SC/RC would not be in conformity with the provisions of the said Act. There was, however, no bar on SCs/RCs deploying their funds for undertaking restructuring of acquired loan accounts with the sole purpose of realising
their dues.
Treatment of Deferred Tax Assets (DTA) and Deferred Tax Liabilities (DTL) for Computation of Capital
6.35 As creation of DTA or DTL gives rise to certain issues impacting on the balance sheet of the company, NBFCs were advised on July 31, 2008 that the balance in DTL account will not be eligible for inclusion in Tier I or Tier II capital for capital adequacy purpose. Further, DTA will be treated as an intangible asset and should be deducted from Tier I capital. In this connection, it was further clarified that DTL created by debit to opening balance of Revenue Reserves or to Profit and Loss Account for the current year should be included under ‘others’ of “Other Liabilities and Provisions” and DTA created by credit to opening balance of Revenue Reserves or to Profit and Loss account for the
current year should be included under item‘others’ of “Other Assets.”
Prevention of Money Laundering Act, 2002 – Obligation of NBFCs
6.36 In August 2008, NBFCs, as a part of transaction monitoring mechanism, were required to put in place an appropriate software application to throw alerts when the transactions are inconsistent with risk categorisation and updated profile of customers. In the case of NBFCs, where all the branches are not yet fully computerised, the Principal Officer of the NBFC was required to cull out the transaction details from branches which are not computerised and suitably arrange to feed the data into an electronic file with the help of the editable electronic utilities of Cash Transaction Report (CTR) and Suspicious Transaction Reports (STR) as have been made available by Financial Intelligence Unit-India (FIU-IND) on their website. It was further clarified that cash transaction reporting by branches/offices of NBFCs to their Principal Officer should invariably be submitted on a monthly basis and the Principal Officer, in turn, should ensure to submit CTR for every month to
FIU-IND within the prescribed time schedule.
Regulation of Excessive Interest charged by NBFCs
6.37 The Reserve Bank issued directions regarding excessive rates of interest in January 2009. Accordingly, now the Board of each NBFC should adopt an interest rate model taking into account the relevant factors such as cost of
funds, margin and risk premium, and
determine the rate of interest to be charged for
loans and advances. The rate of interest should
be an annualised rate so that the borrower is
aware of the exact rate that would be charged
to the account.
Ratings of NBFCs
6.38 In February 2009, all NBFCs (both
deposit taking and non-deposit taking) with
asset size of Rs.100 crore and above were
required to furnish the information about
downgrading/upgrading of assigned rating of any
financial product issued by them, within fifteen
days of such a change in rating, to the Regional
Office of the Reserve Bank under whose
jurisdiction their registered office is functioning.
Policy Initiatives for NBFCs-ND-SI
Guideline on Capital Adequacy, Liquidity and Disclosure Norms for NBFC-ND-SI
6.39 The Reserve Bank reviewed the extant
guidelines regarding NBFCs-ND-SI and the final
guidelines were issued on August 1, 2008. In
terms of these guidelines, the minimum CRAR
for each NBFC-ND-SI was raised from the
existing 10 per cent to 12 per cent to be reached
by March 31, 2009 and further to 15 per cent
by March 31, 2010. In view of the economic
downturn and based on several requests
received, this requirement was postponed for
one year. The NBFCs-ND-SI are required to
make additional disclosures relating to CRAR,
exposure to real estate sector and maturity
pattern of assets and liabilities in their balance
sheet from the year ending March 31, 2009.
Enhancement of NBFCs’ Capital Raising Option for Capital Adequacy Purposes
6.40 In October 2008, taking into
consideration, the need for enhanced funds for
increasing business and meeting regulatory
requirements, the Reserve Bank decided that
NBFCs-ND-SI may augment their capital funds
by issue of Perpetual Debt Instruments (PDIs).
Such PDIs shall be eligible for inclusion as Tier
I Capital to the extent of 15 per cent of total Tier
I capital as on March 31 of the previous year.
Raising of Short Term Foreign Currency Borrowings
6.41 In December 2008, systemically
important NBFCs-ND-SI were permitted, as a
temporary measure, to raise foreign currency
short term borrowings under the approval route
subject to certain conditions. In this connection,
all the NBFCs-ND-SI that have availed short
term foreign currency loans were advised to
furnish a monthly return as per the prescribed
format within ten days from the end of the
month to which it pertains.
Acceptance of Deposits by Chit Fund Companies
6.42 In order to regulate the credit system of
the country to its advantage, MNBCs were
prohibited with effect from August 18, 2009
from accepting deposits from public except from
the shareholders, which was subject to the
conditions specified in the MNBC (RBI)
Directions 1977. Any deposit accepted and held
by the MNBCs other than from its shareholders
as on date shall be repaid on maturity and shall
not be eligible for renewal.
Requirement for obtaining prior approval of RBI in cases of acquisition/transfer of control of NBFCs accepting deposits
6.43 To enable RBI to verify the ‘fit and proper’
character of the management of NBFCs is
continuously maintained, it has been decided that any takeover/acquisition of shares or merger/ amalgamation of a deposit taking NBFC with another entity or any merger/amalgamation of an entity with a deposit taking NBFC that would give the acquirer/another entity control of the deposit taking NBFC, would require prior permission of RBI with effect from September 17, 2009. Applications in this regard are to be submitted to the Regional Office of the Department of Non-Banking Supervision in whose jurisdiction the Registered Office of the Company is located.
Introduction of Interest Rate Futures-NBFCs
6.44 To hedge the underlying exposures,
directions were issued covering the framework
for trading of Interest Rate Futures by NBFCs
in exchanges in India recognized by SEBI
subject to RBI/SEBI guidelines in the matter.
Profile of NBFCs (including RNBCs)
6.45 Total number of NBFCs registered with
the Reserve Bank, consisting of NBFCs-D
(deposit-taking NBFCs), RNBCs, mutual benefit
companies (MBCs), miscellaneous non-banking
companies (MNBCs) and Nidhi companies,
declined from 12,809 at end-June 2008 to
12,740 at end-June 2009 (Table VI.14). The number of NBFCs-D also declined from 364 at end-June 2008 to 336 at end-June 2009, mainly due to the exit of many NBFCs from deposit taking activity. Of the 336 deposit taking NBFCs, 275 NBFCs filed annual returns for the year ended March 2009 by the cut off date of September 30, 2009. The number of RNBCs declined to two at end-March 2009.
Table VI.14: Number of NBFCs Registered with the Reserve Bank |
End-June |
Number of Registered NBFCs |
Number of NBFCs-D |
1 |
2 |
3 |
1999 |
7,855 |
624 |
2000 |
8,451 |
679 |
2001 |
13,815 |
776 |
2002 |
14,077 |
784 |
2003 |
13,849 |
710 |
2004 |
13,764 |
604 |
2005 |
13,261 |
507 |
2006 |
13,014 |
428 |
2007 |
12,968 |
401 |
2008 |
12,809 |
364 |
2009 |
12,740 |
336 |
6.46 Total assets of NBFCs declined to Rs.95,727 crore during 2008-09 from Rs.99,014 crore in previous year. Public deposits also recorded a decline to Rs.21,548 crore at end-March 2009 from Rs.24,400 crore at end-March 2008. Net owned funds (NOF) witnessed a growth of 8.8 percent and stood at Rs.13,458 crore as on end-March 2009. The share of RNBCs in NBFCs in terms of total assets, public deposits and NOF recorded marginal decline during 2008-09 over previous year (Table VI.15).
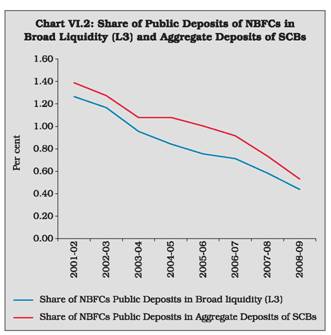
6.47 The ratio of deposits of reporting NBFCs to the aggregate deposits of scheduled commercial banks dropped to 0.53 per cent at end-March 2009 from 0.73 per cent at end-March 2008 mainly due to the decline in deposits of reporting NBFCs. The share of NBFC deposits in broad liquidity aggregate (L3) also declined over the year (Chart VI.2).
Table VI.15: Profile of NBFCs |
(Amount in Rs. crore) |
Item |
As at end-March |
|
2008 |
2009 P |
|
NBFCs |
of which: RNBCs |
NBFCs |
of which: RNBCs |
1 |
2 |
3 |
4 |
5 |
Total Assets |
99,014 |
24,452 |
95,727 |
20,211 |
| |
|
(24.7) |
|
(21.1) |
Public Deposits |
24,400 |
22,358 |
21,548 |
19,607 |
| |
|
(91.6) |
|
(91.0) |
Net Owned Funds |
11,921 |
1,718 |
13,458 |
1,870 |
| |
|
(14.4) |
|
(13.9) |
P: Provisional.
Note : 1. NBFCs comprise NBFCs-D and RNBCs.
2. Figures in parentheses are percentages to respective total of NBFCs.
Source: Annual Returns. |
 Operations of NBFCs (excluding RNBCs)
6.48 Total assets/liabilities of NBFCs (excluding RNBCs) expanded at the rate of 1.3 per cent during 2008-09 as compared with 53.6 per cent during 2007-08 (Table VI.16). Borrowings, which is the major source of funds for NBFCs, increased by 9.3 per cent during the year, while public deposits declined by 4.9 per cent indicating the continuing shift in the pattern of resources raised. On the assets side, hire purchase assets and loans and advances, which are major items of assets witnessed growth of 6.3 per cent and 12.0 per cent, respectively as compared with 27.9 per cent and 70.2 per cent, respectively, during previous year. Growth of total investments of NBFCs decelerated mainly due to deceleration in investment in approved securities. Other investments increased by 37.4 per cent during 2008-09 as compared with 30.0 per cent during 2007-08.
Table VI.16: Consolidated Balance Sheet of NBFCs-D |
(Amount in Rs. crore) |
Item |
A s at End-March |
Variation |
2007-08 |
2008-09 |
2007-08 |
2008-09 P |
Absolute |
Per cent |
Absolute |
Per cent |
1 |
2 |
3 |
4 |
5 |
|
6 |
Liabilities |
|
|
|
|
|
|
1. |
Paid up Capital |
3,266 |
3,508 |
998 |
44.0 |
242 |
7.4 |
| |
|
(4.4) |
(4.6) |
|
|
|
|
2. |
Reserves & Surplus |
8,695 |
9,337 |
2,834 |
48.4 |
642 |
7.4 |
| |
|
(11.7) |
(12.4) |
|
|
|
|
3. |
Public Deposit |
2,042 |
1,941 |
-35 |
-1.7 |
-101 |
-4.9 |
| |
|
(2.7) |
(2.6) |
|
|
|
|
4. |
Borrowings |
50,577 |
55,289 |
18,125 |
55.9 |
4,712 |
9.3 |
| |
|
(67.8) |
(73.2) |
|
|
|
|
5. |
Other Liabilities |
9,982 |
5,441 |
4,087 |
69.3 |
-4,541 |
-45.5 |
| |
|
(13.4) |
(7.2) |
|
|
|
|
LIABILITIES/ASSETS |
74,562 |
75,516 |
26,008 |
53.6 |
954 |
1.3 |
Assets |
1. |
Investments |
11,210 |
14,813 |
3,798 |
51.2 |
3,603 |
32.1 |
| |
|
(15.0) |
(19.6) |
|
|
|
|
| |
i) Approved Securities @ |
7,146 |
9,230 |
2,859 |
66.7 |
2,084 |
29.2 |
| |
ii) Other Investments |
4,064 |
5,583 |
939 |
30.0 |
1,519 |
37.4 |
| |
|
(5.5) |
(7.4) |
|
|
|
|
2. |
Loan & Advances |
18,823 |
21,073 |
7,764 |
70.2 |
2,250 |
12.0 |
| |
|
(25.2) |
(27.9) |
|
|
|
|
3. |
Hire Purchase Assets |
33,525 |
35,647 |
7,303 |
27.9 |
2,122 |
6.3 |
| |
|
(45.0) |
(47.2) |
|
|
|
|
4. |
Equipment Leasing Assets |
1,048 |
585 |
-317 |
-23.2 |
-463 |
-44.2 |
| |
|
(1.4) |
(0.8) |
|
|
|
|
5. |
Bill Business |
12 |
23 |
5 |
71.4 |
11 |
91.7 |
| |
|
(0.0) |
(0.0) |
|
|
|
|
6. |
Other Assets |
9,944 |
3,375 |
7,456 |
299.7 |
-6,569 |
-66.1 |
| |
|
(13.3) |
(4.5) |
|
|
|
|
P : Provisional
@ : SLR Asset comprises ‘Approved Securities’ and ‘unencumbered term deposits’ in Scheduled Commercial Banks
Note : Figures in parentheses are percentage shares in respective total
Source : Annual Returns. |
6.49 Among NBFC groups, asset finance companies (AFCs) held the largest share in total assets/liabilities (70.3 per cent), followed by loan companies (28.9 per cent), hire purchase companies (0.6 per cent) and equipment leasing (0.3 per cent) (Table VI.17). The increase in assets/liabilities of AFCs was mainly on account of reclassification of NBFCs, which was initiated in December 2006 and the process of which is still continuing. The share of equipment leasing companies declined to below 1 per cent subsequent upon the re-classification of NBFCs in 2006-07. The relative significance of various NBFC groups reflected largely the pattern of their borrowings as deposits constituted a small share (2.6 per cent) of their total liabilities. Of the total deposits held by all NBFCs, asset finance companies held the largest share in total deposits of NBFCs (70.3 per cent), followed distantly by loan companies with a 19.9 per cent share and by hire purchase companies with a share of 9.6 per cent (Table VI.17).
Deposits: Profile of Public Deposits of Different Categories of NBFCs
6.50 Continuing the trend of the previous year,
public deposits held by all groups of NBFCs
taken together, declined moderately during
2008-09. This trend is indicative of the shift in
preference of NBFCs from public deposits to
bank loans/ debentures. The decline in public
deposits was mainly evident in the case of loan
companies and equipment leasing companies due to reclassification of some of these
companies as asset finance companies. Deposits
of asset finance companies increased by 17.5
per cent during 2008-09 (Table VI.18).
Size-wise Classification of NBFCs Deposits
6.51 Deposits held by NBFCs ranged from
less than Rs.0.5 crore to above Rs.50 crore
(Table VI.19). The deposits held by NBFCs in all
deposit-groups declined during 2008-09, except
in the deposit-class ‘more than Rs.10 crore and
up to Rs.20 crore’ and ‘more than Rs.20 crore
and up to Rs.50 crore’. The share of the deposit
class ‘Rs.50 crore and above’ in total deposits was 80 per cent, while that of other deposit classes combined together was only about 20 per cent of total public deposits of the NBFC sector.
Table VI.17: Major Components of Liabilities of NBFCs-D by Classification of NBFCs |
(Amount in Rs. crore) |
Classification of NBFCs |
Liabilities |
Deposits |
Borrowings |
2007-08 |
2008-09 P |
2007-08 |
2008-09 P |
2007-08 |
2008-09 P |
1 |
2 |
3 |
4 |
5 |
6 |
7 |
Asset Finance |
50,998 |
53,068 |
1,161 |
1,364 |
34,093 |
40,232 |
| |
(68.4) |
(70.3) |
(56.9) |
(70.3) |
(67.4) |
(72.8) |
Equipment Leasing |
162 |
192 |
10 |
3 |
76 |
54 |
| |
(0.2) |
(0.3) |
(0.5) |
(0.2) |
(0.2) |
(0.1) |
Hire Purchase |
178 |
425 |
169 |
186 |
38 |
43 |
| |
(0.2) |
(0.6) |
(8.3) |
(9.6) |
(0.1) |
(0.1) |
Investment |
402 |
- |
19 |
- |
358 |
- |
| |
(0.5) |
|
(0.9) |
|
(0.7) |
|
Loan |
22,819 |
21,831 |
682 |
388 |
16,012 |
14,960 |
| |
(30.6) |
(28.9) |
(33.4) |
(19.9) |
(31.7) |
(27.1) |
MNBC |
3 |
- |
1 |
- |
0 |
|
| |
(0.0) |
|
(0.1) |
|
|
|
Total |
74,562 |
75,516 |
2,042 |
1,941 |
50,577 |
55,289 |
– : Nil/Negligible.
P : Provisional.
Note : Figures in parentheses are percentage shares in respective total.
Source : Annual Returns. |
Table VI.18: Public Deposits held by NBFCs-D by Classification of NBFCs |
(Amount in Rs. crore) |
NBFC Group |
As at end-March |
Percentage Variation |
Number of NBFCs |
Public Deposits |
2007-08 |
2008-09 P |
2007-08 |
2008-09 P |
2008-09 |
1 |
2 |
3 |
4 |
5 |
6 |
Asset Finance |
185 |
147 |
1,161 |
1,364 |
17.5 |
| |
|
|
(56.9) |
(70.3) |
|
Equipment Leasing |
15 |
11 |
10 |
3 |
-70.6 |
| |
|
|
(0.5) |
(0.2) |
|
Hire Purchase |
76 |
74 |
169 |
186 |
10.1 |
| |
|
|
(8.3) |
(9.6) |
|
Investment |
1 |
1 |
19 |
– |
– |
| |
|
|
(0.9) |
|
|
Loan |
70 |
42 |
683 |
388 |
-43.3 |
| |
|
|
(33.4) |
(19.9) |
|
MNBCs |
3 |
|
1 |
- |
- |
Total |
350 |
275 |
2,042 |
1,941 |
-4.9 |
– : Nil/Negligible.
P : Provisional
Note : Figures in parentheses are percentage shares in respective total.
Source : Annual Returns. |
Table VI.19: Public Deposits held by NBFCs-D by Deposit Ranges |
(Amount in Rs. crore) |
Deposit Range |
As at end-March |
No. of NBFCs |
Amount of Deposit |
2007-08 |
2008-09P |
2007-08 |
2008-09P |
1 |
2 |
3 |
4 |
5 |
Less than Rs. 0.5 crore |
213 |
177 |
28 |
22 |
| |
|
|
(1.4) |
(1.1) |
More than Rs.0.5 crore |
85 |
53 |
82 |
51 |
and up to Rs.2 crore |
|
|
(4.0) |
(2.6) |
More than Rs.2 crore |
38 |
30 |
186 |
133 |
and up to Rs.10 crore |
|
|
(9.1) |
(6.9) |
More than Rs.10 crore |
4 |
6 |
61 |
76 |
and up to Rs.20 crore |
|
|
(3.0) |
(3.9) |
More than Rs.20 crore |
2 |
3 |
56 |
115 |
and up to Rs.50 crore |
|
|
(2.7) |
(5.9) |
Rs.50 crore and above |
8 |
6 |
1,629 |
1,544 |
| |
|
|
(79.8) |
(79.5) |
Total |
350 |
275 |
2,042 |
1,941 |
P : Provisional.
Note : Figures in parentheses are percentage shares in respective
total.
Source: Annual Returns. |
Region-wise Composition of Deposits held by NBFCs
6.52 Following the trend of the previous year,
deposits held by NBFCs across all the regions
declined during 2008-09 except western region
(Table VI.20). Western region recorded the growth
of 85.7 per cent in the public deposits. As in the
previous year, the southern region accounted for
the largest share of deposits (around 76 per cent),
followed by the northern region (around 15 per
cent) and the western region (around 8 per cent).
The presence of NBFCs in the north-eastern region
continued to be nil during the year. Among the
metropolitan cities, Chennai continued to hold the
largest share of deposits, while New Delhi
continued to account for the largest number of
NBFCs.
Interest Rate on Public Deposits with NBFCs
6.53 The share of public deposits held by
NBFCs contracted in the interest rates up to
10 per cent declined from 73.0 per cent in
2007-08 to 30.1 per cent in 2008-09, while
those contracted in the bracket ‘more than 10
per cent and up to 12 per cent’ witnessed a sharp rise from 25.4 per cent to 65.0 per cent (Table VI.21).
Table VI.20: Public Deposits held by NBFCs-D -Region-wise |
(Amount in Rs. crore) |
Region |
As at end-March |
2007-08 |
2008-09 P |
Number of NBFCs-D |
Public Deposits |
Number of NBFCs-D |
Public Deposits |
1 |
2 |
3 |
4 |
5 |
Central |
54 |
25 |
42 |
20 |
| |
|
(1.2) |
|
(1.0) |
East |
9 |
18 |
5 |
8 |
| |
|
(0.9) |
|
(0.4) |
North |
180 |
284 |
139 |
283 |
| |
|
(13.9) |
|
(14.6) |
South |
84 |
1,631 |
66 |
1,474 |
| |
|
(79.9) |
|
(75.9) |
West |
23 |
84 |
23 |
156 |
| |
|
(4.1) |
|
(8.0) |
Total |
350 |
2,042 |
275 |
1,941 |
Metropolitan cities : |
|
|
|
Kolkata |
6 |
15 |
3 |
8 |
Chennai |
46 |
1,565 |
33 |
1,407 |
Mumbai |
10 |
76 |
11 |
148 |
New Delhi |
63 |
204 |
47 |
207 |
Total |
125 |
1,860 |
94 |
1,770 |
P : Provisional.
Note : Figures in parentheses are percentages to respective total.
Source : Annual Returns. |
Maturity Pattern of Public Deposits
6.54 Deposits with the maturity period of ‘less than 1 year’, ‘more than 1 year and up to 2 years’ and ‘5 years and above’ increased during the year. Deposits in the maturity bucket of ‘more than 2 years and up to 3 years’ and ‘more than 3 years and less than 5 years’ declined significantly at end-March 2009. As a result, their share in total deposits recorded a decline in total deposits (Table VI.22).
Table VI.21: Public Deposits held by NBFCs-D - Deposit Interest Rate Range-wise |
(Amount in Rs. crore) |
Deposit Interest Rate Range |
As at end-March |
2007-08 |
2008-09 P |
1 |
2 |
3 |
Upto 10 per cent |
1,491 |
584 |
| |
(73.0) |
(30.1) |
More than 10 per cent and up to 12 per cent |
518 |
1,261 |
| |
(25.4) |
(65.0) |
12 per cent and above |
33 |
96 |
| |
(1.6) |
(4.9) |
Total |
2,042 |
1,941 |
P : Provisional.
Note : Figures in parentheses are percentages to respective total.
Source : Annual Returns. |
Table VI:22 Maturity Pattern of Public Deposits held by NBFCs-D |
(Amount in Rs. crore) |
Maturity Period |
As at end-March |
2007-08 |
2008-09 P |
1 |
2 |
3 |
1. |
Less than 1 year |
611 |
698 |
| |
|
(29.9) |
(36.0) |
2. |
More than 1 and up to 2 years |
491 |
506 |
| |
|
(24.0) |
(26.1) |
3. |
More than 2 and up to 3 years |
663 |
593 |
| |
|
(32.5) |
(30.6) |
4. |
More than 3 and up to 5 years |
211 |
84 |
| |
|
(10.3) |
(4.3) |
5. |
5 years and above |
66 |
60 |
| |
|
(3.2) |
(3.0) |
Total |
2,042 |
1,941 |
P : Provisional
Note : Figures in parentheses are percentages to respective total.
Source : Annual Returns. |
Borrowings by NBFCs
6.55
The outstanding borrowings by NBFCs increased by 9.3 per cent during 2008-09 (Table VI.23). Borrowings by equipment leasing companies and loan companies declined, while those by asset finance companies and hire purchase companies increased during the year. AFCs continued to hold the largest share (72.8 per cent) of borrowings of all NBFCs, followed by loan companies (27.1 per cent).
6.56
Borrowings by NBFCs from banks and financial institutions increased sharply by 29.3 per cent while borrowings by way of bonds and debentures remained at the same level during 2008-09. The borrowings from Government declined by 21.4 per cent during 2008-09. Other deposits (which include, inter alia, money borrowed from other companies, unsecured loans from directors/promoters, commercial paper, borrowings from mutual funds and any other type of funds which are not treated as public deposits) also registered a decline of 2.6 per cent during 2008-09 (Table VI.24).
Table VI.23: Borrowings by NBFCs-D by Classification of NBFCs |
(Amount in Rs. crore) |
Classification |
As at end-March |
Percentage Variation |
No. of NBFCs |
Total Borrowings |
2007-08 |
2008-09 P |
2007-08 |
2008-09 P |
2008-09 |
1 |
2 |
3 |
4 |
5 |
6 |
Asset Finance |
185 |
147 |
34,093 |
40,232 |
18.0 |
| |
|
|
(67.4) |
(72.8) |
|
Equipment Leasing |
15 |
11 |
76 |
54 |
-28.8 |
| |
|
|
(0.2) |
(0.1) |
|
Hire Purchase |
76 |
74 |
38 |
43 |
13.2 |
| |
|
|
(0.1) |
(0.1) |
|
Investment |
1 |
1 |
358 |
- |
- |
| |
|
|
(0.7) |
|
|
Loan |
70 |
42 |
16,012 |
14,960 |
-6.6 |
| |
|
|
(31.7) |
(27.1) |
|
MNBCs |
3 |
|
- |
- |
- |
Total |
350 |
275 |
50,577 |
55,289 |
9.3 |
P : Provisional
Note : Figures in parentheses are percentages to respective total.
Source : Annual Returns. |
Assets of NBFCs
6.57 The total assets of deposit-taking NBFCs registered a marginal growth of 1.3 per cent during 2008-09 mainly on account of decline in assets of loan companies (Table VI.25). Loans and advances (7.3 per cent) as well as investments (32.1 per cent) of NBFCs also increased during the year. At end-March 2009, 73.0 per cent of total assets, 75.4 per cent of total loans and advances and 23.9 per cent of total investments by all NBFCs were held by AFCs.
Table VI.24: Sources of Borrowings by NBFCs-D by Classification of NBFCs |
(Amount in Rs. crore) |
Classification |
As at end-March |
Government |
External Sources @ |
Banks and Financial Institutions |
Debentures |
Others |
| |
2008 |
2009 P |
2008 |
2009 P |
2008 |
2009 P |
2008 |
2009 P |
2008 |
2009 P |
1 |
2 |
3 |
4 |
5 |
6 |
7 |
8 |
9 |
10 |
11 |
Asset Finance |
0 |
0 |
828 |
832 |
16,330 |
21,775 |
10,216 |
11,620 |
6,719 |
6,005 |
| |
|
|
|
(0.5) |
|
(33.3) |
|
(13.7) |
|
(-10.6) |
Equipment Leasing |
0 |
0 |
0 |
0 |
4 |
7 |
0 |
0 |
72 |
47 |
| |
|
|
|
|
|
(83.2) |
|
|
|
-34.8 |
Hire Purchase |
0 |
0 |
0 |
0 |
0 |
13 |
3 |
2 |
35 |
28 |
| |
|
|
|
|
|
|
|
(-33.3) |
|
(-19.7) |
Investment |
72 |
0 |
0 |
0 |
82 |
0 |
0 |
0 |
204 |
0 |
Loan |
2,247 |
1,824 |
627 |
631 |
2,579 |
2770 |
2,835 |
1,444 |
7,723 |
8,291 |
| |
|
(-18.8) |
|
(0.7) |
|
7.4 |
|
-49.1 |
434.8 |
7.4 |
MNBC |
0 |
0 |
0 |
0 |
0 |
0 |
0 |
0 |
0 |
0 |
Total |
2,319 |
1,824 |
1,455 |
1,463 |
18,995 |
24,565 |
13,054 |
13,066 |
14,753 |
14,371 |
| |
|
(-21.4) |
|
(0.6) |
|
(29.3) |
|
(0.1) |
|
(-2.6) |
P : Provisional.
@ : Comprises (i) Foreign Government, (ii) Foreign Authority, and (iii) Foreign Citizen or Person
Note: Figures in parentheses are percentage variations over the previous year.
Source : Annual Returns. |
Table VI.25: Major Components of Assets of NBFCs-D by Classification of NBFCs |
(Amount in Rs. crore) |
Classification |
As at end-March |
Assets |
Advances |
Investment |
2008 |
2009 P |
2008 |
2009 P |
2008 |
2009 P |
1 |
2 |
3 |
4 |
5 |
6 |
7 |
Asset Finance |
50998 |
55115 |
42368 |
43607 |
4060 |
3545 |
| |
(68.4) |
(73.0) |
(79.3) |
(75.4) |
(36.2) |
(23.9) |
Equipment Leasing |
162 |
156 |
92 |
65 |
48 |
41 |
| |
(0.2) |
(0.2) |
(0.2) |
(0.1) |
(0.4) |
(0.3) |
Hire Purchase |
178 |
194 |
136 |
153 |
40 |
6390 |
| |
(0.2) |
(0.3) |
(0.3) |
(0.3) |
(0.4) |
(43.1) |
Investment |
402 |
- |
146 |
– |
256 |
– |
| |
(0.5) |
(0.0) |
(0.3) |
|
(2.3) |
|
Loan |
22819 |
20051 |
10653 |
13480 |
6807 |
4837 |
| |
(30.6) |
(26.6) |
(20.0) |
(23.5) |
(60.7) |
(32.7) |
MNBCs |
3 |
– |
2 |
– |
0 |
– |
| |
(0.0) |
|
(0.0) |
|
(0.0) |
|
Total |
74562 |
75516 |
53397 |
57305 |
11211 |
14813 |
P : Provisional.
Note : Figures in parentheses are percentages to respective totals.
Source : Annual Returns. |
Distribution of NBFCs-D According to Asset Size
6.58 The asset size of NBFCs varies
significantly between less than Rs.25 lakh to
above Rs.500 crore. The asset holding pattern
remained skewed in 2008-09, with 12 NBFCs
with asset size of ‘above Rs.500 crore’ holding
95.8 per cent of total assets of all NBFCs, while
the remaining 263 NBFCs held about 4.2 per cent
of total assets at end-March 2009 (Table VI.26)
Distribution of Assets of NBFCs – Type of Activity
6.59 During the year 2008-09, assets held in
the form of investments and loans and inter
corporate deposits witnessed a robust growth.
While growth in assets in the form of hire
purchase moderated considerably, equipment
leasing assests and other assets witnessed sharp
decline during 2008-09. The hire purchase activity
continued to constitute the largest share (47.2 per
cent) in total assets, followed by loans and inter
corporate deposits (27.9 per cent) and
investments (19.6 per cent) (Table VI.27).
Financial Performance of NBFCs
6.60 Financial performance of NBFCs in
terms of income and net profit improved during 2008-09. Both fund based income (16.9 per cent) and fee based income (46.0 per cent) registered robust growth. While growth in expenditure decelerated over the previous year, it, however, witnessed higher growth than income resulting in decline in operating profit by 2.2 per cent. Net profit registered a moderate growth mainly due to lower provisioning for tax. The cost to income ratio deteriorated from 68.9 per cent 2007-08 to 74.1 per cent in 2008-09 (Table VI.28).
Table VI.26: Assets of NBFCs-D by Asset-Size Ranges |
(Amount in Rs. crore) |
Asset-Size |
As at end-March |
No. of reporting companies |
Assets |
2007-08 |
2008-09P |
2007-08 |
2008-09 |
1 |
2 |
3 |
4 |
5 |
Less than 0.25 crore |
40 |
2 |
4 |
0 |
| |
|
|
(0.0) |
(0.0) |
More than 0.25 crore |
28 |
19 |
11 |
7 |
and upto 0.50 crore |
|
|
(0.0) |
(0.0) |
More than 0.50 crore |
119 |
107 |
133 |
118 |
and upto 2 crore |
|
|
(0.2) |
(0.2) |
More than 2 crore |
91 |
85 |
385 |
383 |
and upto 10 crore |
|
|
(0.5) |
(0.5) |
More than 10 crore |
38 |
36 |
779 |
783 |
and upto 50 crore |
|
|
(1.0) |
(1.0) |
More than 50 crore |
10 |
10 |
620 |
649 |
and upto 100 crore |
|
|
(0.8) |
(0.9) |
More than 100 crore |
9 |
4 |
2,055 |
1,263 |
and upto 500 crore |
|
|
(2.8) |
(1.7) |
Above 500 crore |
15 |
12 |
70,575 |
72,313 |
| |
|
|
(94.7) |
(95.8) |
Total |
350 |
275 |
74,562 |
75,516 |
P : Provisional.
Note : Figures in parentheses are percentages to respective total.
Source : Annual Returns. |
Table VI.27: Assets of NBFCs-D by Activity |
(Amount in Rs. crore) |
Activity |
As at end-March |
Percentage Variation |
2007-08 |
2008-09 P |
2007-08 |
2008-09 |
1 |
2 |
3 |
4 |
5 |
Loans and Intercorporate deposits |
18,823 |
21,073 |
70.2 |
12.0 |
| |
(25.2) |
(27.9) |
|
|
Investments |
11,210 |
14,813 |
51.2 |
32.1 |
| |
(15.0) |
(19.6) |
|
|
Hire Purchase |
33,525 |
35,647 |
27.9 |
6.3 |
| |
(45.0) |
(47.2) |
|
|
Equipment and Leasing |
1,048 |
585 |
-45.6 |
-44.2 |
| |
(1.4) |
(0.8) |
|
|
Bills |
13 |
23 |
85.7 |
76.9 |
| |
(0.0) |
(0.0) |
|
|
Other assets |
9,944 |
3,375 |
219.4 |
-66.1 |
| |
(13.3) |
(4.5) |
|
|
Total |
74,563 |
75,516 |
53.6 |
1.3 |
P : Provisional
Note : Figures in parentheses are percentages to respective total.
Source : Annual Returns. |
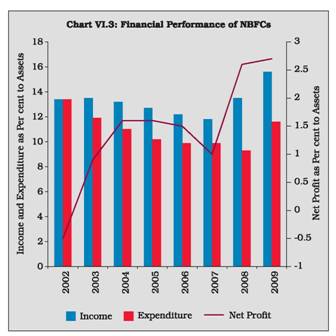
6.61
Non-interest cost at 97.6 percent continued to constitute the dominant share in total cost of the NBFCs during 2008-09. Concomitantly, the interest cost constituted a smaller share of the total cost (Table VI. 29).
6.62
Expenditure (including provisions) as a percentage of assets witnessed a rise during 2008-09. However, income as a percentage of assets increased at a higher pace resulting in a rise in the net profits to asset ratio (Chart VI.3).
Soundness Indicators: Asset Quality of NBFCs-D
6.63 In contrast to the trend during the last
few years, Gross NPA ratio increased to 2.7 per cent during 2008-09 from 2.1 per cent in 2007-08. Net NPA remained negative with provisions exceeding NPA at end-March 2009 (Table VI.30).
Table VI.28: Financial Performance of NBFCs-D |
(Amount in Rs. crore) |
Indicator |
As at end-March |
Percentage Variation |
2008 |
2009 P |
2007-08 |
2008-09 |
1 |
2 |
3 |
4 |
5 |
A. |
Income (i+ii) |
10,038 |
11,799 |
75.5 |
17.5 |
| |
(i) |
Fund Based |
9,832 |
11,498 |
75.9 |
16.9 |
| |
|
|
(98.0) |
(97.0) |
|
|
| |
(ii) |
Fee-Based |
206 |
301 |
57.4 |
46.0 |
| |
|
|
(2.0) |
(3.0) |
|
|
B. |
Expenditure (i+ii+iii) |
6,913 |
8,742 |
43.1 |
26.5 |
| |
(i) |
Financial |
4,525 |
5,641 |
63.7 |
24.7 |
| |
|
|
(60.0) |
(66.0) |
|
|
| |
|
of which |
|
|
|
|
| |
|
Interest Payment |
226 |
211 |
-55.5 |
-6.6 |
| |
|
|
(6.0) |
(2.3) |
|
|
| |
(ii) |
Operating |
2,178 |
2,369 |
72.7 |
8.8 |
| |
|
|
(30.5) |
(27.6) |
|
|
| |
(iii) |
Others |
210 |
732 |
-73.9 |
248.6 |
| |
|
|
(3.4) |
(4.1) |
|
|
C. |
TAX Provisions |
1,213 |
1,002 |
215.1 |
-17.4 |
D. |
Operating Profit (PBT) |
3,125 |
3,057 |
251.1 |
-2.2 |
E. |
Net Profit (PAT) |
1,912 |
2,055 |
279.4 |
7.5 |
F. |
Total Assets |
74,562 |
75,516 |
53.6 |
1.3 |
G. |
Financial Ratios
(as percentage to Total Assets) |
|
|
|
|
| |
i) |
Income |
13.5 |
15.6 |
|
|
| |
ii) |
Fund Based Income |
97.9 |
15.2 |
|
|
| |
iii) |
Fee Based Income |
0.3 |
0.4 |
|
|
| |
iv) |
Expenditure |
9.3 |
11.6 |
|
|
| |
v) |
Financial Expenditure |
6.1 |
7.5 |
|
|
| |
vi) |
Operating Expenditure |
2.9 |
3.1 |
|
|
| |
vii) |
Tax Provision |
1.6 |
1.3 |
|
|
| |
viii) |
Net Profit |
2.6 |
2.7 |
|
|
H. |
Cost to Income Ratio |
68.9 |
74.1 |
|
|
P : Provisional.
Note: Figures in parentheses are percentages to respective total.
Source: Annual Returns. |
Table VI.29: Interest Cost of NBFCs-D |
(Amount in Rs. crore) |
End-March |
Total Income |
Total Cost |
Interest Cost |
Non-Interest Cost |
1 |
2 |
3 |
4 |
5 |
2007-08 |
10,038 |
6,913 |
226 |
6,687 |
2008-09 P |
11,799 |
8,742 |
211 |
8,531 |
P : Provisional.
Note: Figures in parentheses are percentages to respective total.
Source: Annual Returns. |
 6.64 Gross NPAs (as percentage of gross advances) of asset finance companies, equipment leasing companies and investment companies and hire purchase companies declined during 2008-09. Net NPAs (as percentage of net advances) increased marginally in case of asset finance companies and hire purchase companies, while those of equipment leasing companies and investment companies decreased. NPAs of loan companies remained negative during 2008-09 also (Table VI.31).
6.65 Asset quality of various types of NBFCs
as reflected in various categories of NPAs
(substandard, doubtful and loss) shows that
there was sharp improvement in the asset
quality of equipment leasing companies and
deterioration in the asset quality of hire
purchase companies during 2008-09 over
previous year (Table VI.32).
Table VI.30 NPA Ratios of NBFCs-D |
(Per cent) |
End-March |
Gross NPAs to Gross Advances |
Net NPAs to Net Advances |
1 |
2 |
3 |
2001 |
11.5 |
5.6 |
2002 |
10.6 |
3.9 |
2003 |
8.8 |
2.7 |
2004 |
8.2 |
2.4 |
2005 |
5.7 |
2.5 |
2006 |
3.6 |
0.5 |
2007 |
2.2 |
0.2 |
2008 |
2.1 |
0* |
2009 P |
2.7 |
0* |
P : Provisional.
* : Provision exceeds NPA
Source: Half-Yearly Returns. |
Capital Adequacy Ratio
6.66 CRAR norms were made applicable to
NBFCs in 1998, in terms of which every deposit-
taking NBFC is required to maintain a minimum
capital, consisting of Tier-I and Tier-II capital,
of not less than 12 per cent (15 per cent in the
case of unrated deposit-taking loan/investment
companies) of its aggregate risk-weighted assets
and of risk-adjusted value of off-balance sheet
items. Total of Tier-II capital, at any point of
time, cannot exceed 100 per cent of Tier-I
capital. The number of NBFCs with less than
the minimum regulatory CRAR of 12 per cent
declined to 9 at end-March 2009 from 47 at end-
March 2008 (Table VI.33). At end-March 2009,
198 out of 207 NBFCs had CRAR of 12 per cent
or more as against 280 out of 327 NBFCs at
end-March 2008. The number of NBFCs with
CRAR more than 30 also declined to 168 at end-
March 2009 from 239 at end-March 2008.
Notwithstanding this, it is noteworthy that the
NBFC sector is witnessing a consolidation
process in the last few years, wherein the weaker
NBFCs are gradually exiting, paving the way for
a stronger NBFC sector.
6.67 NOF of NBFCs is the aggregate of paid-
up capital and free reserves, netted by (i) the
amount of accumulated losses; and (ii)
deferred revenue expenditure and other
intangible assets, if any, and adjusted by
investments in shares, and loans and advances
to (a) subsidiaries, (b) companies in the same
group, and (c) other NBFCs (in excess of 10 per cent of owned fund). Information on NOF can complement the information on CRAR. The ratio of public deposits to NOF in the case of loan companies and hire purchase declined during the year ended March 2009, while that of other category companies witnessed a marginal increase. The ratio of hire purchase companies continued to be negative because of negative NOF. The ratio of public deposits to NOF for all categories of NBFCs taken together was unchanged at 0.2 per cent at end-March 2009 (Table VI.34).
Table VI.31: NPAs of NBFCs-D by Classification of NBFCs |
(Amount in Rs. crore) |
Classification End-March |
Gross Advances |
Amount |
Gross NPAs
Per cent to
Gross
Advances |
Per cent to Assets |
Net Advances |
Amount |
Net NPAs
Per cent to
Net
Advances |
Per cent to Assets |
1 |
2 |
3 |
4 |
5 |
6 |
7 |
|
8 |
Asset Finance |
|
|
|
|
|
|
|
|
2007 |
11,824 |
262 |
2.2 |
2.2 |
11,548 |
-14 |
-0.1 |
-0.1 |
2008 |
37,233 |
652 |
1.8 |
1.7 |
36,609 |
28 |
0.1 |
0.1 |
2009 P |
34,240 |
573 |
1.7 |
1.6 |
34,023 |
356 |
1.0 |
1.0 |
Equipment Leasing |
|
|
|
|
|
|
|
|
2004 |
3,306 |
582 |
17.6 |
13.3 |
3,067 |
344 |
11.2 |
7.8 |
2005 |
4,187 |
514 |
12.3 |
11.0 |
4,018 |
345 |
8.6 |
7.4 |
2006 |
2,878 |
69 |
2.4 |
2.2 |
2,786 |
-23 |
-0.8 |
-0.7 |
2007 |
1,057 |
45 |
4.2 |
4.0 |
992 |
-20 |
-1.9 |
-1.8 |
2008 |
26 |
6 |
24.3 |
7.2 |
-10 |
-29 |
293.6 |
-34.2 |
2009 P |
26 |
2 |
7.7 |
2.5 |
4 |
-20 |
-491.2 |
-24.6 |
Hire Purchase |
|
|
|
|
|
|
|
|
2004 |
10,437 |
942 |
9.0 |
7.3 |
9,748 |
253 |
2.6 |
2.0 |
2005 |
15,900 |
610 |
3.8 |
3.6 |
15,544 |
253 |
1.6 |
1.5 |
2006 |
17,607 |
444 |
2.5 |
2.4 |
17,238 |
74 |
0.4 |
0.4 |
2007 |
18,280 |
464 |
2.5 |
2.3 |
17,884 |
67 |
0.4 |
0.3 |
2008 |
324 |
158 |
48.8 |
43.8 |
244 |
78 |
32.0 |
21.6 |
2009 P |
205 |
138 |
67.6 |
61.8 |
133 |
67 |
50.1 |
29.8 |
Investment |
|
|
|
|
|
|
|
|
2004 |
63 |
15 |
23.8 |
2.6 |
55 |
7 |
12.7 |
1.2 |
2005 |
58 |
10 |
17.2 |
1.8 |
58 |
10 |
18.0 |
1.8 |
2006 |
59 |
0 |
0.4 |
0.0 |
59 |
0 |
0.4 |
0.0 |
2007 |
31 |
1 |
2.8 |
0.1 |
31 |
1 |
2.8 |
0.1 |
2008 |
732 |
108 |
14.8 |
7.7 |
732 |
108 |
14.8 |
7.7 |
2009 P |
1,729 |
87 |
5.0 |
3.6 |
1,729 |
87 |
5.0 |
3.6 |
Loan |
|
|
|
|
|
|
|
|
2004 |
2,038 |
142 |
7.0 |
4.1 |
1,833 |
-63 |
-3.4 |
-1.8 |
2005 |
1,955 |
117 |
6.0 |
5.1 |
1,772 |
-65 |
-3.7 |
-2.8 |
2006 |
690 |
252 |
36.5 |
19.3 |
483 |
45 |
9.3 |
3.4 |
2007 |
7,594 |
124 |
1.6 |
5.9 |
7,463 |
-6 |
-0.1 |
-0.3 |
2008 |
16,631 |
132 |
0.8 |
0.6 |
10,832 |
-5,667 |
-52.3 |
-27.6 |
2009 P |
15,039 |
547 |
3.6 |
3.6 |
10,148 |
-4,344 |
-42.8 |
-28.3 |
P : Provisional.
Source : Half-Yearly Returns. |
Table VI.32: Classification of Assets of NBFCs-D by Classification of NBFCs |
(Amount in Rs. crore) |
Classification/ End-March |
Standard Assets |
Sub-Standard Assets |
Doubtful Assets |
Loss Assets |
Gross NPAs |
Gross Advances |
1 |
2 |
3 |
4 |
5 |
6 |
7 |
Asset Finance |
|
|
|
|
|
|
2007 |
11,562 |
242 |
17 |
3 |
262 |
11,824 |
| |
(97.8) |
(2.1) |
(0.1) |
(0.0) |
(2.2) |
(100.0) |
2008 |
36,581 |
584 |
41 |
27 |
652 |
37,233 |
| |
(98.2) |
(1.6) |
(0.1) |
(0.1) |
(1.8) |
(100.0) |
2009P |
33,667 |
520 |
35 |
18 |
573 |
34,240 |
| |
(98.3) |
(1.5) |
(0.1) |
(0.1) |
(1.7) |
(100.0) |
Equipment Leasing |
|
|
|
|
|
|
2006 |
2,809 |
12 |
21 |
36 |
69 |
2,878 |
| |
(97.6) |
(0.4) |
(0.7) |
(1.2) |
(2.4) |
(100.0) |
2007 |
1,013 |
4 |
2 |
38 |
45 |
1,057 |
| |
(95.8) |
(0.4) |
(0.2) |
(3.6) |
(4.3) |
(100.0) |
2008 |
19 |
1 |
1 |
4 |
6 |
26 |
| |
(75.7) |
(4.7) |
(4.5) |
(15.0) |
(24.3) |
(100.0) |
2009P |
24 |
0 |
1 |
1 |
2 |
26 |
| |
(92.3) |
(1.1) |
(2.6) |
(3.9) |
(7.7) |
(100.0) |
Hire Purchase |
|
|
|
|
|
|
2006 |
17,163 |
184 |
47 |
212 |
444 |
17,607 |
| |
(97.5) |
(1.0) |
(0.3) |
(1.2) |
(2.5) |
(100.0) |
2007 |
17,817 |
194 |
81 |
188 |
464 |
18,280 |
| |
(97.5) |
(1.1) |
(0.4) |
(1.0) |
(2.5) |
(100.0) |
2008 |
166 |
7 |
7 |
144 |
158 |
324 |
| |
(51.2) |
(2.0) |
(2.3) |
(44.4) |
(48.8) |
(100.0) |
2009P |
66 |
4 |
3 |
131 |
138 |
205 |
| |
(32.4) |
(1.8) |
(1.6) |
(64.2) |
(67.6) |
(100.0) |
Investment |
|
|
|
|
|
|
2006 |
59 |
0 |
0 |
0 |
0 |
59 |
| |
(99.6) |
(0.0) |
(0.2) |
(0.2) |
(0.4) |
(100.0) |
2007 |
31 |
1 |
0 |
0 |
1 |
31 |
| |
(97.2) |
(2.8) |
(0.0) |
(0.0) |
(2.8) |
(100.0) |
2008 |
624 |
100 |
8 |
0 |
108 |
732 |
| |
(85.2) |
(13.7) |
(1.1) |
(0.0) |
(14.8) |
(100.0) |
2009P |
1,643 |
38 |
49 |
0 |
87 |
1,729 |
| |
(95.0) |
(2.2) |
(2.8) |
(0.0) |
(5.0) |
(100.0) |
Loan |
|
|
|
|
|
|
2006 |
438 |
19 |
99 |
134 |
252 |
690 |
| |
(63.5) |
(2.7) |
(14.3) |
(19.4) |
(36.5) |
(100.0) |
2007 |
7,470 |
9 |
91 |
24 |
124 |
7,594 |
| |
(98.4) |
(0.1) |
(1.2) |
(0.3) |
(1.6) |
(100.0) |
2008 |
16,499 |
22 |
81 |
29 |
132 |
16,631 |
| |
(99.2) |
(0.1) |
(0.5) |
(0.2) |
(0.8) |
(100.0) |
2009P |
14,492 |
465 |
66 |
16 |
547 |
15,039 |
| |
(96.4) |
(3.1) |
(0.4) |
(0.1) |
(3.6) |
(100.0) |
P : Provisional.
Note : Figures in parentheses are percentages to credit-exposures
Source : Half-Yearly Returns. |
Table VI.33: Capital Adequacy Ratio of NBFCs-D |
(Per cent) |
CRAR Range |
As at end-March |
2007-08 |
2008-09 P |
AFC |
EL |
HP |
LC/IC |
Total |
AFC |
EL |
HP |
LC/IC |
Total |
1 |
2 |
3 |
4 |
5 |
6 |
7 |
8 |
9 |
10 |
11 |
1) |
Less than 12 per cent (a+b) |
19 |
4 |
15 |
9 |
47 |
0 |
2 |
4 |
3 |
9 |
| |
a) Less than 9 per cent |
4 |
4 |
15 |
9 |
32 |
0 |
2 |
3 |
3 |
8 |
| |
b) More than 9 and up to 12 per cent |
0 |
0 |
0 |
0 |
0 |
0 |
0 |
0 |
0 |
0 |
2) |
More than 12 and up to 15 per cent |
3 |
0 |
0 |
1 |
4 |
3 |
0 |
0 |
0 |
3 |
3) |
More than 15 and up to 20 per cent |
5 |
0 |
0 |
3 |
8 |
4 |
0 |
0 |
2 |
6 |
4) |
More than 20 and up to 30 per cent |
25 |
0 |
1 |
3 |
29 |
17 |
0 |
2 |
2 |
21 |
5) |
Above 30 per cent |
117 |
10 |
66 |
46 |
239 |
99 |
8 |
34 |
26 |
168 |
Total |
169 |
14 |
82 |
62 |
327 |
123 |
10 |
40 |
33 |
207 |
AFC : Asset Finance Company. EL : Equipment Leasing. HP : Hire Purchase. LC/IC : Loan Companies/ Investment Companies.
P : Provisional
Source: Half-Yearly Returns. |
6.68 NOF of NBFCs range from less than Rs.25 lakh to above Rs.500 crore. Public deposits, as ratio of NOF, held by NBFCs in the category of NOF of up to 25 lakh and ‘more than Rs.25 lakh and and up to Rs.2 crore’ declined, while the ratio of ‘more than 10 crore up to 50 crore’ and ‘more than 100 crore and up to 500 crore’ registered a rise. NBFCs in all other ranges of NOF generally remained constant (Table VI.35).
Table VI.34: Net Owned Fund vis-à-vis Public Deposits of NBFCs-D |
(Amount in Rs. crore) |
Classification |
As at end-March |
Net Owned Funds |
Public Deposits |
|
2008 |
2009 P |
2008 |
2009 P |
1 |
2 |
3 |
4 |
5 |
Asset Finance |
6,939 |
7,632 |
1,161 |
1,364 |
| |
|
|
(0.2) |
(0.2) |
Equipment Leasing |
-50 |
10 |
10 |
3 |
| |
|
|
-(0.2) |
(0.3) |
Hire Purchase |
-76 |
-72 |
169 |
186 |
| |
|
|
-(2.2) |
-(2.6) |
Investment |
83 |
0 |
19 |
- |
| |
|
|
(0.2) |
|
Loan |
3,306 |
4,018 |
682 |
388 |
| |
|
|
(0.2) |
(0.1) |
MNBC |
1 |
- |
1 |
- |
Total |
10,203 |
11,588 |
2,042 |
1,941 |
| |
|
|
(0.2) |
(0.2) |
P : Provisional.
Note: Figures in parentheses are ratio of public deposits to net owned fund.
Source: Annual Returns. |
Residuary Non-Banking Companies (RNBCs)
6.69
Assets of the RNBCs declined by 17.3 per cent during the year ended March 2009. Their assets in the form of unencumbered approved securities registered a sharp rise, while those in bonds/debentures and fixed deposits/ certificates of deposit of SCBs recorded a decline. NOF of RNBCs increased by 8.9 per cent during 2008-09 on top of the rise of 25.8 per cent witnessed during 2007-08 (Table VI.36).
6.70
The increase in income of RNBCs during 2008-09 was less than the increase in expenditure, as a result of which the operating profit of RNBCs declined during the year. The provision for taxation also registered a fall. As a result, net profit of RNBCs declined by 33.7 per cent during 2008-09 as against the increase of 406.8 per cent during 2007-08.
Regional Pattern of Deposits of RNBCs
6.71 Of the two RNBCs, one is based in the
Eastern region (Kolkata) and the other in the Central region. The RNBCs are in the process of migrating to other business models as agreed upon and the companies would reduce their deposit liabilities to ‘nil’ by 2015. Concomitantly, the public deposits held by the two RNBCs registered a decline. Only one RNBC has headquarters in a metropolitan city, i.e., Kolkata (Table VI.37).
Table VI.35: Range of Net Owned Fund vis-à-vis Public Deposits of NBFCs-D |
(Amount in Rs. crore) |
Ranges of Net Owned Fund |
As at end-March |
2007-08 |
2008-09 P |
No. of Companies |
Net Owned Funds |
Public Deposits |
No. of Companies |
Net Owned Funds |
Public Deposits |
1 |
2 |
3 |
4 |
5 |
6 |
7 |
1. |
Upto 0.25 crore |
18 |
-552 |
178 |
3 |
-201 |
153 |
| |
|
|
|
-(0.3) |
|
|
-(0.8) |
2. |
More than 0.25 crore and up to 2 crore |
231 |
167 |
91 |
172 |
126 |
48 |
| |
|
|
|
(0.5) |
|
|
(0.4) |
3. |
More than 2 crore and up to 10 crore |
63 |
267 |
136 |
66 |
249 |
133 |
| |
|
|
|
(0.5) |
|
|
(0.5) |
4. |
More than 10 crore and up to 50 crore |
21 |
440 |
145 |
20 |
358 |
158 |
| |
|
|
|
(0.3) |
|
|
(0.4) |
5. |
More than 50 crore and up to 100 crore |
3 |
226 |
91 |
2 |
127 |
45 |
| |
|
|
|
(0.4) |
|
|
(0.4) |
6. |
More than 100 crore and up to 500 crore |
7 |
1,507 |
636 |
4 |
649 |
389 |
| |
|
|
|
(0.4) |
|
|
(0.6) |
7. |
Above 500 crore |
7 |
8,148 |
764 |
8 |
10,280 |
1,015 |
| |
|
|
|
(0.1) |
|
|
(0.1) |
Total |
350 |
10,203 |
2,041 |
255 |
11,588 |
1,941 |
| |
|
|
|
(0.2) |
|
|
(0.2) |
P : Provisional.
Note : Figures in parentheses are Public Deposit as ratio of respective Net Owned Fund.
Source : Annual Returns. |
Investment Pattern of RNBCs
6.72 The investment pattern of RNBCs as prescribed in the Residuary Non-Banking (Reserve Bank) Directions, 1987 was reviewed and modified on March 31, 2006. The aggregate liability to depositor (ALD) was bifurcated under two heads, viz., ALD as on December 31, 2005 and incremental ALDs. Incremental ALDs are the liabilities to the depositors exceeding the aggregate amount of the liabilities to the depositors as on December 31, 2005. RNBCs were advised to invest, with effect from April 1,2006, not less than 95 per cent of the ALD as on December 31, 2005 and the entire incremental ALD in the prescribed manner. RNBCs were also advised that on and from April 1, 2007, the entire amount of ALD would be invested in directed investments only and no discretionary investment would be allowed to be made by them.
6.73 ALD declined by 12.3 per cent during
2008-09. While fixed deposits with banks and
bonds and debentures declined, unencumbered
approved securities and other investments
registered a rise (Table VI.38).
Non-Deposit Taking Systemically Important Non-Banking Finance Companies (NBFCs-ND-SI)
6.74 The turbulence in the international
financial markets in 2008 also affected the
domestic financial sector including the NBFC
Sector, particularly a few NBFCs-ND-SI. These entities have been financing long term assets with short term commercial paper and non- convertible debentures which were subscribed to mainly by MFs. Such NBFCs-ND-SI faced difficulties as MFs were not in a position to roll over these instruments during the crisis period.
Table VI.36: Profile of RNBCs |
(Amount in Rs. crore) |
Item |
As at end-March |
Percentage Variation |
2007-08 |
2008-09 P |
2007-08 |
2008-09 |
1 |
2 |
3 |
4 |
5 |
A. |
Assets (I to V) |
24,452 |
20,211 |
5.5 |
-17.3 |
| |
(i) |
Investment in Unencumbered Approved Securities |
3,137 |
5,247 |
-5.4 |
67.3 |
| |
(ii) |
Investment in Fixed deposits/Certificates of Deposits of Scheduled Commercial Banks/Public Financial Institutions |
6,562 |
5,999 |
17.1 |
-8.6 |
| |
(iii) |
Debentures/Bonds/Commercial Papers of Govt. Companies/ Public Sector Banks/Public Financial Institution/Corporation |
12,320 |
6,993 |
5.3 |
-43.2 |
| |
(iv) |
Other investments |
573 |
299 |
-50.4 |
-47.8 |
| |
(v) |
Other Assets |
1,860 |
1,743 |
33.5 |
-6.3 |
B. |
Net Owned Funds |
1,718 |
1,870 |
25.8 |
8.9 |
C. |
Total Income (i+ii) |
2,326 |
2,416 |
22.9 |
3.8 |
| |
(i) |
Fund Income |
2,303 |
2,315 |
22.1 |
0.5 |
| |
(ii) |
Fee Income |
23 |
101 |
182.6 |
346.0 |
D. |
Total Expenses (i+ii+iii) |
1,725 |
2,069 |
4.7 |
19.9 |
| |
(i) |
Financial Cost |
1,322 |
1,604 |
7.5 |
21.3 |
| |
(ii) |
Operating Cost |
329 |
379 |
15.5 |
15.4 |
| |
(iii) |
Other cost |
74 |
86 |
-44.8 |
16.2 |
E. |
Taxation |
224 |
149 |
409.6 |
-33.7 |
F. |
Operating Profit (PBT) |
601 |
347 |
144.3 |
-42.3 |
G. |
Net profit (PAT) |
377 |
198 |
87.3 |
-47.4 |
P : Provisional. PBT : Profit Before Tax. PAT : Profit After Tax. Source: Annual Return. |
Table VI.37: Public Deposit Held by RNBCs -Region-wise |
(Amount in Rs. crore) |
Region |
As at end-March |
2008 |
2009P |
No. of RNBCs |
Amount |
No. of RNBCs |
Amount |
1 |
2 |
3 |
4 |
5 |
Central |
1 |
18,056 |
1 |
15,672 |
| |
|
(80.8) |
|
(79.9) |
Eastern |
1 |
4,303 |
1 |
3,935 |
| |
|
(19.2) |
|
(20.1) |
North-Eastern |
- |
- |
- |
- |
Northern |
- |
- |
- |
- |
Southern |
- |
- |
- |
- |
Western |
- |
- |
- |
- |
Total |
2 |
22,358 |
2 |
19,607 |
Metropolitan Cities: |
|
|
|
|
Chennai |
- |
- |
- |
- |
Kolkata |
1 |
4,303 |
1 |
3,935 |
Mumbai |
- |
- |
- |
- |
New Delhi |
- |
- |
- |
- |
Total |
1 |
4,303 |
1 |
3,935 |
– : Nil/ Negligible. P : Provisional.
Note : Figures in parentheses are percentages to respective totals.
Source : Annual Return. |
Table VI.38: Investment Pattern of RNBCs |
(Amount in Rs. crore) |
End- March |
|
2007-08 |
2008-09 P |
1 |
2 |
3 |
Aggregated Liabilities to the Depositors (ALD) |
22,358 |
19,607 |
(i) |
Unencumbered approved securities |
3,137 |
5,247 |
| |
|
(14.0) |
(26.8) |
(ii) |
Fixed Deposits with banks |
6,562 |
5,999 |
| |
|
(29.3) |
(30.6) |
(iii) |
Bonds or debentures or |
12,320 |
6,993 |
| |
commercial papers of a Govt. company/ public sector bank/ public financial institution/ corporations |
(55.1) |
(35.7) |
(iv) |
Other investments |
573 |
299 |
| |
|
(2.6) |
(1.5) |
P : Provisional.
Note : Figures in parentheses are percentages to ALDs.
Source : Annual Return. |
There were also reports that banks which have sanctioned credit facilities were not willing to release funds in the wake of financial turbulence.
6.75 The Reserve Bank initiated discussions with a large number of NBFCs-ND-SI in October and November 2008 and studied their balance sheets to examine liquidity issues, if any, faced by them. As long as there was liquidity in the market, rolling over of CPs was smooth but when the market including the CP market became illiquid, rollover became a problem, resulting in redemption pressures as most of the assets were long term and quick unwinding was not possible. Though only a few large NBFCs had such liquidity issues, the general lack of confidence encompassed the whole sector leading to banks’ refusal to lend / rollover sanctioned lines of credit. The Reserve Bank’s timely and adequate liquidity interventions could address these problems. Details of measures are provided in Box VI.1.
6.76 In terms of extant Reserve Bank of India regulations, all NBFCs with assets size of Rs 100 crore and above, and not accepting / holding public deposits (NBFCs-ND-SI) are required to submit a Monthly Return on Important Financial Parameters to RBI. Once an NBFC reaches an asset size of Rs.100 crore or above, it comes under the regulatory requirement for NBFCs-ND-SI as stated above, despite not having such assets as on the date of last balance sheet. The NBFCs-ND-SI raise funds mainly by way of issuing debentures, borrowing from banks and FIs, commercial papers etc. In the recent past they have witnessed significant growth in terms of number as well as size.
Box VI.1: Measures by the Reserve Bank in view of the Financial Stress faced by NBFCs
The measures undertaken by the Reserve Bank in respect of NBFCs sector following the financial crisis were as follows :
i) NBFCs-ND-SI were permitted as a temporary measure to raise short- term foreign currency borrowings under the approval route subject to fulfillment of certain conditions. While the resources raised were to be used only for refinancing of short-term liabilities and not for creation of fresh assets, it was also advised that the maturity of such borrowing should not exceed three years and the maximum amount should not exceed 50 per cent of the NOF or USD 10 million (or its equivalent), whichever was higher. Eleven companies were granted permission under the facility to borrow funds to the tune of US$ 834.95 million + foreign currency equivalent of Rs 1,566.38 crore (not availed of) out of which seven have borrowed so far to the extent of US$ 645.58 million.
ii) Banks were permitted, on a temporary basis, to avail of liquidity support under the LAF window through relaxation in maintenance of SLR to the extent of up to 1.5 per cent of their NDTL, exclusively for meeting the funding requirements of NBFCs and mutual funds.
iii) The risk weight on banks’ exposure to NBFCs-ND-SI was reduced to 100 per cent from 125 per cent irrespective of credit rating, while exposure to AFCs which attracted risk weight of 150 per cent was also reduced to 100 per cent.
iv) NBFCs-ND-SI were permitted to augment their capital funds by issue of Perpetual Debt Instruments. The amount of PDI raised by NBFCs-ND-SI would not be treated as ‘public deposit’ within the meaning of Reserve Bank directives.
v) Deferred the proposed increase in the CRAR to be maintained by NBFCs-ND-SI to 12 per cent and subsequently to 15 per cent by one year, i.e. 12 per cent by March 31, 2010 and 15 per cent by March 31, 2011.
vi) Provided direct lending facility as a Lender of Last Resort (LOLR) where RBI lends to NBFCs-ND-SI against their rated CPs through a SPV by subscribing to its bonds. The facility was operationalised in January 2009 through an SPV called ‘IDBI SASF Trust’ to provide liquidity support against investment grade paper of NBFCs, subject to their fulfilling certain conditions. It was designed as a LOLR facility to facilitate an orderly downsizing of balance sheet of financially sound NBFCs which faced short term temporary liquidity requirement. The facility has been availed by only one NBFC so far which has drawn Rs.1,040 crore under the scheme and there is no outstanding balance as on date. Government of India had extended the facility to be available for any paper issued till September 30, 2009 and the SPV would cease to make fresh purchases after December 31, 2009 and would recover all dues by March 31, 2010.
Composition of Liabilities
6.77 Liabilities of NBFCs-ND-SI can be classified into (i) Owned Fund, (ii) Borrowings, and (iii) Other Liabilities. Borrowings comprise (i) Debentures, (ii) Loans from banks, (iii) Commercial paper (CPs), (iv) Inter-Corporate Loans (ICLs or ICDs), and (v) Others. The consolidated balance sheet size of NBFCs-ND-SI as at end March 2009 stood at Rs.4,94,673 crore as compared to Rs.4,08,705 crore at end March 2008 recording a growth of 27.3 per cent. Significant increase in balance sheet size of NBFCs-ND-SI during the period ended March 2009 is mainly attributed to sharp increase in owned funds, debentures and other liabilities (Table VI.39).
6.78
Owned funds increased by 27.3 per cent and formed 28.3 per cent of total liabilities during the month ended March 2009. Debentures issued by NBFCs-ND-SI increased by 28.3 per cent during the year ended March 2009 and accounted for 23.0 per cent of total liabilities as compared with 21.7 per cent in the previous year. The share of borrowings from banks and FIs declined marginally to 18.5 per cent at end-March 2009 as compared with 19.8 per cent in the previous year. In contrast, intercorporate borrowings declined by 36.7 per cent and formed only 2.8 per cent of total liabilities as at end-March 2009. Borrowings by way of commercial paper constituted 4.5 per cent of total liabilities and increased by 11.6 per cent during the year under review. Others, mainly comprising interest accrued and other borrowings, constituted 15.2 per cent of total liabilities and increased by 30.4 per cent during the year ended March 2009. Leverage ratio decreased marginally and stood at 2.5 as at end-March 2009.
6.79
Secured loans increased by 22.5 per cent and constituted 30 per cent of total liabilities during the period ended March 2009 whereas unsecured loans increased by 13.8 per cent and accounted for slightly higher at 34.6 per cent of total liabilities during the same period (Table VI.39).
Table VI.39 : Sources of Funds of NBFCs-ND-SI |
(Amount Rs. crore) |
Item |
March 2008 |
March 2009 |
Percentage Variation |
1 |
2 |
3 |
4 |
Owned Fund |
1,10,118 |
1,40,210 |
27.3 |
| |
(26.9) |
(28.3) |
|
Debentures |
88,871 |
1,14,018 |
28.3 |
| |
(21.7) |
(23.0) |
|
Borrowings from Banks and FIs |
80,961 |
91,527 |
13.1 |
| |
(19.8) |
(18.5) |
|
Inter-corporate loans |
22,019 |
13,937 |
-36.7 |
| |
(5.4) |
(2.8) |
|
Commercial paper |
20,068 |
22,392 |
11.6 |
| |
(4.9) |
(4.5) |
|
Loans from Relatives |
1,822 |
2,370 |
30.1 |
| |
(0.4) |
(0.5) |
|
Others |
57,547 |
75,064 |
30.4 |
| |
(14.1) |
(15.2) |
|
Current Liabilities & Provisions |
27,299 |
35,155 |
28.8 |
| |
(6.7) |
(7.1) |
|
Total Liabilities |
4,08,705 |
4,94,673 |
21.0 |
Memo Items: |
|
|
|
1. Secured Loans |
1,21,082 |
1,48,314 |
22.5 |
| |
(29.6) |
(30.0) |
|
2. Un-secured Loans |
1,50,206 |
1,70,994 |
13.8 |
| |
(36.8) |
(34.6) |
|
3. Leverage Ratio |
2.71 |
2.53 |
|
Note: Figures in the parentheses are percentages to total liabilities.
Source: Monthly Returns on NBFCs-ND-SI. |
6.80 Information based on the returns received from NBFCs-ND-SI for the year ended March 2009 showed an increase of 21.0 per cent in their liabilities/assets over the year ended March 2008. Unsecured loans continued to constitute the single largest source of funds for NBFCs-ND-SI, followed by secured loans and reserves and surplus (Table VI.40).
Borrowings
6.81 Total borrowings (secured and unsecured)
by NBFCs-ND-SI increased by 17.7 per cent to
Rs.3,19,308 crore during the year ended March
2009, constituting 64.5 per cent of their total
liabilities. During the quarter ended June 2009,
the total borrowings increased further by 3.4 per cent to Rs.3,30,288 crore (Table VI.41).
Table VI.40: Liabilities of NBFCs-ND-SI |
(Rs. crore) |
Item |
As at end |
|
March 2008 |
March 2009 |
June 2009 |
1 |
2 |
3 |
4 |
No. of Companies |
189 |
234 |
232 |
Total Liabilities |
4,08,705 |
4,94,673 |
5,08,026 |
Paid-up Capital |
24,490 |
30,173 |
30,358 |
| |
(6.0) |
(6.1) |
(6.0) |
Preference Shares |
4,573 |
4,311 |
3,835 |
| |
(1.1) |
(0.9) |
(0.8) |
Reserves & Surplus |
81,055 |
1,05,726 |
1,07,191 |
| |
(19.8) |
(21.4) |
(21.1) |
Secured Borrowings |
1,21,082 |
1,48,314 |
1,48,576 |
| |
(29.6) |
(30.0) |
(29.2) |
Un-Secured Borrowings |
1,50,206 |
1,70,994 |
1,81,712 |
| |
(36.8) |
(34.6) |
(35.8) |
Note: Figures in parentheses are percentages to Total Liabilities.
Source: Monthly Return on NBFCs-ND-SI. |
Deployment of Funds
6.82 The pattern of deployment of funds by
NBFCs-ND-SI during the year ended March
2009 remained broadly in line with the pattern
witnessed during the previous year. The secured
loans continued to constitute the largest share
(45.6 per cent), followed by unsecured loans
with a share of 23.2 per cent (Table VI.42).
Financial Performance
6.83 NBFCs-ND-SI earned a profit of Rs.11,850 crore during the year ended March 2009, which was higher by 36.1 per cent as compared with the profit earned during the year ended March 2008 (Rs.8,705 crore) (Table VI.43).
6.84
The gross NPAs to total assets ratio of NBFCs-ND-SI remained unchanged at 2.3 per cent for the year ended March 2009 but recorded a marginal increase for the quarter ended June 2009. The net NPAs to total assets ratio declined from 1.6 per cent as at end March 2008 to 0.7 per cent as at end March 2009, but increased to 0.9 per cent during the quarter ended June 2009 (Table VI.44).
Table VI.41:Borrowings by NBFCs-ND-SI |
(Rs. crore) |
Item |
As at end |
March 2008 |
March 2009 |
June 2009 |
1 |
2 |
3 |
4 |
No. of Companies |
189 |
234 |
232 |
A. |
Secured Borrowings |
1,21,082 |
1,48,314 |
1,48,576 |
| |
|
|
(44.6) |
(46.4) |
(45.0) |
| |
(i). |
Debentures |
44,439 |
49,078 |
49,530 |
| |
|
|
(16.4) |
(15.4) |
(15.0) |
| |
(ii) |
Loans from Banks |
25,774 |
35,571 |
38,300 |
| |
|
|
(9.5) |
(11.1) |
(11.6) |
| |
(iii) |
Loans from FIs |
5,988 |
6,038 |
6,543 |
| |
|
|
(2.2) |
(1.9) |
(20.0) |
| |
(iv) |
Interest accrued |
2,017 |
2,800 |
2,441 |
| |
|
|
(0.7) |
(0.9) |
(0.7) |
| |
(v). |
Others |
42,864 |
54,827 |
51,761 |
| |
|
|
(15.8) |
(17.2) |
(15.7) |
B. |
Un-Secured Borrowings |
1,50,206 |
1,70,994 |
1,81,712 |
| |
|
|
(55.4) |
(53.6) |
(55.0) |
| |
(i) |
Loans from Relatives |
1,822 |
2,370 |
2,210 |
| |
|
|
(0.7) |
(0.7) |
(0.7) |
| |
(ii) |
Inter-corporate Loans |
22,019 |
13,937 |
18,347 |
| |
|
|
(8.1) |
(4.4) |
(5.6) |
| |
(iii) |
Loans from banks |
46,243 |
43,880 |
43,464 |
| |
|
|
(17.0) |
(13.7) |
(13.2) |
| |
(iv) |
Loans from FIs |
2,956 |
6,038 |
6,543 |
| |
|
|
(1.1) |
(1.9) |
(2.0) |
| |
(v) |
Commercial Papers |
20,068 |
22,392 |
26,530 |
| |
|
|
(7.4) |
(7.0) |
(8.0) |
| |
(vi) |
Debentures |
44,432 |
64,940 |
67,971 |
| |
|
|
(16.4) |
(20.3) |
(20.6) |
| |
(vii) |
Interest Accrued |
1,819 |
3,167 |
3,692 |
| |
|
|
(0.7) |
(1.0) |
(1.1) |
| |
(viii) |
Others |
10,847 |
14,270 |
12,955 |
| |
|
|
(4.0) |
(4.5) |
(3.9) |
Memo Items: |
|
|
|
Total Borrowings |
2,71,288 |
3,19,308 |
3,30,288 |
Total Liabilities |
4,08,705 |
4,94,673 |
5,08,026 |
Note: Figures in parentheses are percentages to Total
Borrowings.
Source: Monthly Return on NBFCs-ND-SI. |
4. Primary Dealers
6.85 As at end-September 2009, there were 19 Primary Dealers, of which 11 were banks carrying on Primary Dealership business departmentally (Bank-PDs) and the remaining eight stand-alone Primary Dealers registered as NBFCs under section 45IA of the RBI Act, 1934 and engaged predominantly in the Government Securities business. Morgan Stanley India Primary Dealer Pvt. Ltd and Nomura Fixed Income Securities Pvt. Ltd. were given authorization to undertake Primary Dealership with effect from July 20, 2009 and September 7, 2009 respectively.
Table VI.42: Select Indicators on Application of Funds by NBFCs-ND-SI |
(Rs. crore) |
Item |
As at end |
|
March 2008 |
March 2009 |
June 2009 |
1 |
2 |
3 |
4 |
Secured Loans |
1,60,017 |
1,90,818 |
2,08,097 |
| |
(44.7) |
(45.6) |
(47.8) |
Un-Secured Loans |
88,783 |
97,287 |
90,556 |
| |
(24.8) |
(23.2) |
(20.8) |
Hire Purchase Assets |
29,832 |
36,051 |
37,017 |
| |
(8.3) |
(8.6) |
(8.5) |
Long-term Investments |
53,856 |
64,316 |
65,879 |
| |
(15.0) |
(15.4) |
(15.1) |
Current Investments |
25,758 |
30,360 |
33,670 |
| |
(7.2) |
(7.2) |
(7.7) |
Total |
3,58,246 |
4,18,832 |
4,35,219 |
Memo Items: |
|
|
|
Capital Market Exposure |
1,11,630 |
86,881 |
90,750 |
of which: |
|
|
|
Equity Shares |
35,957 |
39,437 |
39,301 |
Note: Figures in parentheses are percentages to Total.
Source: Monthly Return on NBFCs-ND-SI. |
Table VI.43: Financial Performance of NBFCs-ND-SI |
(Rs. crore) |
Item
|
As at end |
March 2008 |
March 2009 |
June 2009 |
1 |
2 |
3 |
4 |
Total Assets |
4,08,705 |
4,94,673 |
5,08,026 |
Total Income@ |
39,537 |
61,921 |
14,502 |
| |
(9.7) |
(12.5) |
(2.9) |
Total Expenses@ |
27,291 |
44,271 |
10,948 |
| |
(6.7) |
(8.9) |
(2.2) |
Net Profit@ |
8,705 |
11,850 |
2,373 |
| |
(2.1) |
(2.4) |
(0.5) |
@ : Cumulative
Note: Figures in parentheses are percentages to Total Assets.
Source: Monthly Return on NBFCs-ND-SI. |
Table VI.44: Gross and Net NPAs of NBFCs-ND-SI |
( Per cent) |
Item |
As at end |
|
March 2008 |
March 2009 |
June 2009 |
1 |
2 |
3 |
4 |
Gross NPA to Total Credit Exposure |
3.1 |
3.0 |
3.3 |
Net NPA to Total Credit Exposure |
2.0 |
1.0 |
1.1 |
Gross NPA to Total Assets |
2.3 |
2.3 |
2.5 |
Net NPA to Total Assets |
1.6 |
0.7 |
0.9 |
Source: Monthly Return on NBFCs-ND-SI. |
6.86 During the year 2008-09, many policy initiatives were taken to strengthen the PD system. First, in order to enable the PDs to raise more capital from the market through issue of subordinated debts, the extant ceiling of 200 basis points on the interest rate spreads at the time of issue of the subordinated instruments for the purpose of Tier II and Tier III capital requirements, was removed. Primary Dealers are now allowed to issue subordinated Tier II and Tier III bonds at coupon rates as decided by their Boards of Directors. Second, standalone PDs were allowed to hold up to 100 per cent of their paid up capital in Held- to- Maturity (HTM) category to insulate their financials from the price fluctuations caused during extreme stress times. Third, in the context of the Interest Rate Futures (Reserve Bank) Directions, 2009 dated August 28, 2009, stand-alone Primary Dealers (PDs) were allowed to deal in Interest Rate Futures (IRFs) for both hedging and trading on own account and not on client’s account, subject to adherence to the prescribed prudential norms. Fourth, the limit on borrowing by the PDs from the call / notice money market, on an average in a reporting fortnight, was increased from the existing ceiling of 200 per cent of their NOF to 225 per cent of NOF, as at the end March of the preceding financial year. Fifth, to ensure stability of Primary Dealers in times of volatile interest rates, the minimum capital requirement increased from Rs.50 crore to Rs.150 crore. PDs which intend to diversify into other permissible activities need to have net owned funds of Rs.250 crore as against Rs.100 crore earlier.
6.87 The recommendations of the Internal
Working Group on Auction Process of
Government of India Securities (Chairman: Shri
H.R. Khan), such as reduction of the time gap
between the bid submission and the declaration
of auction results, withdrawal of the facility of
bidding in physical form and submission of
competitive bids only through the NDS; and
submission of a single consolidated bid on
behalf of all its constituents by the bank/PD in
respect of non-competitive bids have been
implemented. In response to the Government
borrowing programme in 2008-09 and 2009-10
so far, the underwriting income of PDs has
registered a steady growth (Box VI.2).
Operations and Performance of PDs
6.88
The actual bids of dated securities during 2008-09 tendered by the PDs (Rs.3,49,393 crore) in the primary market were 1.3 times the notified amount (Rs.2,61,000 crore) as compared with 1.6 times the notified amount in the previous year.
6.89
The cumulative bidding commitments of the PDs in case of Treasury Bills were 111 per cent of the notified amount in each auction. The actual bids submitted by PDs collectively (including bank-PDs) were Rs.5,09,794 crore against their bidding commitment of Rs.2,84,985 crore translating into a bid-cover ratio of 1.8. The amount of bids accepted was for Rs.1,72,474 crore, at a success ratio of 59.1 per cent. All the PDs have achieved the minimum prescribed success ratio of 40 per cent in both the halves of the year. The PDs’ share in the primary auctions of Treasury Bills issued increased to 60.5 per cent during 2008-09 from 51.7 per cent during 2007-08.
6.90
During the fiscal year 2008-09, dated securities were issued for Rs.2,61,000 crore by the Government of India under the market borrowing programme. PDs, including bank-PDs, offered to underwrite Government dated securities amounting to Rs.4,24,723 crore and the Bank had accepted Rs.2,53,786 crore covering around 97.2 per cent of the notified amount.
6.91
During the fiscal year 2008-09, out of total 56 primary auctions of dated Government securities for Rs.2,61,000 crore, the PDs tendered bids for Rs.3,49,393 crore, i.e., 1.3 times of the notified amount. PDs were allotted securities for Rs.1,11,094 crore and the success ratio decreased to 42.6 per cent during 2008-09 from 46.2 per cent during 2007-08. During the year 2008-09, total devolvement on PDs was Rs.10,773 crore as compared to Rs.957 crore during the previous year. The share of the PDs in the primary market issuance of dated securities decreased to 42.6 per cent in 2008-09 from 46.2 per cent in 2007-08. (Table VI.45).
6.92
During 2008-09, PDs’ turnover (both outright and repo) in the secondary market amounted Rs.26,17,283 crore. The share of PDs’ total turnover to the total market turnover declined from 16.1 per cent in 2007-08 to 12.8 per cent in 2008-09 (Table VI.46).
Sources and Application of Funds
6.93 The consolidated balance sheet size of
the seven stand-alone PDs declined marginally
by 5.3 per cent during the year ended March
2009. Though the number of PDs has declined
from nine at end-March 2008 to seven at end-
March 2009, the reserves and surplus of stand
alone PDs increased by 13.8 per cent as
compared to the previous year, mostly on account of plough back of profit made in December quarter. During the year, the operations of ABN AMRO Securities India Private Limited were taken over by its parent bank, ABN AMRO Bank, with effect from December 16, 2008 and Lehman Brothers was barred from participating in the primary market. This resulted in reduction of capital funds of stand-alone PDs by 25.7 per cent as on March 31, 2009. On the sources side, secured loans decreased sharply by 35.7 per cent, while unsecured loans increased significantly by 41.3 per cent. On the deployment side, investments in Government securities decreased by 3.7 per cent, while investments in commercial papers increased marginally by 2.3 per cent over previous year. Investment in corporate bonds decreased by 19.8 per cent from Rs.621 crore to Rs.498 crore in contrast to increase of 4.3 per cent witnessed during 2007-08 (Table VI.47).
Box VI.2: Underwriting of Central Government Dated Securities
Concomitant with the objectives of Primary Dealer (PD) system, PDs are required to support auctions for issue of Government dated securities, through underwriting the dated securities and meeting the underwriting/bidding commitments. In terms of the Fiscal Responsibility and Budget Management (FRBM) Act, 2003, the Reserve Bank of India’s participation in the primary issues of Government securities stood withdrawn with effect from April 1, 2006, except under exceptional circumstances. To address the emerging needs, an Internal Technical Group on Central Government Securities Market was constituted, which recommended the restructuring of the institutional process of bidding commitment by introducing a revised methodology for Primary Dealers’ obligations. Under the new scheme, Primary Dealers are required to meet 100 per cent underwriting commitment in each auction, replacing the earlier requirement of bidding commitment and voluntary underwriting. The scheme of underwriting was put in place from April 1, 2006. The Scheme was further reviewed in November, 2007 and it was decided that the minimum bidding requirement for each PD in the ACU auction would be equal to the amount of MUC.
Under the scheme, the underwriting commitment on dated securities of Central Government is divided equally into two parts - Minimum Underwriting Commitment (MUC) and Additional Competitive Underwriting (ACU). The MUC of each PD is computed to ensure that at least 50 percent of the notified amount of each issue is mandatorily underwritten equally by all PDs. The share under MUC will be uniform for all PDs, irrespective of their capital or balance sheet size. The remaining portion of the notified amount is underwritten through an Additional Competitive Underwriting (ACU) auction. The commission payable on the amount accepted in the ACU is discriminatory (multiple-price) whereas the commission payable on the MUC amount is made differential in order to make the ACU bidding competitive. The PDs which are successful in the ACU auction for 4per cent or more of the notified amount are eligible to receive the commission on the MUC at the weighted average rate of all the accepted bids in the ACU auction whereas the PD which are successful by less than 4per cent or not successful in the ACU auction, get the commission on the MUC at the weighted average rate of lowest three bids in the ACU.
The amount so allotted in the underwriting auction becomes the minimum bidding obligation for the PD in the main auction. Devolvement of securities, if any, on PDs takes place on pro-rata basis, depending upon the amount of underwriting obligation of each PD after setting off the successful bids in the main auction. During the fiscal year 2008-09, total devolvement on PDs was to the tune of Rs.10,773 crore as against Rs.957 crore in the previous year. In current fiscal year, total devolvement of securities till end of September, 2009 stood at Rs.6050 crore.
The comparison of underwriting fee quoted by the Primary Dealers during the period 2006-07, 2007-08 and 2008-09 (till end-September 2009) is given in the table below:
Table: Comparison of underwriting cut-off fees accepted |
|
Range of U/W cut - off price accepted Paise/Rs 100 |
Quarter |
2007-08 |
2008-09 |
2009-10 |
1 |
2 |
3 |
4 |
April-June |
1.72-5.00 |
0.97-16.00 |
1.07 - 39.00 |
July-Sept |
0.39-1.99 |
0.37-49.00 |
0.37 - 15.60 |
Oct-Dec |
0.39-1.45 |
0.46-15.98 |
- |
Jan-March |
0.28-0.54 |
1.24-99.00 |
- |
The underwriting scheme promoted active participationby the PDs and ensured that the Government securitiesare fully subscribed. The share of PDs (ratio of bidsaccepted from PDs to the total notified amount) inprimary auctions of Central Government dated securitieshas been very significant since the year 2006 when RBIstopped participating in primary auctions and hasprovided depth and volume to the domestic debt market.
Table: Performance of PDs in primary auctions of Government securities |
(In Rs. crore) |
Details |
2006-07 |
2007-08 |
2008-09 |
2009-10* |
1 |
2 |
3 |
4 |
5 |
Notified Amount |
1,46,000 |
1,56,000 |
2,61,000 |
2,95,000 |
Bids Submitted by PDs |
2,02,462 |
2,54,253 |
3,49,393 |
3,61,325 |
Bids accepted of PDs |
64,727 |
72,122 |
1,11,094 |
1,17,023 |
Bid-to-cover ratio |
1.39 |
1.63 |
1.34 |
1.22 |
Success Ratio (per cent) |
31.97 |
28.37 |
31.80 |
32.39 |
Share of PDs (per cent) |
44.33 |
46.23 |
42.56 |
39.67 |
* - till end-September 2009. |
In view of the reform measures taken over the years, the Indian Government securities market has become increasingly broad-based, characterized by an efficient auction process, an active secondary market, a liquid yield curve up to 30 years and supported by an active Primary Dealer (PD) system.
Table VI.45: Performance of the PDs
in the Primary Market
(At end-March) |
(Amount in Rs. crore) |
Item |
2008 |
2009 |
1 |
2 |
3 |
Treasury Bills |
|
|
Bidding Commitment |
1,04,385 |
2,84,985 |
Actual Bids Submitted |
3,18,201 |
5,09,794 |
Bid to Cover Ratio |
3.0 |
1.8 |
Bid Accepted |
1,04,819 |
1,72,474 |
Success Ratio (in per cent) |
100.4 |
59.1 |
Central Govt. Securities |
|
|
Notified Amount |
1,56,000 |
2,61,000 |
Actual Bids submitted |
2,54,253 |
3,49,393 |
Bid to Cover Ratio |
1.6 |
1.3 |
Bid Accepted |
72,122 |
1,11,094 |
Success Ratio (in per cent) |
46.2 |
42.6 |
Table VI.46: Performance of the PDs in the Secondary Market |
(Amount in Rs. crore) |
Item |
Apr-Jun 2008 |
Jul-Sep 2008 |
Oct-Dec 2008 |
Jan-Mar 2009 |
2008-09 |
2007-08 |
1 |
2 |
3 |
4 |
5 |
6 |
7 |
Outright |
|
|
|
|
|
|
PDs Turnover |
1,38,895 |
1,65,252 |
2,78,915 |
2,13,125 |
7,96,187 |
6,37,768 |
Market Turnover |
7,03,669 |
7,60,791 |
14,25,305 |
13,65,587 |
42,55,352 |
32,68,551 |
Share of PDs (per cent) |
19.7 |
21.7 |
19.6 |
15.6 |
18.7 |
19.5 |
Repo |
|
|
|
|
|
|
PDs Turnover |
3,39,292 |
3,41,826 |
5,16,341 |
6,23,637 |
18,21,096 |
24,00,106 |
Market Turnover |
38,76,794 |
29,18,136 |
39,22,851 |
55,16,951 |
1,62,34,732 |
1,55,75,515 |
Share of PDs (per cent) |
8.8 |
11.7 |
13.2 |
11.3 |
11.2 |
15.4 |
Total |
|
|
|
|
|
|
PDs Turnover |
4,78,187 |
5,07,079 |
7,95,254 |
8,36,763 |
26,17,283 |
30,37,873 |
Market Turnover |
45,80,463 |
36,78,927 |
53,48,156 |
68,82,538 |
2,04,90,084 |
1,88,44,065 |
Share of PDs (per cent) |
10.4 |
13.8 |
14.9 |
12.2 |
12.8 |
16.1 |
6.94 The share of Government securities and
Treasury Bills in total assets of PDs increased
from 70 per cent at end-March 2008 to 70.9
per cent at end-March 2009. Investment in
equity and Mutual Funds registered sharp
decline of 85.3 per cent at end-March 2009 as
compared with the position at end-March 2008.
Financial Performance of PDs
6.95
The income earned by the PDs increased by around 40 per cent during the year 2008-09 as compared with 2007-08 due to higher trading profits posted by the PDs by making use of the lower yields prevailed in the third quarter of the year (Table VI.48).
6.96
In view of increase in trading profits and reduction in interest expenditure, profits of the PDs increased sharply during the year. Overall, ROA rose sharply during the year as net profit of PDs almost doubled and average asset decreased by 24.5 per cent from Rs.15,039 crore in 2007-08 to Rs.11,348 crore in 2008-09 (Table VI.49).
Table VI.47: Sources and Applications of Funds of Primary Dealers |
(Amount in Rs. crore) |
Item |
End-March |
Percentage Variation |
|
2008 |
2009 |
2008 |
2009 |
1 |
2 |
3 |
4 |
5 |
Sources of Funds |
10,882 |
10,307 |
-19.7 |
-5.3 |
1. |
Capital |
1,508 |
1,121 |
-27.8 |
-25.7 |
2. |
Reserves and Surplus |
1,944 |
2,213 |
-37.3 |
13.8 |
3. |
Loans (a+b) |
7,430 |
6,973 |
-11.2 |
-6.2 |
| |
a) |
Secured |
4,580 |
2,945 |
17.1 |
-35.7 |
| |
b) |
Unsecured |
2,850 |
4,028 |
-36.1 |
41.3 |
Application of Funds |
10,882 |
10,307 |
-19.7 |
-5.3 |
1. |
Fixed Assets |
14 |
13 |
-80.5 |
-7.1 |
2. |
Investments (a to c) |
8,291 |
7,891 |
-10.3 |
-4.8 |
| |
a) |
Government Securities |
7,584 |
7,305 |
2.3 |
-3.7 |
| |
b) |
Commercial Papers |
86 |
88 |
-93.1 |
2.3 |
| |
c) |
Corporate Bonds |
621 |
498 |
4.3 |
-19.8 |
3. |
Loans and Advances |
429 |
959 |
-62.2 |
123.5 |
4. |
Non-current Assets |
0 |
0 |
|
|
Equity, Mutual Funds etc. |
150 |
22 |
-83.9 |
-85.3 |
Others* |
1,998 |
1,422 |
-1.2 |
-28.8 |
* : Others include cash+ bank balances + accrued interest + DTA – current liabilities and provisions.
Source: Annual Reports of respective PDs. |
Table VI.48: Financial Performance of Primary Dealers |
(Amount in Rs. crore) |
Item |
2007-08 |
2008-09 |
Percentage Variation |
|
|
|
Amount |
Percentage |
1 |
2 |
3 |
4 |
5 |
A. |
Income (i to iii) |
1,307 |
1,825 |
518 |
39.6 |
| |
i) |
Interest and discount |
914 |
878 |
-36 |
-3.9 |
| |
ii) |
Trading Profit |
255 |
843 |
588 |
230.6 |
| |
iii) |
Other income |
138 |
104 |
-34 |
-24.6 |
B. |
Expenses (i+ii) |
775 |
692 |
-83 |
-10.7 |
| |
i) |
Interest |
595 |
546 |
-49 |
-8.2 |
| |
ii) |
Administrative Costs |
180 |
146 |
-34 |
-18.9 |
Profit Before Tax |
532 |
1,133 |
601 |
113.0 |
Profit After Tax |
373 |
749 |
376 |
100.8 |
No. of PDs $ |
9 |
7 |
|
|
$ : Stand-alone PDs only.
Source: Primary Dealers’ Return (PDR). |
6.97 Stand-alone PDs continued to be adequately capitalized. The CRAR of individual stand-alone PDs remained above the prescribed minimum CRAR of 15 per cent as at end-March 2009. The CRAR of the stand-alone PDs as a group was at 34.8 per cent as at end-March 2009 (Table VI.50).
Table VI.49: Financial Indicators of Primary Dealers |
(Amount in Rs. crore) |
Indicator |
2007-08 |
2008-09 |
1 |
2 |
3 |
i) |
Net profit |
373 |
749 |
ii) |
Average Assets |
15,039 |
11,348 |
iii) |
Return on average assets (in per cent) |
2.5 |
6.6 |
iv) |
Capital Funds |
3,611 |
3,464 |
v) |
No. of PDs |
9 |
7 |
Source : Primary Dealers’ Return (PDR). |
Table VI.50: Select Indicators of Primary Dealers (At end-March) |
(Amount in Rs. crore) |
Item |
2008 |
2009 |
1 |
2 |
3 |
Total Assets |
10,882 |
10,307 |
of which: Government securities |
7,584 |
7,305 |
Government securities as percentage of total assets |
70.0 |
70.9 |
Total Capital Funds |
3,611 |
3,464 |
CRAR (in per cent) |
38.0 |
34.8 |
Liquidity Support Limit |
3,000 |
3,000 |
No. of PDs |
9 |
7 |
Source : Primary Dealers’ Returns (PDRs). |
5. Conclusion
6.98 The recent financial crisis has posed the problem to NBFIs in terms of accessing low cost funds leading them to recourse to unsecured loans for funding their asset base. CFSA 2009 has advised that given the limited access to low cost funding of NBFCs, there is a need to develop alternative funding source like an active corporate bond market. Alternative funding source will facilitate in their asset base growth as well as in asset diversification. In the present scenario, NBFCs-ND is a growth driver of NBFCs, however, there is a need for an appropriate structure for regulation and supervision to bridge up the gap in areas relating to transfer of significant ownership, major acquisition, risk management, internal control and home host relationship for systematically important NBFCs-ND.
|
 IST,
IST,