 IST,
IST,


Non-Banking Financial Institutions
Non-Banking Financial Institutions (NBFIs) are playing pivotal role in broadening access to financial services, enhancing competition and diversification of the financial sector. They are increasingly being recognised as complementary to the banking system capable of absorbing shocks and spreading risk mitigation at the times of financial distress. The financial performance of deposit-taking Non-Banking Financial Companies (NBFCs-D) witnessed improvement as reflected in increased operating profits while expenditure declined marginally during 2010-11. The consolidated balance sheet of Systemically Important Non-Deposit taking NBFCs (NBFCs-ND-SI) have expanded but their net profit to total assets remain unchanged. Resources mobilised by financial institutions (FIs) were considerably higher during 2010-11. Notwithstanding the turnaround in the trading income, net profit of the primary dealers (PDs) declined mainly on account of disproportionate increase in interest expenses and decline in other income. Rapid financial diversification has posed new challenges for regulators, especially in devising appropriate regulatory safeguards for the highly complex NBFI sector. 1. Introduction 6.1 Non-Banking Financial Institutions (NBFIs) sector in India comprises various types of financial institutions with each one of them having its roots at a particular stage of development of the financial sector. All-India financial institutions (AIFIs), largely an outcome of the development planning in India, were created for long-term financing. Non-banking financial companies (NBFCs), on the other hand, are mostly private sector institutions which provide a variety of services including equipment leasing, hire purchase, loans, and investments. Primary dealers (PDs), which came into existence in 1995, have played an important role in both the primary and secondary Government securities market. Although commonly grouped as NBFIs, the nature of operations of FIs, NBFCs and PDs are quite different from each other. The regulatory focus in respect of these three types of NBFIs is also different. Business operations and financial performance of these entities are driven mainly by sector-specific factors. 6.2 NBFCs perform a diversified range of functions and offer various financial services to individual, corporate and institutional clients. They have been helping to bridge the credit gaps in several sectors where the institutions like banks are unable to venture. With the growing importance assigned to financial inclusion, NBFCs have come to be regarded as important financial intermediaries particularly for the small-scale and retail sectors. The regulations governing these institutions are less rigorous as compared to banks as they are not subject to certain regulatory prescriptions applicable to banks. NBFCs-D are not subject to Cash Reserve Ratio (CRR) requirements like banks but are mandated to maintain 15 per cent of their public deposit liabilities in Government and other approved securities as liquid assets. The public deposits do not have insurance cover. NBFCs do not enjoy refinance facilities from the Reserve Bank and do not have chequable deposits and are thus not part of the payment and settlement systems. 6.3 Since 2006, NBFCs were reclassified based on whether they were involved in the creation of productive assets. Under the new classification, the NBFCs were divided into three major categories, viz., asset finance companies, loan companies, and investment companies. Considering the growing importance of infrastructure finance, a fourth category of NBFCs involved in infrastructure finance was introduced in February 2010, viz., Infrastructure Finance Companies (IFCs). Subsequently, in January 2011, a new category of companies, viz., systemically important non-deposit taking core investment companies (CIC-ND-SI) were brought under regulation and supervision of the Reserve Bank. 6.4 Till recently, NBFCs-ND were subject to minimal regulation as they were non-deposit taking bodies and considered as posing little threat to financial stability. However, recognising the growing importance of this segment and its inter-linkages with banks and other financial institutions, capital adequacy and exposure norms have been made applicable to NBFCs-ND that are large and systemically important (i.e., having asset size of `100 crore and above) from April 1, 2007; such entities are referred to as NBFCs-ND-Systemically Important. 6.5 This chapter provides analysis of the financial performance and soundness indicators related to each of these segments of NBFIs during 2010-11. The chapter is organised into four sections. Section 2 analyses the financial performance of FIs. Section 3 discusses the financial performance of NBFCs-D and NBFCs- ND-SI. Section 4 provides an analysis of the performance of PDs in the primary and secondary markets, followed by Conclusions in Section 5. 2. Financial Institutions 6.6 As at end-March 2011, there were five financial institutions (FIs) under the regulation of the Reserve Bank viz., EXIM Bank, NABARD, NHB, SIDBI and IIBI. Of these, four FIs (EXIM Bank, NABARD, NHB and SIDBI) are under fullfledged regulation and supervision of the Reserve Bank. IIBI is under the process of voluntary winding up as on March 31, 2011. In September 2010, Reserve Bank transferred its 71.5 per cent capital stake-holding in NABARD to the Government of India (Table VI.1). In April 2010, the Government of India (GoI) agreed to transfer ownership and shareholding of NHB from the Reserve Bank to GoI and also to transfer the registration and regulatory functions in respect of Housing Finance Companies from NHB to the Reserve Bank and retention of supervisory function with the NHB. 6.7 During 2010-11, in view of the difficulties faced by NHB and EXIM Bank in meeting their overall lending requirements, their ‘aggregate borrowing limit’ has been enhanced from 10 times of net owned funds (NOF) to 11 times of NOF for one year (for NHB up to September 30, 2011 and for EXIM Bank up to March 31, 2012), subject to review. Further, in view of the difficulties faced by NHB, SIDBI and EXIM Bank in meeting short term lending requirements, their borrowing under ‘umbrella limit’ has been enhanced from 100 per cent of NOF to 150 per cent of NOF for a period of one year i.e., up to June 30, 2012, subject to review. The guidelines regarding prudential norms on income recognition, asset classification and provisioning pertaining to advances, restructuring of advances, investments portfolio, etc. issued to banks are also made applicable to the select FIs. Operations of Financial Institutions 6.8 The financial assistance sanctioned and disbursed by FIs declined marginally during 2010-11. This was mainly due to the decline in sanctions and disbursements made by investment institutions especially LIC (Table VI.2 and Appendix Table VI.1). Assets and Liabilities of Financial Institutions 6.9 The combined balance sheet of FIs expanded during 2010-11. On the liabilities side, deposits along with ‘bonds and debentures’ remain the major source of borrowings. However, resources raised from ‘other sources’ witnessed a decline. On the assets side, loans and advances continued to be the single largest component contributing more than four-fifth of the total assets of FIs and witnessed growth of 16.6 per cent during 2010-11 (Table VI.3). Resources Mobilised by FIs 6.10 Resources mobilised by FIs during 2010- 11 were considerably higher than the previous year. All the components, the long-term, shortterm and foreign currency resources raised witnessed a sharp rise during 2010-11 as compared with the previous year. Among the four FIs, NHB mobilised the largest amount of resources, followed by NABARD, EXIM Bank and SIDBI (Table VI.4). 6.11 FIs raise resources from the money market through various instruments such as Commercial Paper (CP), Certificates of Deposit (CDs), and term deposits. During 2010-11, there was a significant increase in the resources raised by FIs through CP (Table VI.5). As a result, CP emerged as the single most important channel accounting for more than 70 per cent of the total resources mobilised by FIs from the money market in 2010-11. FIs are mandated to raise resources from the money market within the sanctioned umbrella limit. Though, gross resources raised by SIDBI from money market during 2010-11 were ` 8,137 crore, at no point of time during the year amount outstanding under the above instruments exceeded the umbrella limit. As CP is a short-term money market instrument, FIs kept resorting frequently to this instrument during the year taking the cumulative amount raised through CP to a higher level. Sources and Uses of Funds 6.12 Total sources/deployment of funds by FIs declined modestly during 2010-11. The major part of the funds of FIs was raised internally followed by external sources. ‘Other sources’ formed only a small part of the funds of FIs. While the funds raised from internal sources rose, external sources witnessed decline mainly due to uncertainty in the global financial markets during 2010-11. A large part of the funds raised were used for fresh deployments, followed by repayment of past borrowings.
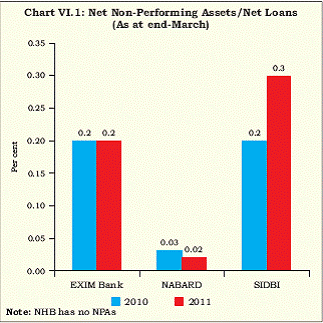
Interest payments formed only a small part of the utilisation of funds by FIs. Other deployments recorded a sharp increase, while repayment of past borrowings registered a decline over the year (Table VI.6). Maturity and Cost of Borrowings and Lending 6.13 The weighted average cost of Rupee resources raised went up across the board (Table VI.7). The weighted average maturity of Rupee resources raised by financial institutions, barring NHB has also gone up over the year. NHB raised its Prime Lending Rate during the year, while EXIM Bank and SIDBI kept it unchanged (Table VI.8). Financial Performance of FIs 6.14 The financial performance of the FIs deteriorated during 2010-11 due to decrease in operating profit and net profit. There was a sharp rise in operating expenses during the year mainly on account of wage revision. However, the interest income of FIs increased by 15.4 per cent (Table VI.9). Among the four FIs, return on assets (ROA) is highest in case of EXIM Bank followed by NHB and SIDBI (Table VI.10). Soundness Indicators: Asset Quality 6.15 At the aggregate level, there was an increase in the amount of net NPAs for FIs in 2010-11 as compared to the previous year. The increase in net NPAs, however, was attributable mainly to SIDBI, whereas, in case of NABARD it was declined marginally. If the four FIs were ranked in ascending order of the amount of their net NPAs, SIDBI appeared at the top having the largest quantum of net NPAs, while NHB was at the bottom with no NPAs. Moreover, the NPA ratio (NPAs as per cent of net loans) was the highest for SIDBI followed by EXIM Bank (Table VI.11 and Chart VI.1). 6.16 There was a substantial increase in the Sub-standard assets of EXIM Bank. However, Doubtful and Loss assets had decreased during the year. In case of NABARD, Sub-standard assets have come to zero level, but doubtful assets have increased. In case of SIDBI, Substandard and Doubtful assets had increased substantially during the year. During 2010-11, sub-standard assets of all the four FIs taken together have increased sharply (Table VI.12). Capital Adequacy 6.17 During 2010-11, the capital adequacy as measured by CRAR has increased for NHB and SIDBI, whereas, EXIM Bank and NABARD showed decline. It may be noted that, the CRAR was way above stipulated minimum norm of 9 per cent for each of the FIs (Table VI.13).
Particularly higher CRAR for SIDBI indicates the scope for utilisation of capital for further credit expansion. 3. Non-Banking Financial Companies 6.18 NBFCs are classified on the basis of the kind of liabilities they access, the type of activities they pursue, and of their perceived systemic importance. On the basis of liabilities, there are two categories, (i) Category ‘A’ companies (NBFCs holding and accepting public deposits or NBFCs-D), and (ii) Category ‘B’ companies (NBFCs not having public deposits or NBFCs-ND). NBFCs-D are subject to requirements of capital adequacy, liquid assets maintenance, exposure norms (including restrictions on exposure to investments in land, building and unquoted shares), ALM discipline and reporting requirements. NBFCs-ND are subject to minimal regulation as they were nondeposit taking bodies and considered as posing little threat to financial stability. However, recognising the growing importance of this segment and its inter-linkages with banks and other financial institutions (Box VI.1), capital adequacy, exposure norms, ALM discipline and reporting requirement have been made applicable to NBFCs-ND that are large and systemically important since April 1, 2007; such entities are referred to as NBFCs-ND-Systemically Important.
6.19 On activity-based classification, NBFCs are classified into five categories: (i) Loan Companies (LCs), (ii) Investment Companies (ICs), (iii) Asset Finance Companies (AFCs), (iv) Infrastructure Finance Companies (IFCs), and (v) Systemically Important Core Investment Companies (CICs- ND-SI). A new category of CIC-ND-SI was created in August 2010 for those companies with an asset size of `100 crore and above that was only in the business of investment for the sole purpose of holding stakes in group concerns, but not trading in these securities and accepting public funds. A regulatory framework in the form of adjusted Net Worth and leverage limits was put in place for CIC-ND-SIs and they were given exemption from NOF, capital adequacy and exposure norms.
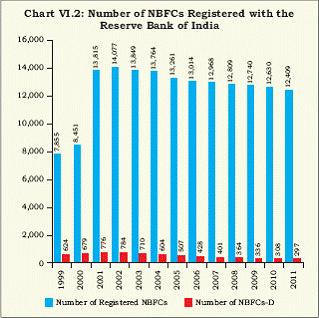
purpose of holding stakes in group concerns, but not trading in these securities and accepting public funds. A regulatory framework in the form of adjusted Net Worth and leverage limits was put in place for CIC-ND-SIs and they were given exemption from NOF, capital adequacy and exposure norms. 6.20 The ownership pattern of NBFCs-ND-SI as well as deposit taking NBFCs suggests that these companies were predominantly nongovernment companies (Public Limited Companies in nature). The percentage of nongovernment companies were 97.2 per cent and 97.0 per cent, respectively, in NBFCs-ND-SI and deposit taking NBFCs as against government companies having a share of 2.8 per cent and 3.0 per cent, respectively at end- March 2011 (Table VI.14). Profile of NBFCs (including RNBCs) 6.21 The total number of NBFCs registered with the Reserve Bank declined marginally to 12,409 as at end-June 2011 (Chart VI.2). A similar trend was also observed in case of deposit taking NBFCs (NBFCs-D) during 2010-11 mainly due to cancellation of Certificates of Registration, exit of NBFCs from deposit taking activities resulting in conversion of NBFCs from deposit taking into non-deposit taking companies. Box VI.1: Inter-connectedness of NBFCs and Banks in India Over a period, both banks and non-bank financial companies have become key elements of India's financial system. In the wake of recent global financial crisis (2007-09), the role of nonbank financial intermediaries had been highlighted for the nexus between the banking system and the NBFIs. NBFIs, in general, were known for taking higher risks than the banking system. Traditionally, the debate regarding the banks expansion into non-banking financial areas veered around certain activities, viz., insurance, investment banking etc. However, the recent global crisis has extended the debate to the inter-connectedness of the banking system with the NBFIs as excessive inter-institutional exposure tends to make the financial system vulnerable. Banks' Exposure to Deposit taking NBFCs For the deposit taking NBFCs, it is pertinent to note that, the proportion of public deposits outstanding to their total liabilities has decreased to just around 3.5 per cent at the end- March 2011 from 20.9 per cent as at the end-March 2001. With tightening of the prudential regulatory norms in respect of deposit taking companies, the public deposit is increasingly being substituted with their reliance mainly on borrowings. A closer analysis of the sources of funds revealed that their total borrowings as at the end of March 2011 constituted as much as 66.2 per cent of their total liabilities (which increased from 31.8 per cent as at the end of March 2001).Understandably, (nearly half of the total borrowings) are from banks and financial institutions, which demonstrates the close financial inter-connectedness within the financial system, as well as underscores higher systemic risks of the financial system. Banking system seems to be the major source of funding for NBFCs, both directly and indirectly. Till recently, banks had the incentive of lending directly to NBFCs as such loans were permitted to be classified as ‘priority sector’ lending by the banks. Indirectly, banks fund NBFCs by subscribing to the debentures and the CP issued by them. The higher borrowings of NBFCs, especially, from the banking system raise some concerns about their liquidity position. These concerns will be further accentuated incase the banks’ own liquidity position becomes tight at the time of crisis or even at crisis like situation. Non-Deposit taking Systemically Important NBFCs (NBFCs-ND-SI) Among the NBFCs-ND, the large NBFCs with `100 crore and above assets size classified as systemically important (NBFCND- SI) are also found to depend on banking system for their resources. As these NBFCs are not deposits taking, they are regulated with somewhat less rigour compared with NBFCs-D. In the post global financial crisis, the regulators’ attention world over has received increased attention towards the systemically important financial institutions (SIFIs). Accordingly, even in India the extant prudential regulation of NBFCs-ND-SI is in the process of convergence with that of the NBFCs-D. In any case, it needs to be underlined that, high dependency of NBFCs on the banking system for their resources, not only will strain banks at the time of crisis but also place NBFCs themselves into vulnerable situation as banks can become over sensitive to a liquidity crisis or imminent crisis and they can either become too reluctant to lend to NBFCs or at the extreme case, they may completely refrain from lending to NBFCs which would further aggravate the precarious condition. The recent global crisis is a pointer in this direction. Since the regulatory and cost-incentive structures are not identical for banks and NBFCs and that NBFCs borrow funds from banks to on-lend, it is necessary to establish adequate checks and balances to ensure that the banks’ depositors are not indirectly exposed to the risks of a different cost-incentive structure. NBFCs also do not have a ceiling on their capital market related activities unlike the banking system. Moreover compared with regulation of banking sector, NBFCs in general, are less stringently regulated, though there has been substantial progress over the period towards bringing the regulatory norms relating to NBFCs on par with the banking system. In view of the above, NBFCs’ increased swapping public deposits with borrowings from the banking system seems to be a concern from the point of view of systemic interconnectedness. 6.22 Despite the decline in the number of NBFCs, their total assets as well as net owned funds registered an increase during 2010-11, while public deposits recorded a decline. The share of Residuary Non-Banking Companies (RNBCs) in total assets of NBFCs showed a declining trend. The same trend also witnessed in terms of net owned funds of RNBCs during 2010-11 (Table VI.15).
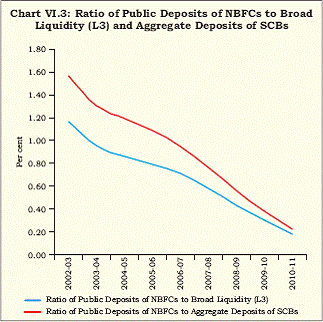
6.23 The ratio of public deposits of NBFCs to aggregate deposits of Scheduled Commercial Banks (SCBs) in 2010-11 indicated a decline. The ratio of deposits of NBFCs to the broad liquidity aggregate of L3 also declined during the year (Chart VI.3). Operations of NBFCs-D (excluding RNBCs) 6.24 The balance sheet size of NBFCs-D expanded at the rate of 11.9 per cent in 2010-11 as compared with 22.2 per cent in the previous year, mainly due to conversion of two major NBFCs-D into NBFCs-ND (Table VI.16). It may be mentioned that borrowings constituted around two-third of the total liabilities of NBFCs- D. The public deposits of NBFCs-D, which are subject to credit reating (Box VI.2), continued to show an increasing trend during 2010-11. On the assets side, loans and advances remained the most important category for NBFCs-D constituting about three-fourth of their total assets. The investment constituted second-most important category which witnessed a subdued growth during 2010-11 mainly due to decline in non-SLR investments.
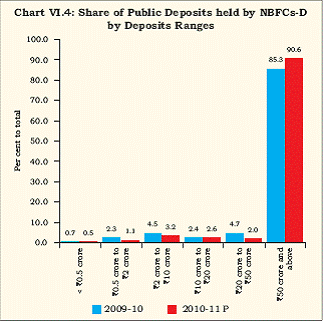
6.25 Asset Finance Companies (AFCs) held the largest share in the total assets of NBFCs-D at end-March 2011 (Table VI.17). Size-wise Classification of Deposits of NBFCs-D 6.26 A sharp increase was discernible in the share of NBFCs-D located at the upper-end having deposit size of `50 crore and above accounting for about 90.6 per cent of total deposits at end-March 2011. However, there were only 8 NBFCs-D belonging to this category constituting about 3.7 per cent of the total number of NBFCs-D. Thus, only relatively bigger NBFCs-D were able to raise resources through deposits (Table VI.18 and Chart VI.4).
Box VI.2: Credit Rating of NBFCs – Practices and Prospects Non-Banking Finance Companies (NBFCs) being heterogeneous in their operations, they are broadly grouped under four heads (i) asset finance companies, (ii) loan companies, (iii) investment companies, and (iv) infrastructure finance companies for regulatory compliance by the Reserve Bank. Credit rating for deposit taking NBFCs was recommended by ‘Working Group on Financial Companies (Chairman: A. C. Shah) in 1992. However, it was in January 1998 that the new regulatory framework for NBFCs by the Reserve Bank made it mandatory for NBFCs to get rated in order to protect the interest of the retail depositors. The credit ratings assigned are a symbolic representation of current opinion on the relative credit risk associated with the instruments rated by credit rating agency(CRA). This opinion is arrived at after a detailed evaluation of the issuer’s business and financial risks and on using such evaluation to project the level and stability of the future financial performance in various likely scenarios of the rated companies. Thus, conclusion derived from the analysis of the particular company based on the detailed information CRA received from within the company as well as from outside sources by the rating agency is reflected in a credit rating. Rating Methodology In rating an NBFC, the credit rating agency evaluates the company’s business and financial risks, and uses this evaluation to project the level and stability of its future financial performance in various likely scenarios. The broad parameters for assessing the risks of NBFCs are based on Business Risk: (i) Operating Environment, (ii) Ownership Structure, (iii) Franchise and Size, (iv) Competitive position, (v) Management, Systems and Strategy, and (vi) Governance structure; Financial Risk: (i) Asset Quality, (ii) Liquidity, (iii) Profitability, and (iv) Capital Adequacy. However, the relative importance of each of these parameters can vary across companies, depending on its potential to change the overall risk profile of the company concerned. Moreover, as many of these parameters are qualitative, the rating companies try to reduce the subjectivity by capturing and assessing information on defined sub-parameters and by comparison across various companies. One of the common practices among CRAs being that a careful evaluation of the risk management policies of the NBFC is done as it provides important guidance for assessing the impact of stress events on the liquidity, profitability, and capitalisation of the company concerned. The CRA evaluates the quality of an NBFC’s capital, apart from the level of capital. An NBFC’s ability to meet regulatory capital adequacy requirement is also evaluated. A very high return on equity may not necessarily translate into a high credit rating, given that the underlying risk could be very high as well, and being so it could be more volatile or difficult to predict. All ratings are kept under continuous monitoring throughout the period of validity. Regulatory Requirements for Credit Rating of NBFCs Effective January 31, 1998 the Reserve Bank made credit rating mandatory to all deposit taking NBFCs with NoF of ` 25 lakh and above. Presently, NBFCs-D with NoF of ` 2 crore and above have to necessarily get rated by one of the approved CRAs at least once a year. It is also mandated that they cannot raise public deposits without the ‘minimum investment grade’ and the copy of the rating should be submitted to the Reserve Bank. Moreover, any upgradation or downgrading of the rating also need to be informed to the regulator immediately.
Prospects for Credit Ratings of NBFCs The quantum of deposit raised by an NBFC is linked to the ratings. NBFCs have been incentivized to get rated by credit rating agencies through linking of their CRAR to the ratings. Accordingly, as of now a rated NBFC is required to maintain only 12 per cent of CRAR while unrated NBFCs need to maintain 15 per cent. Incidentally, the non-deposit taking NBFCs, though the rating is not mandatory by the regulator, get their instruments rated by the CRAs. In the wake of the sub-prime financial crisis, there is a growing concern among the regulators about the potential gap between expectation and realization, i.e., between reliance on credit ratings and the reliability of such ratings. The concern emanates mainly from the fact that inaccurate credit ratings could disturb the market allocation incentives, cost structures and competition. With growing competition among credit rating agencies commercial aspirations appear to be too high. The most oft repeated complaint against CRAs are that they lack accountability as credit rating agencies do not have a legal duty of accuracy and are often protected from liability in case of inaccurate ratings. This requires the attention of regulators and the government. References: RBI (1992): Report of the Working Group on Financial Companies (Chairman: Shri A. C. Shah), Reserve Bank of India, Mumbai.
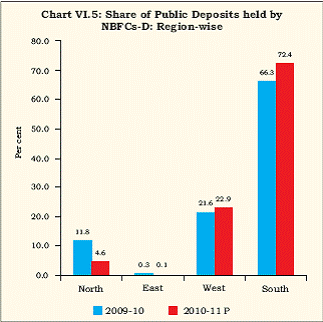
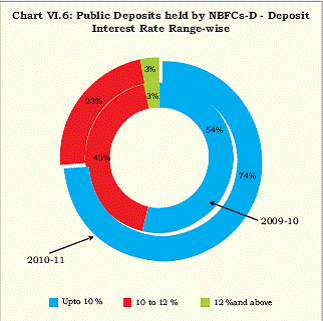
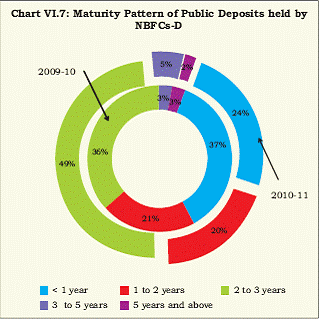
Region-wise Composition of Deposits held by NBFCs 6.27 There was a concentration of NBFCs-D in the northern region of the country, which accounted for 66.4 per cent of companies in the total number of NBFCs-D at end-March 2011. However, the deposit size of NBFCs-D in the northern region was considerably smaller in comparison with the NBFCs-D located in the southern region, which accounted for 72.4 per cent of deposits at end-March 2011. There was also an increase in the share of deposits held by NBFCs-D in the southern region during 2010-11 (Table VI.19 and Chart VI.5). 6.28 Among the metropolitan cities, New Delhi from the Northern region accounted for the largest number of NBFCs-D, while Chennai from the Southern region held the largest share of 73.9 per cent in total deposits of NBFCs-D. Interest Rate on Public Deposits with NBFCs 6.29 The largest amount of public deposits of NBFCs-D were raised at interest rates in the range of up to 10 per cent with the share accounting for about three-fourth as at end- March 2011 (Table VI. 20 and Chart VI.6). Maturity Profile of Public Deposits 6.30 The largest proportion of public deposits raised by NBFCs-D belonged to the short to medium-term end of the maturity spectrum. At end-March 2011, the largest percentage of deposits had a maturity of more than two years and up to three years followed by less than 1 year maturity. In 2010-11, there was an increase in the shares of deposits belonging to more than 2 years and up to 3 years maturity category, while the shares of deposits belonging to almost all maturity categories showed a decline (Table VI.21 and Chart VI.7).
6.31 Banks and financial institutions were the dominant source of borrowings for NBFCs-D with a share of about 50 per cent at end-March 2011. The share of borrowings from the Government (extended only to Government Loan Companies) witnessed an increase, while there was a negligible amount from the external sources. Others (which include, inter alia, money borrowed from other companies, commercial paper, borrowings from mutual funds and any other type of funds, which were not treated as public deposits) registered a significant growth in 2010-11 resulting in a rise in its share in total borrowings of NBFCs-D (Table VI.22).
Assets of NBFCs 6.32 The total assets of deposit-taking NBFCs-D sector registered a moderate growth during 2010-11 mainly on account of increase in the assets of asset finance companies (Table VI.23).
As at end-March 2011, more than two-thirds of the total assets of the NBFCs-D sector were held by asset finance companies. Component-wise, advances accounted for predominant share of total assets followed by investment. Distribution of NBFCs-D According to Asset Size 6.33 Based on their deposit taking capacity, only bigger NBFCs-D had larger asset base. At end-March 2011, only 7 per cent of NBFCs-D had an asset size of more than ` 500 crore, which had a share of 97.5 per cent in total assets of all NBFCs-D (Table VI.24).
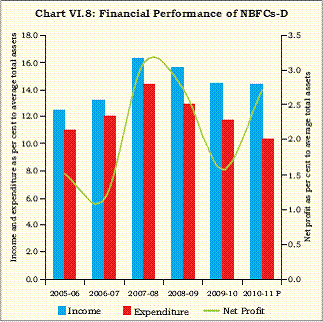
Distribution of Assets of NBFCs – Type of Activity 6.34 During 2010-11, assets held in the form of loans and inter corporate deposits and investments of NBFCs-D witnessed a significant growth. These two categories of activities constituted 93.9 per cent share in total assets of the NBFCs-D sector (Table VI.25). Financial Performance of NBFCs-D 6.35 The financial performance of NBFCs-D witnessed improvement as reflected in the increase in their operating profits during 2010- 11. This increase in profit was mainly on account of growth in income (fund based) while expenditure declined marginally. The operating profit along with an increase in tax provision resulted in almost doubling of net profit during 2010-11 (Table VI.26).
6.36 Expenditure as a percentage to average total assets witnessed a marginal decline during 2010-11, while income as a percentage to average total assets more or less remain same resulting in an increase in net profit to total average assets (Return on Assets) ratio of NBFCs-D (Chart VI.8). Soundness Indicators: Asset Quality of NBFCs-D 6.37 There was a significant decline in the gross NPAs to credit exposure ratio of NBFCs-D in 2010-11 in line with the trend observed in recent years. Net NPAs remained negative with provisions exceeding NPAs for last four consecutive years up to end-March 2011 (Table VI.27). 6.38 There was an improvement in the asset quality of asset finance and loan companies in 2009-10 as evident from a decline in the gross NPAs to gross advances ratio for these companies (Table VI.28).
6.39 There was a decline in the shares of all three NPA categories of sub-standard, doubtful and loss assets of all companies in 2010-11 underlining the improvement in asset quality of these institutions. In case of loan companies, there was an improvement in share of standard assets at end-March 2011 to 98.7 per cent (Table VI.29). Capital Adequacy Ratio 6.40 At end-March 2011, 199 out of 204 NBFCs had CRAR of more than 15 per cent or more (Table VI.30). This indicates that the NBFC sector is witnessing a consolidation process in the last few years, wherein the weaker NBFCs are gradually exiting and paving the way for stronger ones. The ratio of public deposits to Net Owned Funds (NOF) of NBFCs taken together has increased marginally to 0.3 per cent at end- March 2011 (Table VI.31). There was an increase in NOF and public deposits of NBFCs-D during 2010-11. This increase was mainly concentrated in the NOF size category of ` 500 crore and above (Table VI.32).
Residuary Non-Banking Companies (RNBCs) 6.41 Assets of the RNBCs declined by 36 per cent during the year ended March 2011. The assets mainly consist of investments in unencumbered approved securities, bonds/ debentures and fixed deposits/certificates of deposit of SCBs. However, NOF of RNBCs increased marginally by 2.3 per cent in 2010-11 (Table VI.33).
6.42 The decline in the income of RNBCs during 2010-11 was more than the decline in expenditure, as a result of which the operating profits of RNBCs declined significantly during the year. Despite the decline in the provision for taxation, the net profits of RNBCs decreased sharply during 2010-11 compared to a significant increase in the previous year. Regional Pattern of Deposits of RNBCs 6.43 At end-March 2011, there were two RNBC, of which, one was located in the eastern region while the other was in the central region. RNBCs are in the process of migrating to other business models and the companies would reduce their deposit liabilities to ‘nil’ by 2015. Public deposits held by the two RNBCs registered a significant decline in 2010-11 mainly on account of a substantial decline in the deposits held by the RNBC located in the central region (Table VI.34).
Investment Pattern of RNBCs 6.44 Following the decline in deposits, there was a decline in the investments of RNBCs in 2010-11. The decline was noticeable in the case of unencumbered approved securities (Table VI.35).
NBFCs-ND-SI 6.45 The assets of NBFCs-ND-SI for the year ended March 2011 showed an increase of 24 per cent over the year ended March 2010. Total borrowings (secured and unsecured) by NBFCs- ND-SI increased by 30 per cent during the year ended March 2011, constituting around twothirds of the total liabilities (Table VI.36).
Secured borrowings constitute the largest source of funds for NBFCs-ND-SI, followed by unsecured borrowings, and reserves and surplus.
6.46 NBFCs-ND-SI sector is growing rapidly and borrowings comprise their largest source of funds, mostly sourced from banks/FIs. Thus, they have a systemic linkage and need to be monitored closely to ensure that they do not pose any risk to the system. To the extent that they rely on bank financing, there is an indirect exposure to depositors. While the concentration of funding has risks, the caps on bank lending to NBFCs may constrain their growth. The leverage ratio of the entire NBFCs-ND-SI sector rose to 2.93 during 2010-11. This sector’s exposure towards the sensitive sector that is prone to potential boom-bust cycles such as capital market also shows an increase. Rapid financial diversification has also posed new challenges for regulators, especially in devising appropriate regulatory safeguards for the highly complex NBFI sector (Box VI.3). Borrowings of NBFCs-ND-SI by Region 6.47 The region-wise analysis of the total borrowings of the NBFCs-ND-SI reveals that the, Northern region along with the western region continued to account for more than 80 per cent of the total borrowings during the year ended March 2011 and March 2010; this trend continued during the quarter ended June 2011 also. All regions registered significant growth during the year ended March 2011 compared with the previous year. During the quarter ended June 2011, all regions continued with the same trend (Table VI.37). Financial Performance 6.48 The financial performance of the NBFCs- ND-SI sector improved significantly as reflected in the increase in net profit during 2010-11 compared to the previous year. The ROA remained same during the same period (Table VI.38). Both the Gross and Net NPAs as a ratio to total asset of the entire NBFCs-ND-SI sector declined during the year ended March 2011. As on June 2011, there was marginal increase in NPA ratio (Table VI.39). At end-March 2011, 104 companies out of 253 NBFCs-ND-SI companies relied on owned fund to fund their assets. However, few companies showed their dependence on ICDs/commercial paper/banks to fund the significant portion of their assets (Table VI.40).
6.49 As on March 2011, the majority of reported companies maintained stipulated minimum norm of 15 per cent capital adequacy as measured by CRAR (Table VI.41). This indicates that there was considerable scope for NBFC-NDSI to utilise its capital for further expansion. These companies were also largely dependent on the nationalised banks for their term loans, working capital loans, and debentures/CPs. New private banks have emerged as a second major bank group for these companies to raise term loans and working capital loans (Table VI.42).
Box VI.3: Recommendations of the Working Group on the Issues and Concerns in the NBFC Sector The Reserve Bank constituted a Working Group on the 'Issues and Concerns in the NBFC Sector' (Chairperson: Smt. Usha Thorat) to examine a range of emerging issues pertaining to the regulation of NBFC sector, viz., (i) To review the concept of ‘principal business’ and to re-examine the need for separate regulatory categories of NBFCs; (ii) To reassess the entry point norms for NBFCs; (iii) To revisit the current framework on exemptions to certain categories of NBFCs; (iv) To frame policy on multiple NBFCs within a single group and captive NBFCs floated by manufacturing or industrial houses; (v) To examine the need for convergence of regulation of NBFCs with that of best regulatory practices of banks; (vi) To recommend comprehensive ‘Disclosure norms’ for NBFCs; (vii) To examine the need to prescribe professional qualifications for Independent Directors on the Boards of NBFCs-ND-SI; (viii) To examine the need for monitoring assets in one or other type of NBFC; (ix) To arrive at a set of principles to guide the frequency and depth of supervision of NBFCs based on their size and interconnectedness with other institutions. The Report was placed on the Reserve Bank website on August 23, 2011 for eliciting public comments. The key recommendations of the Working Group are as follows: (i) The minimum net owned fund (NOF) requirement for all new NBFCs wanting to register with the Reserve Bank could be retained at the present `2 crore till the Reserve Bank of India Act is amended. The Reserve Bank should, however, insist on a minimum asset size of more than `50 crore for registering any new NBFC. Existing NBFCs below this limit may deregister or be asked to seek a fresh certificate of registration at the end of two years; (ii) NBFCs not accessing public funds may be exempted from registration provided their assets are below `1,000 crore; (iii) Any transfer of shareholding, direct or indirect, of 25 per cent and above, change in control, merger or acquisition of any registered NBFC should have prior approval of the Reserve Bank; (iv) The twin criteria of assets and income for determining the principal business of an NBFC should be increased to 75 per cent of the total asset and 75 per cent of the total income, respectively. A time period of three years may be given to fulfill revised principal business criteria; (v) Tier I capital for Capital to Risk Weighted Assets Ratio (CRAR) purposes may be specified at 12 per cent to be achieved in three years for all registered deposit taking and non-deposit taking NBFCs; (vi) Liquidity ratio may be introduced for all registered NBFCs such that cash, bank balances and holdings of government securities fully cover the gaps, if any, between cumulative outflows and cumulative inflows for the first 30 days; (vii) Asset classification and provisioning norms similar to banks to be brought in phased manner for NBFCs. Suitable income tax deduction akin to banks may be allowed for provisions made under the regulations. Accounting norms applicable to banks may be applied to NBFCs; (viii) NBFCs may be subject to similar regulations as banks while lending to stock brokers and merchant banks and to similar regulation for stock brokers, as specified by the Securities and Exchange Board of India (SEBI), while undertaking margin financing; (ix) Financial conglomerate approach may be adopted for supervision of larger NBFCs that have stock brokers and merchant bankers in the group; (x) Government owned entities that qualify as NBFCs may comply with the regulatory framework applicable to NBFCs at the earliest. (xi) Board approved limits for bank’s exposure to real estate may be made applicable for the bank group as a whole, where there is an NBFC in the group. The risk weights for NBFCs that are not sponsored by banks or that do not have any bank as part of the group may be raised to 150 per cent for capital market exposures (CME) and 125 per cent for commercial real estate (CRE) exposures. In case of bank sponsored NBFCs, the risk weights for CME and CRE may be the same as specified for banks; (xii) Captive NBFCs, the business models of which focus mainly (90 per cent and above) on financing parent company’s products, may maintain Tier I capital at 12 per cent from the time of registration. Supervisory risk assessment of such companies should take into account the risk of the parent company; (xiii) For the purpose of applicability of registration and supervision, the total assets of all NBFCs in a group should be taken together to determine the cut off limit of `100 crore; (xiv) All NBFCs with assets of `100 crore and above, whether listed or not, should be required to comply with mandatory disclosures under Clause 49 of SEBI Listing Agreements. (xv) Disclosure for NBFCs with assets of `100 crore and above may include provision coverage ratio, liquidity ratio, asset liability profile, extent of financing of parent company products, movement of non-performing assets (NPAs), offbalance sheet exposures, structured products and securitizations/assignments. (xvi) NBFCs with assets of `1,000 crore and above should be inspected comprehensively on an annual basis and be subjected to annual stress testing to ascertain their vulnerability. 4. Primary Dealers 6.50 As on June 30, 2011, there were 21 Primary Dealers (PDs), of which 13 were banks carrying on Primary Dealership business departmentally (Bank-PDs) and the remaining eight were non-bank entities, known as standalone PDs, registered as NBFCs under Section 45 IA of the RBI Act, 1934. In April 2011, Goldman Sachs (India) Capital Markets Private Limited was given authorisation to undertake PD business on a standalone basis. Further, pursuant to the merger of IDBI Gilts Limited with its parent entity, IDBI Bank Limited was authorised to undertake PD business departmentally from April 2011. Operations and Performance of PDs 6.51 During the year 2010-11, the actual bids submitted by PDs collectively (including bank- PDs) in Treasury Bills (T-Bills) auctions were `6,87,416 crore compared to their bidding commitment of `3,66,320 crore. The success ratio, i.e., the total amount of bids of the PDs accepted to the total commitment of the PDs increased to 62 per cent from 56 per cent during 2009-10. In Cash Management Bills (CMBs) auctions, as against the total notified amount of `12,000 crore, PDs submitted bids for `38,495 crore, out of which 68.1 per cent of total bids of the PDs were accepted. PDs are required to achieve a minimum success ratio of 40 per cent for T-Bills and CMBs put together on a half-yearly basis. All the PDs had achieved the stipulated minimum success ratio in both the first and second half of 2010-11. 6.52 During the year 2010-11, dated G-Sec were issued for `4,37,000 crore by the Government of India under the market borrowing programme. PDs (including bank- PDs), offered to underwrite dated G-Sec amounting to `7,97,545 crore against the notified amount of `4,37,000 crore. In the dated G-Sec auctions, the share of the PDs (bids accepted to the securities issued) increased to 49.6 per cent in 2010-11 from 42.0 per cent in 2009-10 (excluding devolvements) (Table VI. 43). Partial devolvement on the PDs took place on 6 instances for `5,772.7 crore during 2010-11 as compared to 18 instances for `7,219.2 crore in 2009-10. Performance of Standalone PDs 6.53 During 2010-11, in the secondary G-Sec market, the share of turnover of standalone PDs to the total turnover of market participants increased from 15.9 per cent to 19 per cent with respect to outright transactions and from 7 per cent to 14 per cent in the case of repo transactions. Overall, the share of standalone PDs increased from 8.7 per cent to 16 per cent (Table VI.44). Sources and Application of Funds of Standalone PDs 6.54 During the year 2010-11, IDBI Gilts Ltd. and Nomura Fixed Income Securities Ltd. had infused fresh capital. However, on account of partial buy-back of its capital by SBI DFHI Ltd., the capital as also reserves and surplus of the PDs put together declined marginally. While the unsecured loans of the PDs declined by 24 per cent, secured loans increased by 152 per cent. 6.55 As regards application of funds, investments in G-Sec increased by 38 per cent in 2010-11 compared to a decline of 14 per cent in 2009-10. However, investments in corporate bonds increased by 32 per cent as compared with 77 per cent in 2009-10 (Table VI.45). Financial Performance of Standalone PDs 6.56 Notwithstanding the turnaround in the trading income, net profit of the PDs declined by about 22 per cent in 2010-11 mainly on account of increase in interest expenses and decline in other income. Hardening of G-Sec yields during the year impacted the treasury profits of standalone PDs (Table VI.46 and Appendix Table VI.2). 6.57 Overall, Return on Assets (ROA) decreased from 1.8 per cent in 2009-10 to 1.1 per cent in 2010-11 following the decline in net profit by 22 per cent while average assets rose by 30 per cent (Table VI.47). Stand-alone PDs continued to be well capitalised. The CRAR of individual standalone PDs remained above the prescribed minimum of 15 per cent as at end-March 2011. The CRAR of the stand-alone PDs as a group worked out to 46.2 per cent as at end-March 2011 (Table VI.48 and Appendix Table VI.3). The Government securities held by primary dealers as percentage to total assets has gone up to 66 per cent as at end-March 2011 from 61 per cent in the previous year (Table VI. 49). 5. Conclusions 6.58 The resources raised by FIs during 2010- 11 were significantly higher over the previous year. All resource raising components, shortterm, long-term and foreign currency resources witnessed a sharp rise. However, the weighted average cost of Rupee resources raised went up across the board. The financial performance of the FIs deteriorated during 2010-11 due to decrease in operating profit and net profit. There was a sharp rise in operating expenses during the year mainly on account of wage revision. There was an increase in the amount of net NPAs of the FIs in 2010-11. The CRAR of all the FIs were above the stipulated minimum norm of 9 per cent indicating the scope for utilisation of capital for further credit expansion. 6.59 The financial performance of NBFCs-D showed improvement as reflected in an increase in the ratio of net profit to total assets during 2010-11. There was a decline in the shares of all three NPA categories such as sub-standard, doubtful and loss assets of NBFCs-D underlining the improvement in asset quality. Most of the NBFCs-D had CRAR of more than 15 per cent indicating the consolidation process in the sector. The size of balance sheet of NBFCs-D has expanded. On the asset side, loans and advances remain the most important source followed by investment. There was an increase in the share of deposits ranging more than two years and up to three years maturity category. More than two-thirds of total assets of the NBFCs-D sector were held by asset finance companies.
6.60 The financial performance of the NBFCs- ND-SI sector also improved significantly as reflected in the increase in net profit. But, the net profit as a ratio to total assets remained same during 2010-11. This sector is growing rapidly and borrowings comprise their largest source of funds mostly sourced from banks/FIs. Thus, they have systemic financial linkage that need to be monitored closely to ensure that they do not pose any risk. 6.61 The net profit of the PDs declined in 2010-11 mainly due to disproportionate increase in interest expenses and decline in other income. The hardening of G-Sec yields during the year had impact on the profits of stand-alone PDs. 6.62 The existing supervisory framework relating to NBFCs sector has to be enhanced to reflect the ongoing changes in perception of risk due to existence of regulatory arbitrage, rapid asset growth, extent of interconnectedness with the financial sector. |
|||||||||||||||||||||||||||||||||||||||||||||||||||||||||||||||||||||||||||||||||||||||||||||||||||||||||||||||||||||||||||||||||||||||||||||||||||||||||||||||||||||||||||||||||||||||||||||||||||||||||||||||||||||||||||||||||||||||||||||||||||||||||||||||||||||||||||||||||||||||||||||||||||||||||||||||||||||||||||||||||||||||||||||||||||||||||||||||||||||||||||||||||||||||||||||||||||||||||||||||||||||||||||||||||||||||||||||||||||||||||||||||||||||||||||||||||||||||||||||||||||||||||||||||||||||||||||||||||||||||||||||||||||||||||||||||||||||||||||||||||||||||||||||||||||||||||||||||||||||||||||||||||||||||||||||||||||||||||||||||||||||||||||||||||||||||||||||||||||||||||||||||||||||||||||||||||||||||||||||||||||||||||||||||||||||||||||||||||||||||||||||||||||||||||||||||||||||||||||||||||||||||||||||||||||||||||||||||||||||||||||||||||||||||||||||||||||||||||||||||||||||||||||||||||||||||||||||||||||||||||||||||||||||||||||||||||||||||||||||||||||||||||||||||||||||||||||||||||||||||

Share this page:


Install the RBI mobile application and get quick access to the latest news!
Scan the QR code to install our app


Page Last Updated on:


