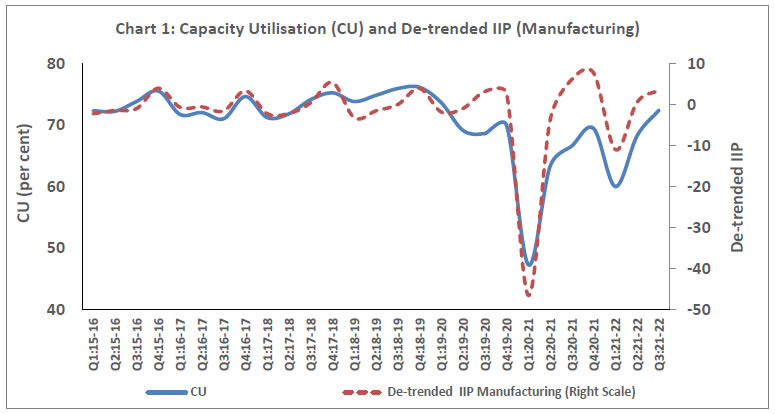
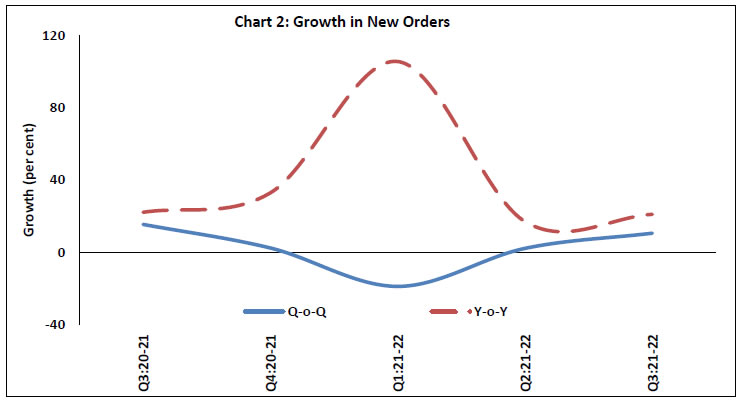
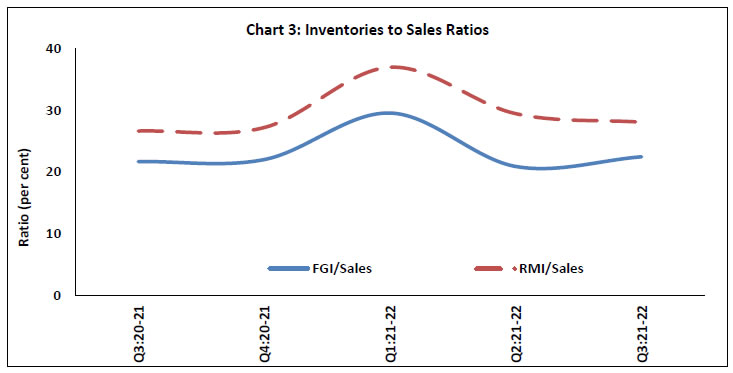
OBICUS Survey on the Manufacturing sector for Q3:2021-22
Today, the Reserve Bank released the results of the 56th round of the quarterly Order Books, Inventories and Capacity Utilisation Survey (OBICUS), which provides a snapshot of demand conditions in India’s manufacturing sector1 during October-December 2021. The survey covered 800 manufacturing companies.
Highlights:
The capacity utilisation (CU) for the manufacturing sector at the aggregate level picked-up further to 72.4 per cent in Q3:2021-22 from 68.3 per cent recorded in the previous quarter reflecting improved manufacturing activities (Chart 1 and Table 1).
Manufacturing companies received more new orders during Q3:2021-22 as compared with that in the previous quarter as well as their level a year ago (Chart 2 and Table 2A).
The finished goods inventory (FGI) to sales ratio marginally increased during Q3:2021-22 whereas raw material inventory (RMI) to sales ratio recorded a decline. Both these ratios were higher than their corresponding levels a year ago but underwent large swing resulting from high volatility in manufacturing activities during the pandemic (Chart 3 and Table 3A).
Table 1: IIP*-Manufacturing and Capacity Utilisation (CU)
Quarter
Number of responding companies
Capacity Utilisation
IIP-Manufacturing (Quarterly Average)
De-trended Quarterly IIP-Manufacturing
Q3:2020-21
610
66.6
133.2
6.1
Q4:2020-21
557
69.4
136.5
7.6
Q1:2021-22
640
60.0
119.1
-11.0
Q2:2021-22
728
68.3
131.6
0.5
Q3:2021-22
757
72.4
135.1
3.5
*: Index of Industrial Production (Base: 2011-12)
Table 2A: Order Books Growth (Q3:2020-21 to Q3:2021-22)
Quarter
Number of companies
Q-o-Q Growth # (per cent) **
Y-o-Y Growth # (per cent)
Backlog Orders
New Order Book
Pending Orders
Backlog Orders
New Order Book
Pending Orders
Q3:2020-21
155
0.3
15.4
7.2
-13.8
22.1
-7.7
Q4:2020-21
85
7.6
2.3
-1.8
7.2
32.9
2.3
Q1:2021-22
120
-0.5
-19.0
5.3
11.8
105.7
17.3
Q2:2021-22
184
10.8
2.1
3.9
10.2
16.9
15.1
Q3:2021-22
205
3.5
10.5
7.8
19.5
20.9
20.5
#: Growth rates are calculated using three rounds common set of companies, namely, companies responded in the current quarter, one quarter ago and the same quarter a year ago. **: Not seasonally adjusted.
Table 2B: Average Size of Order Books (Q3:2020-21 to Q3:2021-22)
Quarter
Number of companies
Average Amount (₹ Crores)
Backlog Orders
New Order Book
Pending Orders
Q3:2020-21
155
181.2
242.7
194.2
Q4:2020-21
85
199.8
243.4
196.3
Q1:2021-22
120
188.1
171.0
197.8
Q2:2021-22
184
197.9
195.7
207.4
Q3:2021-22
205
182.3
224.4
196.6
Table 3A: Sales and Inventories Ratios (Q3:2020-21 to Q3:2021-22)
Quarter
Number of Companies
Ratio (per cent) #
Total Inventory / Sales
Finished Goods Inventory / Sales
Raw Material Inventory / Sales
Q3:2020-21
471
56.8
21.7
26.6
Q4:2020-21
418
57.5
22.0
27.2
Q1:2021-22
478
78.6
29.5
36.9
Q2:2021-22
537
60.5
20.9
29.4
Q3:2021-22
681
58.1
22.4
28.0
#: Weighted average of industry level ratios using GVA as weights
Table 3B: Average Sales and Inventories (Q3:2020-21 to Q3:2021-22)