RbiSearchHeader

Press escape key to go back

Past Searches

Theme
Theme
Text Size
Text Size
S3

RbiAnnouncementWeb

RBI Announcements
RBI Announcements

Asset Publisher

83799271

OBICUS Survey on the Manufacturing sector - Q1:2017-18

Today, the Reserve Bank released results of the 38th round of the Order Books, Inventories and Capacity Utilisation Survey (OBICUS) for the quarter April-June 2017 covering 805 manufacturing companies. The survey provides a snapshot of demand conditions in the Indian manufacturing sector1.

Highlights:

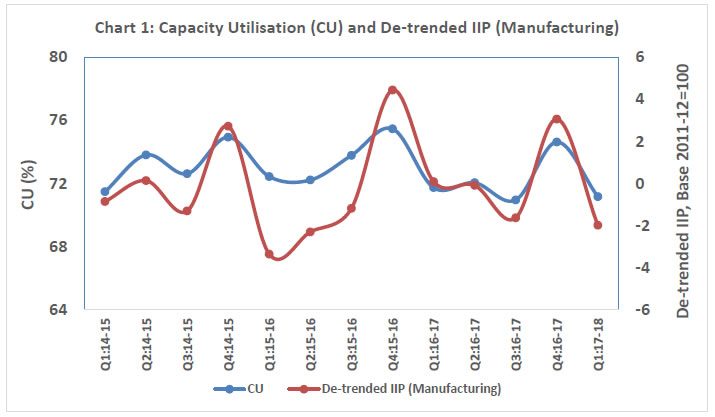
1) Capacity Utilisation (CU)2: At the aggregate level, CU recorded a decline3 and stood at 71.2 per cent in Q1:2017-18, co-moving with the de-trended index of industrial production4 (IIP) for the manufacturing sector (Chart 1).

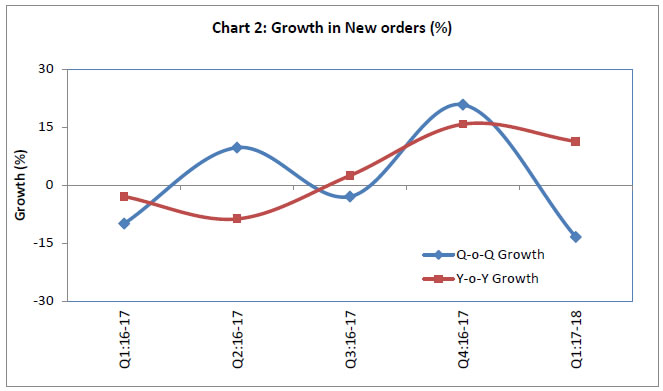
2) Order Books: New orders recorded a contraction in Q1:2017-18 from the previous quarter, but a substantial improvement was observed over their level a year ago (Chart 2).

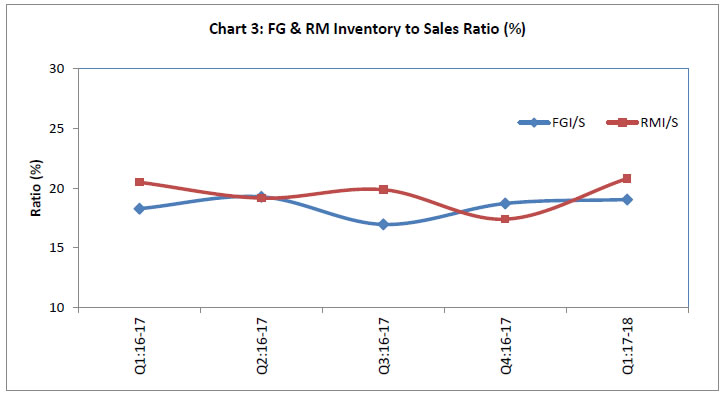
3) Finished Goods Inventory to Sales Ratio: The finished goods inventory to sales ratio (FGI/S) rose sequentially in Q1:2017-18 and was also higher on a year-on-year basis.

4) Raw Material Inventory to Sales Ratio: The raw material inventory to sales ratio (RMI/S) rose significantly in Q1:2017-18 from the previous quarter’s level (Chart 3).


ANNEX 1: Data Tables

Table 1.1: IIP-Manufacturing and Capacity Utilisation (CU) –
(Not based on common set of companies)
Quarter IIP-Mfg.
(Quarterly Average
Base 2011-12)
De-trended Quarterly IIP-Manufacturing Capacity Utilisation
Q1:2016-17 119.2 0.1 71.7
Q2:2016-17 120.0 -0.1 72.0
Q3:2016-17 119.5 -1.6 71.0
Q4:2016-17 125.2 3.1 74.6
Q1:2017-18 121.1 -2.0 71.2

Table 1.2: Order Books (Q1:2016-17 to Q1:2017-18) –
(Based on common set of 156 companies in 9 quarters)*
Quarter Amount (₹ Billion) Q-o-Q Growth (%)** Y-o-Y Growth (%)
Average Backlog Orders Average New Order Book Average Pending Orders Average Backlog Orders Average New Order Book Average Pending Orders Average Backlog Orders Average New Order Book Average Pending Orders
Q1:2016-17 0.718 0.636 0.705 -6.0 -10.0 -1.9 2.9 -2.9 -3.3
Q2:2016-17 0.704 0.698 0.692 -1.9 9.7 -1.8 -3.7 -8.7 -11.2
Q3:2016-17 0.692 0.677 0.717 -1.7 -3.0 3.6 -11.5 2.5 -6.1
Q4:2016-17 0.717 0.818 0.642 3.6 20.8 -10.5 -6.1 15.7 -10.7
Q1:2017-18 0.642 0.708 0.694 -10.5 -13.4 8.1 -10.6 11.3 -1.6
*: As required for calculating growth rates in recent 5 quarters.
**: Not seasonally adjusted

Table 1.3: Average Sales and Inventories (Q1:2016-17 to Q1:2017-18) –
(Based on common set of 372 companies in 5 quarters)
Quarter Amount (₹ Billion) Ratio (per cent)
Average Sales Average Total Inv Average FG Inv Average WiP Inv Average RM Inv Total Inv /Sales FG Inv /Sales RM Inv /Sales
Q1:2016-17 3.664 1.658 0.670 0.237 0.751 45.3 18.3 20.5
Q2:2016-17 3.700 1.666 0.713 0.243 0.709 45.0 19.3 19.2
Q3:2016-17 3.975 1.745 0.674 0.280 0.790 43.9 17.0 19.9
Q4:2016-17 4.266 1.810 0.799 0.269 0.742 42.4 18.7 17.4
Q1:2017-18 4.008 1.873 0.764 0.275 0.834 46.7 19.1 20.8
RM - Raw Material; WiP - Work in progress; FG - Finished Goods; Inv – Inventory.

ANNEX 2: Change in the Methodology for the Compilation of Capacity Utilisation (CU)

The OBICUS survey captures information from selected companies in the manufacturing sector on installed capacity vis-a-vis actual production (in quantity and value terms) for different products. The methodology for aggregating this information to arrive at an estimate of the capacity utilisation (CU) for the manufacturing sector was published earlier in the December 2011 issue of the Reserve Bank’s Bulletin (link: /documents/87730/39710577/05_ARB091211.pdf). The methodology of compiling the CU has been changed from the current round of the survey based on the recommendations of the Technical Advisory Committee on Surveys (TACS) constituted by the Reserve Bank. Details of the changes adopted are given below:

  • The CU for a quarter is now estimated based on all reporting companies in that round after removing any outlier. Earlier, a set of common reporting companies for five successive rounds was considered for better comparability of quarter-on-quarter and year-on-year changes, but resulting in some information loss.

  • The product classification has been aligned with the latest National Industrial Classification (NIC 2008).

  • For aggregation of CU from the product level/5-digit group level to the 3-digit group level, the weights are proportional to the installed capacity, in terms of value, instead of, in terms of quantity.

  • For aggregation beyond the 3-digit group level, the weights are now based on the Gross Value Added (GVA), as obtained from the Annual Survey of Industries (ASI), 2013-14, as against the weights based on Net Value Added (NVA) of ASI 2004-05.

The time-series on CU since Q1:2013-14, based on new and old methodologies is provided in the Table below for ready reference.

Time-series on CU based on New and Old methodologies
Quarter CU
(New Method)
CU
(Old Method)
Q1:2013-14 72.0 71.6
Q2:2013-14 73.8 72.8
Q3:2013-14 71.5 73.5
Q4:2013-14 74.9 76.1
Q1:2014-15 71.5 70.2
Q2:2014-15 73.7 73.6
Q3:2014-15 72.5 71.7
Q4:2014-15 74.8 74.0
Q1:2015-16 72.3 72.0
Q2:2015-16 72.2 71.1
Q3:2015-16 73.8 72.2
Q4:2015-16 75.5 74.4
Q1:2016-17 71.7 71.5
Q2:2016-17 72.0 71.0
Q3:2016-17 71.0 72.1
Q4:2016-17 74.6 74.1

1 The survey responses are those of the respondents. The 37th round of the OBICUS covering 724 manufacturing companies with reference period as January-March 2017 was released on the RBI website on August 02, 2017.

2 The Reserve Bank has revised the methodology for the compilation of capacity utilisation from the current round and summary of the same is provided in Annex 2.

3 However, seasonally adjusted CU remained flat.

4 IIP is calculated on a fixed base (currently 2011-12=100) whereas the denominator (viz. installed capacity) in CU is updated every quarter. For comparison, the trend component of IIP is removed.

RbiTtsCommonUtility

PLAYING
LISTEN

Related Assets

RBI-Install-RBI-Content-Global

RbiSocialMediaUtility

Install the RBI mobile application and get quick access to the latest news!

Scan Your QR code to Install our app

RbiWasItHelpfulUtility

Was this page helpful?