In the backdrop of global financial crisis and its repercussions on the Indian economy, the year 2008-09 has been a testing year for the Indian banking sector. The Indian banking sector, however, withstood this test and the resilience of this sector was more than evident. The Indian banks were largely immune from the crisis, as their exposure to toxic assets was minimal. More importantly, the Reserve Bank’s initiatives regarding adoption of counter-cyclical prudential regulations framework, both during credit boom period as well as during the slowdown, proved to be successful. The capital to risk-weighted assets ratio (CRAR) of SCBs improved to 13.2 per cent as at end-March 2009 from 13.0 per cent as at end-March 2008. Furthermore, the gross non-performing assets (NPA) to gross advances ratio of SCBs as at end March 2009 remained at last year’s level of 2.3 per cent. The Return on Assets (ROA) also remained at last year’s level of 1.0 per cent. Significantly, the Return on Equity (ROE) increased to 13.3 per cent during 2008-09 from 12.5 per cent during 2007-08, indicating increased efficiency with which capital is used by the banks. Thus, though the expansion of the balance sheet moderated, the asset quality was maintained. Going forward, the challenge for the banking sector would be to support credit growth, as the Indian economy moves closer to the higher growth trajectory, while ensuring the efficiency and soundness of the sector.
1. Introduction
4.1 The balance sheets of Scheduled Commercial banks (SCBs)1 in India remained robust against the backdrop of global financial crisis. It is noteworthy that contrary to the trend in some advanced countries, the leverage ratio (Tier I capital to total assets ratio) in India has remained high reflecting the strength of the Indian banking system. However, the Indian banking sector was not completely insulated from the effects of the slowdown of the India economy.
4.2
The consolidated balance sheets of SCBs, expanded by 21.2 per cent as at end-March 2009 as compared with 25.0 per cent in the previous year. While the balance sheet of public sector banks maintained their growth momentum, the private sector banks and foreign banks registered a deceleration in growth rate.
4.3 During 2008-09, the growth rate of banks’ lending to industries, personal loans and services sector witnessed a deceleration, while growth rate of banks’ lending to agriculture and allied activities increased substantially. Overall, the incremental Credit–Deposit (C-D) ratio declined sharply reflecting the slowdown in credit growth, as corporates deferred their investments against the backdrop of widespread uncertainty. Growth rate of investments by banks decelerated marginally but the proportion of Statutory Liquidity Ratio (SLR) investment in Net Demand and Time Liabilities (NDTL) increased, reflecting a large Government market borrowing programme. Consequently, the incremental Investment Deposit (I-D) ratio rose.
4.4 In a reversal of trend, the Off-Balance Sheet (OBS) exposures of SCBs, which had witnessed exponential growth in recent years,
declined by 26.4 per cent on a year on year (y-o-y) basis. This was partly due to the appropriate prudential regulation implemented by the Reserve Bank in case of OBS exposures. The growth rate of income as well as that of expenditure of SCBs decelerated, leading to deceleration in growth rate of net profits. The Capital to Risk-Weighted Assets Ratio (CRAR) of SCBs improved to 13.2 per cent at end-March 2009 from 13.0 per cent a year ago, thus, remaining significantly above the stipulated minimum of 9.0 per cent.
4.5
SCBs did not raise any resources from the primary market during 2008-09 mainly reflecting the lacklustre performance of the stock market. However, banks preferred to raise resources through debt issues in the private placement market.
4.6
The growth rate of the balance sheets of Local Area Banks (LABs) and their financial performance also witnessed a deceleration. The Regional Rural Banks (RRBs) however, withstood the adversities and their balance sheets continued to grow with almost the same pace.
4.7
This chapter profiles the operations and financial performance of SCBs at the aggregate as well as bank group levels. It is organised into thirteen sections. Section 2 analyses the balance sheet operations of SCBs on an aggregate basis, while Section 3 delineates their off-balance sheet operations. Financial performance of SCBs is analysed in Section 4. Section 5 delineates the trends in soundness indicators. Operations of SCBs in the capital market are detailed in Section 6, while technological developments in banking during the year are covered in Section 7. Regional spread of banking is set out in Section 8. Section 9 presents an update on customer service and financial inclusion. The progress in regard to micro finance initiatives is captured in Section 10. Apart from the SCBs, 86 regional rural banks (RRBs)2 and four local area banks (LABs) were also operating in the country. While the performance of SCBs forms the core of this chapter, the performance of RRBs and LABs is detailed separately in Section 11 and Section 12, respectively. Section 13 draws broad conclusions based on the discussion in the earlier sections.
2. Liabilities and Assets of Scheduled Commercial Banks
4.8
At end-March 2009, there were 80 Scheduled Commercial Banks (SCBs) in India3. The growth rate of consolidated balance sheet of SCBs decelerated to 21.2 per cent in 2008-09 from 25.0 per cent in 2007-08. The assets of SCBs, however, continued to grow at a higher rate than the nominal gross domestic product (GDP) (at current market prices) resulting in a higher ratio of assets of SCBs to GDP. This ratio increased to 98.5 per cent at end-March 2009 from 91.6 per cent at end-March 2008.
4.9
It is noteworthy that contrary to the trend in some advanced countries, the leverage ratio4 in India has remained high reflecting the strength of the Indian banking system. For instance, as observed by the World Bank (2009)5, the leverage ratio of banks in the UK witnessed a decline throughout 1990s, which was accentuated after
2000 to reach a level of about 3 per cent by 2008 from around 5 per cent in the 1990s. On the other hand, the leverage ratio for Indian banks has risen from about 4.1 per cent in March 2001 to reach a level of 6.3 per cent by March 2009.
4.10 The composition of liabilities of SCBs broadly remained same during 2008-09 as compared to 2007-08. The growth rate of term deposits accelerated to 27.3 per cent as at end March 2009, from 24.8 per cent last year. The growth rate of demand deposits decelerated to 6.9 per cent from 24.9 per cent during the same period reflecting slowdown in economic
activity. The slowdown in growth of assets side of the balance sheet was reflected in corresponding deceleration in the growth of loans and advances component. As at end-March 2009, the cash and balances of SCBs with the Reserve Bank declined mainly on account of softening of CRR. However, the balances of SCBs with banks and money at call and short notice registered an increase, thus reversing the pattern witnessed as at end-March 2008 [Table IV.1 and Table IV.2].
4.11 While the balance sheets of public sector banks maintained their growth momentum, the
private sector banks and foreign banks registered a deceleration in growth rate. Furthermore, the old private sector banks, which had been registering a significantly lower growth rate than their newer counterparts in the recent past, managed a better performance this year [Appendix Table IV.1 (A) to (C)].
Table IV.1: Consolidated Balance Sheet of Scheduled Commercial Banks |
(Amount in Rs. crore) |
Item
|
As at end-March |
2008 |
2009 |
Amount |
Per cent to total |
Amount |
Per cent to total |
1 |
2 |
3 |
4 |
5 |
1. |
Capital |
39,963 |
0.9 |
44,037 |
0.8 |
2. |
Reserve and Surplus |
2,75,524 |
6.4 |
3,24,218 |
6.2 |
3. |
Deposits |
33,20,061 |
76.7 |
40,63,203 |
77.5 |
| |
3.1. |
Demand Deposits |
4,42,056 |
10.2 |
4,72,578 |
9.0 |
| |
3.2. |
Savings Bank Deposits |
7,44,051 |
17.2 |
8,74,539 |
16.7 |
| |
3.3. |
Term Deposits |
21,33,953 |
49.3 |
27,16,084 |
51.8 |
4. |
Borrowings |
3,02,629 |
7.0 |
3,23,184 |
6.2 |
5. |
Other Liabilities and Provisions |
3,87,987 |
9.0 |
4,86,685 |
9.3 |
Total Liabilities/Assets |
43,26,166 |
100 |
52,41,330 |
100 |
1. |
Cash and Balances with RBI |
3,22,971 |
7.5 |
2,97,263 |
5.7 |
2. |
Balances with Banks and Money at Call and Short Notice |
1,09,109 |
2.5 |
1,98,581 |
3.8 |
3. |
Investments |
11,77,329 |
27.2 |
14,49,474 |
27.7 |
| |
3.1 |
Government Securities (a+b) |
9,25,723 |
21.4 |
11,64,444 |
22.2 |
| |
|
a) In India |
9,20,165 |
21.3 |
11,58,714 |
22.1 |
| |
|
b) Outside India |
5,558 |
0.1 |
5,730 |
0.1 |
| |
3.2 |
Other Approved Securities |
10,587 |
0.2 |
8,153 |
0.2 |
| |
3.3 |
Non-Approved Securities |
2,41,017 |
5.6 |
2,76,876 |
5.3 |
4. |
Loans and Advances |
24,76,936 |
57.3 |
30,00,906 |
57.3 |
| |
4.1 |
Bills purchased and Discounted |
1,50,988 |
3.5 |
1,73,910 |
3.3 |
| |
4.2 |
Cash Credits, Overdrafts, etc. |
8,88,882 |
20.5 |
11,13,556 |
21.2 |
| |
4.3 |
Term Loans |
14,37,065 |
33.2 |
17,13,439 |
32.7 |
5. |
Fixed Assets |
42,394 |
1.0 |
48,361 |
0.9 |
6. |
Other Assets |
1,97,425 |
4.6 |
2,46,743 |
4.7 |
Note : Data for 2007-08 are as reported in the balance sheets of banks for 2008-09 and hence may not match with those reported in the Report on Trend and Progress of Banking in India, 2007-08, as the figures for 2007-08 were revised by some banks.
Source: Balance Sheets of respective Banks.
|
Table IV.2: Growth of Balance Sheet of Scheduled Commercial Banks - Bank Group-wise |
(Per cent) |
Item
|
As at end-March |
2008 |
2009 |
Public Sector Banks |
Old Private Sector Banks |
New Private Sector Banks |
Foreign Banks |
All SCBs |
Public Sector Banks |
Old Private Sector Banks |
New Private Sector Banks |
Foreign Banks |
All SCBs |
1 |
2 |
3 |
4 |
5 |
6 |
7 |
8 |
9 |
10 |
11 |
1. |
Capital |
5.2 |
1.8 |
14.6 |
71.4 |
35.2 |
3.6 |
8.2 |
-3.1 |
16.3 |
10.2 |
2. |
Reserve and Surplus |
31.3 |
47.1 |
97.9 |
34.7 |
45.3 |
20.4 |
14.6 |
9.1 |
25.8 |
17.7 |
3. |
Deposits |
23.1 |
19.8 |
23.1 |
26.8 |
23.1 |
26.9 |
20.3 |
5.4 |
12.0 |
22.4 |
| |
3.1. |
Demand Deposits |
20.4 |
23.4 |
38.6 |
28.3 |
24.6 |
9.9 |
1.8 |
1.1 |
2.3 |
6.9 |
| |
3.2. |
Saving Bank Deposits |
14.9 |
16.2 |
40.5 |
20.2 |
17.8 |
18.4 |
15.6 |
14.7 |
9.7 |
17.4 |
| |
3.3. |
Term Deposits |
27.0 |
20.2 |
16.0 |
27.7 |
24.8 |
33.1 |
24.2 |
3.9 |
18.0 |
27.3 |
4. |
Borrowings |
28.4 |
8.0 |
26.3 |
14.1 |
24.5 |
1.2 |
22.6 |
7.1 |
20.3 |
6.8 |
5. |
Other Liabilities and Provisions |
25.6 |
21.6 |
17.3 |
65.5 |
29.0 |
21.3 |
8.1 |
12.8 |
57.8 |
25.4 |
Total Liabilities/Assets |
23.8 |
21.2 |
27.5 |
32.7 |
25.0 |
24.6 |
19.3 |
6.7 |
22.8 |
21.2 |
1. |
Cash and Balances with RBI |
61.5 |
74.4 |
74.2 |
81.2 |
65.4 |
-2.4 |
-14.6 |
-20.7 |
-28.9 |
-8.0 |
2. |
Balances with Banks and Money at Call and Short Notice |
-32.6 |
-24.2 |
-33.7 |
-25.1 |
-31.1 |
106.5 |
47.1 |
27.8 |
66.8 |
82.0 |
3. |
Investments |
20.3 |
23.9 |
31.3 |
38.4 |
23.8 |
26.6 |
33.7 |
4.3 |
31.8 |
23.1 |
| |
3.1 |
Government Securities (a+b) |
20.5 |
20.0 |
21.8 |
47.4 |
22.7 |
30.6 |
27.3 |
7.7 |
20.7 |
25.8 |
| |
|
a. In India |
20.3 |
20.0 |
21.9 |
47.4 |
22.6 |
30.8 |
27.3 |
7.7 |
20.7 |
25.9 |
| |
|
b. Outside India |
58.3 |
0 |
-53.6 |
0 |
49.3 |
4.0 |
0 |
-32.0 |
0 |
3.1 |
| |
3.2 |
Other Approved Securities |
-16.7 |
-20.7 |
12.0 |
-60.9 |
-17.0 |
-22.8 |
-24.3 |
-12.0 |
-80.7 |
-23.0 |
| |
3.3 |
Non-Approved Securities |
23.3 |
42.1 |
57.0 |
5.7 |
31.2 |
11.9 |
58.2 |
-2.8 |
89.4 |
14.9 |
4. |
Loans and Advances |
24.8 |
20.2 |
26.4 |
27.5 |
25.0 |
25.7 |
15.1 |
9.9 |
2.7 |
21.2 |
| |
4.1 |
Bills Purchased and Discounted |
16.3 |
36.9 |
36.8 |
36.6 |
21.5 |
18.3 |
7.0 |
16.1 |
-3.8 |
15.2 |
| |
4.2 |
Cash Credits, Overdrafts, etc. |
24.3 |
18.5 |
31.0 |
33.8 |
25.2 |
29.4 |
15.1 |
9.4 |
9.2 |
25.3 |
| |
4.3 |
Term Loans |
26.1 |
19.9 |
24.6 |
21.2 |
25.3 |
24.0 |
16.1 |
9.6 |
-1.6 |
19.2 |
5. |
Fixed Assets |
42.6 |
26.1 |
15.9 |
32.3 |
35.2 |
17.2 |
8.0 |
1.2 |
19.4 |
14.1 |
6. |
Other Assets |
31.0 |
-1.7 |
28.3 |
67.0 |
38.2 |
2.0 |
28.2 |
19.8 |
68.1 |
25.0 |
Source: Balance Sheets of respective banks. |
4.12 The public sector banks’ share in aggregate assets, deposits, advances and investments increased as at end-March 2009 vis-a-vis last year, while the shares of private sector banks registered a decline. This was mainly on account of the strong balance sheet growth registered in case of public sector banks, against the backdrop of deceleration in growth rate of other bank groups (Table IV.3).
Deposits
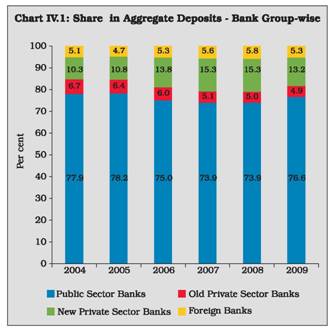
4.13 The growth rate of aggregate deposits of SCBs decelerated to 22.4 per cent as at end March 2009 from 23.1 per cent as at end March 2008 and that of 24.6 per cent in the previous year. The importance of Certificates of Deposit (CDs) as means of raising resources continued during 2008-09, albeit with some deceleration in growth rate. CDs outstanding as percentage of aggregate deposits stood at 4.7 per cent (Appendix Table IV.2).
4.14 In terms of bank group wise share in deposits, the public sector banks not only continued to be the leaders, their share also increased, while that of other bank groups witnessed a decline (Chart IV.1).
Table IV.3: Major Components of Balance Sheets of Scheduled Commercial Banks - Bank Group-wise
(As at end-March) |
(Per cent) |
Bank Group
|
Assets |
Deposits |
Advances |
Investments |
2008 |
2009 |
2008 |
2009 |
2008 |
2009 |
2008 |
2009 |
1 |
2 |
3 |
4 |
5 |
6 |
7 |
8 |
9 |
Public Sector Banks |
69.9 |
71.9 |
73.9 |
76.6 |
72.6 |
75.3 |
67.9 |
69.9 |
Nationalised Banks |
43.5 |
44.2 |
48.4 |
49.1 |
45.3 |
47.2 |
42.7 |
41.7 |
State Bank Group |
23.4 |
24.4 |
23.3 |
24.8 |
24.0 |
24.6 |
22.4 |
24.7 |
Other Public Sector Bank |
3.0 |
3.3 |
2.2 |
2.8 |
3.3 |
3.4 |
2.8 |
3.5 |
Private Sector Banks |
21.7 |
19.6 |
20.3 |
18.1 |
20.9 |
19.2 |
23.7 |
21.1 |
Old Private Sector Banks |
4.5 |
4.4 |
5.0 |
4.9 |
4.5 |
4.3 |
4.6 |
5.0 |
New Private Sector Banks |
17.2 |
15.2 |
15.3 |
13.2 |
16.4 |
14.9 |
19.1 |
16.2 |
Foreign Banks |
8.4 |
8.5 |
5.8 |
5.3 |
6.5 |
5.5 |
8.4 |
9.0 |
Scheduled Commercial Banks |
100.0 |
100.0 |
100.0 |
100.0 |
100.0 |
100.0 |
100.0 |
100.0 |
Source: Balance sheets of respective banks. |
4.15 The current account and saving account
(CASA) deposits are an important source of
raising resources at a lower rate for the banks.
Recently however, the growth rate of CASA
deposits has decelerated and their share in total
deposits has also declined, posing a challenge
for the banking sector (Box IV.1).
Non-Deposit Resources
4.16 Among the non-deposit resources,
growth in borrowings by banks decelerated to 6.8 per cent as at end March 2009 from 24.5 per cent in the previous year (refer Table IV.2). While during 2007-08, Rs.30,455 crore were raised by banks through public issues in the capital market, this source of raising resources virtually dried up in 2008-09, mainly due to subdued conditions in the primary as well secondary capital markets. Banks, however, raised substantially higher resources from the private placement market (refer to section 6 for details).
 International Liabilities of Banks
4.17 The international liabilities of Indian banks (in Rs.terms) declined by 1.1 per cent as at end March 2009 as against an increase of 8.4 per cent during 2007-08. The decline of international liabilities was mainly due to decline in ‘other liabilities’ like ADRs/GDRs reflecting the drying up of overseas lines of credit for banks and corporates. On the other hand, in a reversal of trend, the share of foreign currency deposits in total international liabilities, which had witnessed a continuous fall during the period 2005-08, registered a sharp rise during 2008-09. This was mainly on account of the encouraging policy initiatives by Reserve Bank like upward adjustment of the interest rate ceiling on the foreign currency deposits by non-resident Indians, as also continuing confidence of depositors in Indian economy against the backdrop of international uncertainty (Table IV.4).
Box IV.1: Trends in Current Account and Saving Accounts Deposits (CASA) of SCBs
The share of current and saving accounts (CASA) deposits significantly influence the cost structure of commercial banks. Current accounts are primarily meant for companies, public enterprises and entrepreneurs having numerous banking transactions daily. On the other hand, savings accounts are the most common operating account for individuals and others for non-commercial transactions. Banks pay no interest on current accounts and an interest rate of 3.5 per cent on savings accounts. Thus, as compared to other modes of deposits, say fixed deposits, CASA deposits represent the cheapest mode of raising money. Consequently, the higher the CASA component in total deposits of a bank, the cheaper is its cost of deposits.
In the Indian context, the CASA deposits constitute more than a third of the total deposits (Table 1).
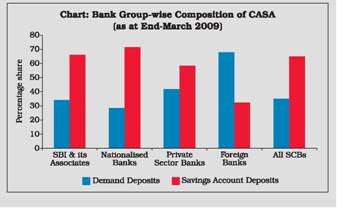
The foreign banks have the highest share of CASA deposits in total deposits, followed by SBI and its associates, nationalised banks, and private sector banks. This pecking order almost remained robust till March 2008, though a slight change was observed subsequently. Furthermore, there was a consistent decline in the share of CASA deposits at the consolidated level for the SCBs from the March 2006 to March 2009. Share of CASA deposit component in total deposits of all bank groups declined from March 2006 to March 2009, except for private sector banks which witnessed an increase in its CASA deposits share.
Table 1: Bank Group-wise Share of CASA Deposits in Total Deposits |
(per cent) |
Bank Groups |
End-March |
| |
2006 |
2007 |
2008 |
2009 |
1 |
2 |
3 |
4 |
5 |
State Bank of India & its associates |
43.4 |
42.9 |
42.0 |
38.6 |
Nationalised Banks |
38.2 |
35.4 |
33.0 |
29.9 |
Private Banks |
30.4 |
29.8 |
32.8 |
32.9 |
Foreign Banks |
50.5 |
45.1 |
44.7 |
41.7 |
All Scheduled Commercial Banks |
38.6 |
36.6 |
35.7 |
33.2 |
The CASA deposits of SCBs recorded a growth rate of 13.4 per cent as at end March 2009 as compared to that of 20.2 per cent in the preceding year, registering a deceleration. Growth of CASA deposits recorded marginal decline in nationalised banks, steep fall in case of private sector banks and foreign banks. For SBI and its associates, growth of CASA deposits in 2008-09 remained at the same level as in the previous year.
A disaggregated analysis suggests that as at end-March 2009, the share of current deposits was higher than saving bank deposits for foreign banks, while for other bank groups, the share of saving bank deposits is higher (Chart). Further, the share of demand deposits in CASA deposits declined as at end-March 2009, compared to the preceding year for all the bank groups. In growth terms, current deposits and saving bank deposits grew by 6.7 per cent and 17.4 per cent in March 2009 as compared to 24.6 per cent and 17.8 per cent in March 2008.
The declining share of CASA deposit in total deposits and the deceleration in their growth may pose a challenge for the banking sector. This is because as mentioned above, the CASA deposits constitute the cheapest source of funds for the banking sector. In case of drying up of this source, alternate sources may be not only difficult but also prove expensive. In the context of impending revival of economic growth, with commensurate increase in the credit needs of the economy, the banking industry may require to take initiatives to attract more CASA deposits.
 4.18 In line with the trend witnessed for last few years, the share of international liabilities of scheduled commercial banks in their total liabilities, continued to decline during 2008-09, mainly reflecting higher dependence of SCBs on domestic funds.
Bank Credit
4.19 The growth rate of loans and advances of SCBs, which was as high as 33.2 per cent as at end-March 2005 has been witnessing a slowdown since then. In continuation of the trend, the growth rate of aggregate loans and advances of SCBs decelerated to 21.2 per cent as at end-March 2009 from 25.0 per cent in the previous year. Apart from cyclical factors which lead to slowdown in growth after a period of high credit growth, the deceleration was accentuated this year due to the overall slowdown in the economy in the aftermath of global financial turmoil. Notwithstanding the deceleration in growth of the term loans, their share in investment in the economy increased to 81.0 per cent in 2008-09 from 77.8 per cent in the previous year (Chart IV.2).
Table IV.4: International Liabilities of Banks - By Type
(as at end-March) |
(Amount in Rs. crore) |
Item |
2007 |
2008 |
2009 |
1 |
2 |
3 |
4 |
1. |
Deposits and Loans |
2,71,403 |
2,89,362 |
3,23,205 |
| |
|
(75.2) |
(74.0) |
(83.6) |
| |
of which: |
|
|
|
| |
a) Foreign Currency Non-Resident Bank [FCNR(B)] |
68,086 |
60,340 |
72,783 |
| |
(18.9) |
(15.4) |
(18.8) |
| |
b) Foreign currency Borrowings * |
61,470 |
77,257 |
75,398 |
| |
(17.0) |
(19.8) |
(19.5) |
| |
c) Non-resident External Rupee (NRE) A/C |
1,12,907 |
1,11,301 |
1,24,488 |
| |
(31.3) |
(28.5) |
(32.2) |
| |
d) Non-Resident Ordinary |
6,855 |
11,387 |
20,686 |
| |
(NRO) Rupee Deposits |
(1.9) |
(2.9) |
(5.4) |
2. |
Own Issues of Securities/Bonds (including IMD/RIBs) |
10,036 |
9,166 |
6,864 |
| |
|
(2.8) |
(2.3) |
(1.8) |
3. |
Other Liabilities |
79,258 |
92,329 |
56,540 |
| |
|
(22.0) |
(23.6) |
(14.6) |
| |
of which: |
|
|
|
| |
a) ADRs/GDRs |
23,515 |
25,111 |
10,357 |
| |
(6.5) |
(6.4) |
(2.7) |
| |
b) Equity of banks held by non-residents |
40,328 |
45,603 |
18,932 |
| |
(11.2) |
(11.7) |
(4.9) |
| |
c) Capital/remittable profits of foreign banks in India and other unclassified international liabilities |
15,415 |
21,615 |
27,251 |
| |
(4.3) |
(5.5) |
(7.0) |
Total International Liabilities |
3,60,698 |
3,90,857 |
3,86,608 |
* : Inter-bank borrowings in India and from abroad and external commercial borrowings of banks.
Note: Figures in parentheses are percentages to total.
Source: Locational Banking Statistics (LBS). |
Sectoral Deployment of Bank Credit
4.20 The deceleration in bank credit growth witnessed during 2007-08 continued in 2008-09 as well mainly reflective of the slowdown in real economy as also cautious approach adopted by banks against the backdrop of growing uncertainties. The data suggests that growth rate of bank’s lending to industries, personal loans and services sector witnessed a deceleration, while bank’s lending to agriculture and allied activities increased substantially during 2008-09 (Table IV.5 and Appendix Table IV.3).
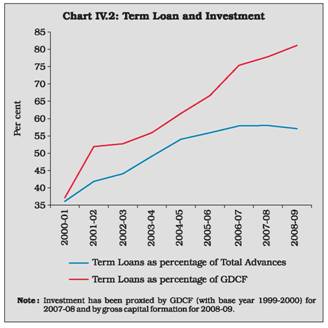
Table IV.5: Sectoral Deployment of Gross Bank Credit: Flows
(Variations over the year) |
(Amount in Rs. crore) |
Sector |
2007-08 |
2008-09 |
| |
Absolute |
Per cent |
Absolute |
Per cent |
1 |
2 |
3 |
4 |
5 |
1. |
Agriculture & Allied Activities |
44,966 |
19.5 |
63,313 |
23.0 |
2. |
Industry |
1,69,536 |
24.3 |
1,87,515 |
21.6 |
3. |
Personal Loans |
54,730 |
12.1 |
54,991 |
10.8 |
| |
of which: Housing |
26,802 |
11.6 |
19,165 |
7.4 |
4. |
Services |
1,32,419 |
31.5 |
93,580 |
16.9 |
| |
Of which: |
|
|
|
|
| |
(i) |
Wholesale Trade (other than food procurement) |
5,559 |
11.1 |
11,723 |
21.0 |
| |
(ii) |
Real Estate Loans |
19,235 |
43.6 |
28,261 |
44.6 |
| |
(iii) |
Non-Banking Financial Companies |
30,094 |
61.5 |
19,835 |
25.1 |
Total Non-Food Gross Bank Credit (1 to 4) |
4,01,650 |
22.3 |
3,99,400 |
18.1 |
Of which: |
|
|
|
|
Priority Sector |
1,11,414 |
17.5 |
1,68,506 |
22.5 |
Notes: 1. Data are provisional and relate to select banks. Data also include the effects of mergers of Bharat Overseas Bank with Indian Overseas Bank, American Express Bank with Standard Chartered Bank and State Bank of Saurashtra with State Bank of India.
2. Gross bank credit data include bills rediscounted with the Reserve Bank, Exim Bank, other financial institutions and inter-bank participations.
Source: Sectoral and Industrial Deployment of Bank Credit Return (Monthly). |
4.21 Provisional data on sectoral deployment of credit available till July 17, 2009 indicate that on year-on-year basis bank credit growth to industry, services and personal loans decelerated to 20.8 per cent, 13.8 per cent and 3.4 per cent, respectively, from 30.7 per cent, 36.9 per cent and 17.0 per cent. Growth of credit to agriculture accelerated to 29.1 per cent from 14.9 per cent in the same period of the previous year. Credit to real estate and non-banking financial companies (NBFCs) remained high at 46.7 per cent (43.9 per cent in July 2008) and 31.4 per cent (53.9 per cent in July 2008).
Priority Sector Advances
4.22
The outstanding priority sector advances of public sector banks increased by 18.0 per cent during 2008-09 as compared to 17.1 per cent during 2007-08 and formed 42.5 per cent of Adjusted Net Bank Credit (ANBC)6. Similarly, in the case of private sector banks, the priority sector advances increased by 15.9 per cent during 2008-09 as compared to 13.5 per cent during the last year and formed 46.8 per cent of ANBC (Table IV.6). It is noteworthy that this increase in priority sector lending at an accelerated pace has come against the backdrop of general slowdown in the economy and a decelerating in total bank credit (Appendix Tables IV.4 to IV.7).
4.23
In contrast to the trend witnessed in the case of public sector banks and private sector banks, growth rate of lending to the priority sector by foreign banks decelerated to 10.4 per cent as at end-March 2009, as compared to 32.8 per cent last year. Even in terms of percentage to ANBC/CEOBSE, their disbursements constituted 34.3 per cent, down from 39.5 per cent last year (Table IV.7 and Appendix Table IV.8).
Table IV.6: Priority Sector Lending by Public and Private Sector Banks
(As on the last reporting Friday of March) |
(Amount in Rs. crore) |
Item |
Public Sector Banks |
Private Sector Banks |
1 |
2008 |
2009P |
2008 |
2009P |
| |
2 |
3 |
4 |
5 |
Priority Sector Advances# |
6,10,450 |
7,20,083 |
1,64,068 |
1,90,207 |
| |
(44.7) |
(42.5) |
(42.5) |
(46.8) |
of which: |
|
|
|
|
Agriculture^ |
2,49,397 |
2,98,211 |
58,566 |
76,062 |
| |
(18.3) |
(17.2) |
(17.1) |
(15.9) |
Micro and Small Enterprises |
1,51,137 |
1,91,307 |
46,912 |
47,916 |
| |
(11.1) |
(11.3) |
(13.7) |
(12.0) |
P : Provisional.
# : In terms of revised guidelines on lending to priority sector, broad categories include agriculture, small enterprises sector, retail trade, microcredit, education and housing.
^ : Indirect agriculture is reckoned up to 4.5 per cent of ANBC for
calculation of percentage.
Note: Figures in parentheses represent percentages to net bank credit/ adjusted net bank credit (ANBC)/ credit equivalent amount of off-balance sheet exposures (CEOBSE) whichever is higher. |
Table IV.7: Priority Sector Lending by Foreign Banks
(As on the last reporting Friday of March) |
(Amount in Rs. crore) |
Sector
|
2007 |
2008 |
2009P |
Amount |
Percentage to ANBC/ CEOBSE |
Amount |
Percentage to ANBC/ CEOBSE |
Amount |
Percentage to ANBC/ CEOBSE |
1 |
2 |
3 |
4 |
5 |
6 |
7 |
Priority Sector Advances # |
37,831 |
33.4 |
50,254 |
39.5 |
55,483 |
34.3 |
of which: |
|
|
|
|
|
|
Export credit |
20,711 |
18.3 |
28,954 |
22.7 |
31,511 |
19.4 |
Micro and Small Enterprises* |
11,637 |
10.3 |
15,489 |
12.2 |
18,138 |
11.2 |
P : Provisional.
# : In terms of revised guidelines on lending to priority sector, broad categories include agriculture, small enterprises sector, retail
trade, micro credit, education and housing.
* : The new guidelines on priority sector advances take into account the revised definition of small and micro enterprises as per the
Micro, Small and Medium Enterprises Development Act, 2006. |
Special Agricultural Credit Plans (SACP)7
4.24
During the year 2008-09, the public sector banks moved closer to their target under SACP as compared to the last year. The private sector banks continued to overshoot their target during 2008-09, though the growth rate of disbursements witnessed a deceleration (Table IV.8).
4.25
Public sector banks were advised to earmark 5 per cent of their ANBC to women. At the end of March 2009, the aggregate credit to women by public sector banks stood at 6.3 per cent of their net bank credit with 25 banks reaching the target. Eight public sector banks have opened 23 specialised women branches.
Table IV.8: Targets and Disbursements under Special Agricultural Credit Plans |
(Amount in Rs. crore) |
Bank Group |
2007-08 |
2008-09 P |
Target |
Disbursement |
Target |
Disbursement |
1 |
2 |
3 |
4 |
5 |
Public Sector Banks |
1,52,133 |
1,33,226 |
1,59,470 |
1,65,198 |
| |
|
(87.6) |
|
(103.6) |
Private Sector Banks |
41,427 |
47,862 |
57,353 |
63,753 |
| |
|
(115.3) |
|
(111.2) |
Note: Figures in parentheses indicate the achievement of target (per cent). |
Credit to Industry
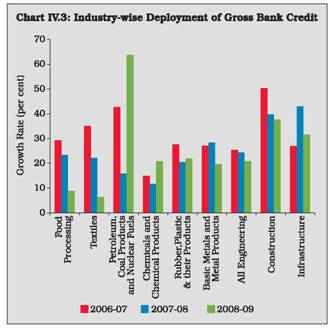
4.26 As at end-March 2009, growth rate of credit to industry (small, medium and large) decelerated for the second consecutive year to 21.6 per cent from 24.3 per cent as at end-March 2008 and 27.0 per cent as at end-March 2007. In line with last year, the industrial credit growth rate was higher than the overall credit growth rate. Therefore, the share of outstanding credit to industry in non-food gross bank credit increased to 40.5 per cent at end-March 2009 from 39.4 per cent at end-March 2008. Infrastructure, which has the largest share in credit outstanding, also accounted for the largest share of incremental bank credit to industry in absolute terms, followed by basic metals and metal products, and textiles. In terms of growth rates, credit to petroleum, coal products and nuclear fuels registered the sharpest rise in growth rate (63.8 per cent), followed by construction (37.8 per cent) and infrastructure (31.6 per cent) (Chart IV.3 and Appendix Table IV.9). It is noteworthy that notwithstanding the slowdown, credit to select sectors especially petroleum and coal products registered a sharp rise.
Credit to Micro and Small Enterprises (MSE) Sector
4.27 The total credit provided by public sector banks to MSE sector as on the last reporting Friday of March 2009 was Rs.1,91,307 crore which formed 11.3 per cent of ANBC/CEOBSE and 26.5 per cent of the total priority sector advances of these banks. Advances to manufacturing enterprises and service enterprises by public sector banks amounted to Rs.1,31,177 crore and Rs.54,449 crore respectively, constituting 68.6 per cent and 28.5 per cent respectively of the total advances to MSE sector. The total credit provided by private sector banks to MSE sector as on the last reporting Friday of March 2009 was Rs.47,916 crore, which formed 11.8 per cent of ANBC/ CEOBSE and 25.2 per cent of the total priority sector advances of these banks. Advances to manufacturing enterprises and service enterprises by private sector banks amounted to Rs.17,625 crore and Rs.26,363 crore, respectively, constituting 36.8 per cent and 55.0 per cent respectively of the total advances to MSE sector. The total credit to MSE sector by SCBs as on the last reporting Friday of March 2009 was Rs. 2,57,361 crore which formed 11.4 per cent of ANBC/CEOBSE and 26.7 per cent of the total priority sector advances.
 4.28 The total credit provided by foreign banks
to MSE sector as on the last reporting Friday of
March 2009 was Rs.18,138 crore, which formed
11.2 per cent of ANBC/CEOBSE, and 32.7 per cent
of total priority sector advances of these banks.
Credit to Khadi and Village Industries Commission
4.29 A consortium of select public sector
banks was formed with the State Bank of India
as the leader to provide credit to the Khadi and
Village Industries Commission (KVIC). These
loans are provided at 1.5 per cent below the
average prime lending rates of five major banks
in the consortium. At the end of August 31,
2009, an amount of Rs.300 crore was
outstanding out of Rs.738 crore disbursed by
the consortium of banks under the scheme.
Retail Credit
4.30 The retail credit growth rate, which was
higher than 40.0 per cent in 2004-05 and 2005-
06 has witnessed a deceleration since then.
Continuing this trend, the growth rate in retail
credit by banks decelerated further to 4.0 per
cent as at end March 2009 from 17.1 per cent
last year and 29.9 per cent as at end March
2007. It also remained lower than the growth
in loans and advances of SCBs (21.2 per cent).
As a result, the share of retail credit in total
loans and advances declined to 21.3 per cent at
end-March 2009 from 24.5 per cent at end-
March 2008. Deceleration in the growth of retail
portfolio of banks was mainly on account slow down in credit for housing loans, auto loans, credit card receivables and other personal loans, though loans to consumer durables witnessed a turnaround (Table IV.9).
Table IV.9: Retail Portfolio of Banks |
(Amount in Rs. crore) |
Item
|
Outstanding as at end-March |
Percentage variation |
2008 |
2009 |
2007-08 |
2008-09 |
1 |
2 |
3 |
4 |
5 |
1. |
Housing Loans |
2,52,932 |
2,63,235 |
12.7 |
4.1 |
2. |
Consumer Durables |
4,802 |
5,431 |
-34.2 |
13.1 |
3. |
Credit Card Receivables |
27,437 |
29,941 |
49.8 |
9.1 |
4. |
Auto Loans |
87,998 |
83,915 |
6.6 |
-4.6 |
5. |
Other Personal Loans |
1,97,607 |
2,11,294 |
27.5 |
6.9 |
Total Retail Loans (1 to 5) |
5,70,776 |
5,93,815 |
17.1 |
4.0 |
| |
(24.5) |
(21.3) |
|
|
Total Loans and Advances of SCBs |
23,32,032 |
27,93,572 |
23.2 |
19.8 |
Note: Figures in parentheses represent percentage share in total loans and advances. Source: Off-site Returns (domestic, unaudited and provisional). |
Lending to Sensitive Sectors
4.31
On a y-o-y basis SCBs’ lending to sensitive sectors (capital market, real estate and commodities) showed a marginal increase as at end March 2009. However, the SCBs exposure to capital market reduced substantially during 2008-09 mainly reflecting the subdued conditions in the capital market and perception of high risk in the market. While credit to commodities declined, that to real estate market continued to increase notwithstanding the subdued real estate market (Table IV.10). This partly reflected the normalisation of risk weight to claims sought by commercial real estate to 100 per cent as also the extension of the special regulatory treatment to housing loans and commercial real estate loans under the restructuring of advances scheme. Overall exposure of SCBs to sensitive sectors as percentage of aggregate bank loans declined to 19.3 per cent from 21.0 per cent last year (Appendix Table IV.11).
4.32
Among all the bank groups, the foreign banks had the largest exposure to sensitive sectors as at end-March 2009, mainly on account of higher lending to the real estate sector. The share of sensitive sector lending in total loans and advances in case of public sector banks and new private sector banks, however, declined (Table IV.11 and Appendix Table IV.11).
Table IV.10: Lending to the Sensitive Sectors by
Scheduled Commercial Banks (As at end-March) |
(Amount in Rs. crore) |
Sector
|
2008 |
2009 |
Amount |
Per cent to Total |
Amount |
Per cent to Total |
1 |
2 |
3 |
4 |
5 |
1. |
Capital Market |
61,638 |
11.9 |
55,282 |
9.5 |
| |
|
(75.6) |
|
(-10.3) |
|
2. |
Real Estate Market |
4,56,858 |
87.8 |
5,24,227 |
90.3 |
| |
|
(22.5) |
|
(14.8) |
|
3. |
Commodities |
1,643 |
0.3 |
897 |
0.2 |
| |
|
(90.6) |
|
(-45.4) |
|
Total (1+2+3) |
5,20,140 |
100.0 |
5,80,407 |
100.0 |
| |
|
(27.2) |
|
(11.6) |
|
- : negligible.
Note: Figures in parentheses are percentage variations over the
previous year.
Source: Balance sheets of respective banks. |
Investments
4.33 Growth rate of investments by banks decelerated to 23.1 per cent as at end March 2009. However SLR securities as percentage of NDTL increased during the year due to banks preference to park their funds in low risk and low return instruments against the backdrop of prevailing uncertainties (Table IV.12).
Table IV.11: Lending to the Sensitive Sectors - Bank Group-wise*
(As at end-March) |
(Per cent) |
Sector/Bank Group |
Public Sector Banks |
New Private Sector Banks |
Old Private Sector Banks |
Foreign Banks |
| |
2008 |
2009 |
2008 |
2009 |
2008 |
2009 |
2008 |
2009 |
1 |
2 |
3 |
4 |
5 |
6 |
7 |
8 |
9 |
Capital Market# |
1.7 |
1.5 |
5.6 |
3.1 |
2.3 |
1.8 |
3.3 |
3.6 |
Real Estate @ |
15.8 |
14.8 |
28.9 |
27.6 |
16.7 |
17.3 |
23.2 |
26.8 |
Commodities |
0.0 |
0.0 |
0.0 |
0.0 |
0.7 |
0.7 |
0.1 |
0.0 |
Total Advances to Sensitive Sectors |
17.5 |
16.3 |
34.5 |
30.7 |
19.7 |
19.8 |
26.6 |
30.5 |
* : Advances to the sensitive sector as percentage to total loans and advances of the concerned bank group.
# : Exposure to the capital market is inclusive of both investments and advances.
@ : Exposure to real estate sector is inclusive of both direct and indirect lending. |
4.34 Although the banking sector held excess SLR investment at Rs.1,69,846 crore (above the prescribed minimum requirement of 24.0 per cent) at end-March 2009, several banks were operating their statutory liquidity ratio portfolio very close to the prescribed minimum level. Excess SLR investments of SCBs increased to Rs.2,88,754 crore on September 25, 2009. As a result, SLR investments in relation to NDTL increased to 30.4 per cent. The LAF adjusted SLR holding was Rs.1,82,639 crore which was 28.0 per cent of NDTL (Chart IV.4).
Table IV.12: Growth in Investment and Deposits of SCBs |
(per cent) |
Year |
SLR Investment |
SLR Investment as per cent of NDTL (end-March) |
Total Investment |
Deposits |
Loans
and advances |
1 |
2 |
3 |
4 |
5 |
6 |
2005-06 |
-2.9 |
31.3 |
-0.4 |
17.8 |
31.8 |
2006-07 |
10.3 |
27.9 |
9.7 |
24.6 |
30.6 |
2007-08 |
22.8 |
27.8 |
23.8 |
23.1 |
25.0 |
2008-09 |
20.0 |
28.1 |
23.1 |
22.4 |
21.2 |
Source: Section 42(2) returns submitted by SCBs for column no. 2 and 3; balance sheets of respective banks for column no. 4-6. |
Non-SLR investments
4.35 Growth of banks’ investments in non-SLR securities (i.e., bonds/debentures/ shares and commercial papers) decelerated to 10.5 per cent during 2008-09 as compared with an increase of 14.3 per cent during the previous year (Table IV.13). The total flow of funds from SCBs to the commercial sector comprising credit and non-SLR investments, increased by 17.5 per cent (Rs.4,21,091 crore) in 2008-09 as compared with 22.6 per cent (Rs.4,44,807 crore) in the previous year.
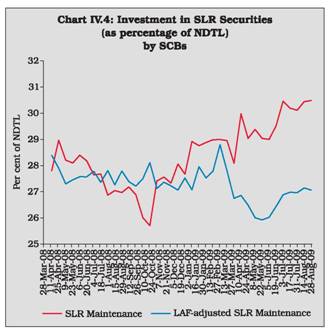
Table IV.13: Non-SLR Investments of Scheduled Commercial Banks |
(Amount in Rs. crore) |
Instrument |
As on
March 28,
2008 |
Per cent
to
Total |
As on
March 27,
2009 |
Per cent
to Total |
As on
Sept. 12,
2008 |
Per cent
to Total |
As on
Sept. 11,
2009 |
Per cent
to Total |
1 |
2 |
3 |
4 |
5 |
6 |
7 |
8 |
9 |
1. |
Commercial Paper |
13,270 |
11.5 |
20,001 |
13.9 |
12,538 |
10.8 |
12,875 |
5.1 |
2. |
Investment in shares |
26,414 |
22.9 |
27,829 |
19.4 |
27,716 |
23.9 |
27,105 |
10.7 |
| |
of which: |
|
|
|
|
|
|
|
|
| |
a) |
Public sector undertakings |
3,025 |
2.6 |
2,769 |
1.9 |
3,497 |
3.0 |
2,345 |
0.9 |
| |
b) |
Private corporate sector |
23,389 |
20.3 |
25,060 |
17.5 |
24,219 |
20.9 |
24,761 |
9.7 |
3. |
Investments in bonds/debentures |
56,635 |
49.2 |
58,587 |
40.8 |
53,437 |
46.2 |
57,545 |
22.6 |
| |
of which: |
|
|
|
|
|
|
|
|
| |
a) |
Public sector undertakings |
27,935 |
24.3 |
25,456 |
17.7 |
25,548 |
22.1 |
22,312 |
8.8 |
| |
b) |
Private corporate sector |
28,700 |
24.9 |
33,131 |
23.1 |
27,889 |
24.1 |
35,233 |
13.8 |
4. |
Units of MFs |
18,824 |
16.3 |
37,035 |
25.8 |
22,042 |
19.0 |
1,56,963 |
61.7 |
Total Non-SLR Investment (1+2+3+4) |
1,15,143 |
100.0 |
1,43,452 |
100.0 |
1,15,733 |
100.0 |
2,54,488 |
100.0 |
Source: Section 42(2) returns submitted by SCBs. |
4.36 The composition of non-SLR investments
of banks has undergone a change in recent
years, notably since 2004-05. The share of
banks’ investment in shares, commercial papers
and units of mutual funds has witnessed a
growth, while the share of investment in bonds/
debentures has been declining, partly reflecting
the changing risk appetite of the commercial
banks in India. This trend also continued in
2008-09, except for banks’ investment in
shares, mainly due to the subdued conditions
in the Indian stock markets (Table IV.14).
International Assets of Banks
4.37 The growth rate of international assets of
SCBs in India decelerated to 3.0 per cent as at end-March 2009, from 9.7 per cent last year. In a reversal of trend, the ‘Nostro balances’ which had registered a sharp decline last year, revived this year. While holdings of debt securities continued to decline, the foreign currency loans to residents also declined in contrast to the sharp rise witnessed last year (Table IV.15).
Table IV.14: Composition of Non-SLR Investments |
(Per cent) |
Instrument |
2002-03 |
2003-04 |
2004-05 |
2005-06 |
2006-07 |
2007-08 |
2008-09 |
As on Sept. 12,
2008 |
As on Sept. 11,
2009 |
1 |
2 |
3 |
4 |
5 |
6 |
7 |
8 |
9 |
10 |
Commercial Paper |
3.1 |
2.7 |
2.7 |
5.4 |
9.4 |
11.5 |
13.9 |
10.8 |
5.1 |
Bonds/Debentures |
84.2 |
81.5 |
79.2 |
68.9 |
59.0 |
49.2 |
40.8 |
46.2 |
22.6 |
Shares |
7.9 |
7.3 |
9.4 |
14.2 |
19.3 |
22.9 |
19.4 |
23.9 |
10.7 |
Units of Mutual Funds |
4.9 |
8.5 |
8.7 |
11.5 |
12.3 |
16.3 |
25.8 |
19.0 |
61.7 |
Source: Section 42(2) returns submitted by SCBs. |
4.38 The consolidated international claims of banks, based on immediate country risk, showed a higher growth of 32.6 per cent as at end March 2009 as compared to 13.5 per cent during last year. The share of short-term claims (with residual maturity less than one year) in the consolidated international claims declined as at end March 2009, with corresponding increase in long-term claims. Sector-wise disaggregation of consolidated international claims of banks indicated revival in the share of banks (45.5 per cent as compared with 36.8 per cent last year) and a corresponding decline in the share of non-bank private sector (Table IV.16).
Table IV.15: International Assets of Banks -By Type |
Asset
|
End-March |
2008 |
2009 |
1 |
2 |
3 |
International Assets (1+2+3) |
2,22,711 |
2,29,356 |
1. |
Loans and Deposits |
2,12,126 |
2,19,547 |
| |
|
(95.2) |
(95.7) |
| |
of which : |
|
|
| |
a) |
Loans to Non-Residents* |
8,565 |
8,341 |
| |
|
|
(3.8) |
(3.6) |
| |
b) |
Foreign Currency Loans to |
108,440 |
99,973 |
| |
|
Residents** |
(48.7) |
(43.6) |
| |
c) |
Outstanding Export Bills |
49,011 |
44,564 |
| |
|
drawn on Non-Residents by Residents |
(22.0) |
(19.4) |
| |
d) |
Nostro Balances@ |
45,752 |
66,496 |
| |
|
|
(20.5) |
(29.0) |
2. |
Holdings of Debt Securities |
334 |
76 |
| |
|
(0.1) |
(0.0) |
3. |
Other Assets @@ |
10,250 |
9,733 |
| |
|
(4.6) |
(4.2) |
* : Includes rupee loans and foreign currency (FC) loans out of
non-residents (NR) deposits.
** : Includes loans out of FCNR (B) deposits, PCFC's, FC lending
to and FC deposits with banks in India etc.
@ : Includes placements made abroad and balances in term
deposits with non-resident banks.
@@ : Capital supplied to and receivable profits from foreign
branches/subsidiaries of Indian banks and other unclassified
international assets.
Note: Figures in parentheses are percentages to total.
Source: Locational Banking Statistics. |
4.39 The country-wise consolidated international claims of banks, based on immediate country risk, showed a mixed trend. As at end March 2009, while the shares of claims on the US, the UK, Hong Kong and United Arab Emirates increased, that of Germany declined. The claims on the US, the UK, Singapore and Hong Kong collectively accounted for over 50 per cent of total international claims (Table IV.17).
Table IV.16: Classification of Consolidated International Claims of Banks -
By Maturity and Sector (As at end-March) |
(Amount in Rs. crore) |
Residual Maturity/Sector |
2008 |
2009 |
1 |
2 |
3 |
Total Consolidated International Claims |
1,69,481 |
2,24,665 |
a) |
Maturity-wise |
|
|
| |
1) |
Short-term (residual maturity |
1,17,279 |
1,40,289 |
| |
|
less than one year) |
(69.2) |
(62.4) |
| |
2) |
Long-term (residual maturity |
50,232 |
79,828 |
| |
|
of one year and above) |
(29.6) |
(35.5) |
| |
3) |
Unallocated |
1,970 |
4,548 |
| |
|
|
(1.2) |
(2.0) |
b) |
Sector-wise |
|
|
| |
1) |
Bank |
62,394 |
1,02,223 |
| |
|
|
(36.8) |
(45.5) |
| |
2) |
Non-Bank Public |
748 |
656 |
| |
|
|
(0.4) |
(0.3) |
| |
3) |
Non-Bank Private |
1,06,339 |
1,21,786 |
| |
|
|
(62.7) |
(54.2) |
Note: 1. Figures in brackets are percentages to total.
2. Unallocated residual maturity comprises maturity not
applicable (e.g., for equities) and maturity information
not available from reporting bank branches.
3. Bank sector includes official monetary institutions (e.g.,
IFC, ECB, etc.) and central banks
4. Prior to the quarter ended March 2005, non-bank public
sector comprised of companies/ institutions other than
banks in which shareholding of state/central governments
was at least 51 per cent, including State/Central
Government and its departments. From March 2005
quarter, 'Non-bank public' sector comprises only State/
Central Government and its departments and,
accordingly, all other entities excluding banks are
classified under 'Non-bank private’ sector.
Source: Based on Consolidated Banking Statistics (CBS) Statements - Immediate country risk basis. |
Quarterly Trends – Commercial Banking Survey8
4.40 A quarterly analysis of developments in scheduled commercial banks revealed several interesting features (Table IV.18, Appendix Table IV.12). On a y-o-y basis, mobilisation of deposits by banks was lower during the first two quarters of 2008-09, but the mobilisation picked up during the next two quarters and was higher than the earlier year. On the other hand, credit expansion exhibited a mixed pattern. On a y-o-y basis bank credit to commercial sector increased during the first two quarters of 2008-09 and reached a peak in October 2008. Sustained moderation in bank credit was witnessed in the subsequent quarters of 2008-09. This gave banks space to increase their investment in Government securities.
Table IV.17: Consolidated International Claims
of Banks on Countries other than India (As at end-March) |
(Amount in Rs. crore) |
Itmes |
2008 |
2009 |
1 |
2 |
3 |
Total Consolidated International Claims |
1,69,481 |
2,24,665 |
of which: |
|
|
a) |
United States of America |
35,374 |
55,734 |
| |
|
(20.9) |
(24.8) |
b) |
United Kingdom |
21,899 |
29,753 |
| |
|
(12.9) |
(13.2) |
c) |
Singapore |
11,918 |
15,762 |
| |
|
(7.0) |
(7.0) |
d) |
Germany |
10,607 |
9,869 |
| |
|
(6.3) |
(4.4) |
e) |
Hong Kong |
9,792 |
19,031 |
| |
|
(5.8) |
(8.5) |
f) |
United Arab Emirates |
7,990 |
11,309 |
| |
|
(4.7) |
(5.0) |
Note: Figures in the parentheses are percentage shares in total
international claims.
Source: Consolidated Banking Statistics - Immediate Country Risk Basis. |
Developments during 2009-10
4.41 During 2009-10 so far (up to September
25, 2009), the moderation in the flow of credit
from SCBs continued, reflecting the slowdown
in economic activity. This moderation was
particularly evident in the case of private and
foreign banks.
Credit-Deposit Ratio
4.42 The incremental credit-deposit (C-D)
ratio and investment-deposit (I-D) ratio of SCBs
mirrored the banks’ behaviour in respect of investments and credit. During the high credit growth phase (2002-03 to 2006-07) the two series drifted away from each other as C-D ratio rose sharply and as a consequence the I-D ratio declined, reflecting banks preference for lending over investment. In fact, banks liquidated some investments in 2005-06 leading to a sharp decline in incremental I-D ratio. Subsequently, however, as the cyclical factors lead to cooling off of the credit growth rate, the trend in incremental C-D ratio and I-D ratio reversed. During the post-September 2008 period, the incremental C-D ratio declined sharply reflecting the slowdown in credit growth. The slowdown in credit growth is reflective of companies deferring their investments against the backdrop of widespread uncertainty. As a consequence, the incremental I-D ratio rose, notwithstanding the softening of interest rates (Chart IV.5).
Table IV.18: Operations of Scheduled Commercial Banks |
(Amount in Rs. crore) |
Item |
Outsta
nding
as on
March
27, 2009 |
Variation |
2007-08 |
2008-09 |
2009-10 |
Q1 |
Q2 |
Q3 |
Q4 |
Q1 |
Q2 |
Q3 |
Q4 |
Q1 |
Q2 |
1 |
2 |
3 |
4 |
5 |
6 |
7 |
8 |
9 |
10 |
11 |
12 |
Components |
|
|
|
|
|
|
|
|
|
|
|
1. |
Aggregate Deposits of Residents (a+b) |
37,66,842 |
58,993 |
2,08,191 |
67,544 |
2,60,803 |
53,155 |
1,83,287 |
1,11,471 |
2,78,925 |
1,30,600 |
1,54,127 |
| |
a) |
Demand Deposits |
5,23,085 |
-41,898 |
57,771 |
-7,894 |
86,600 |
-77,630 |
52,219 |
-60,449 |
84,635 |
-32,922 |
61,410 |
| |
b) |
Time Deposits of Residents |
32,43,757 |
1,00,890 |
1,50,420 |
75,439 |
1,74,204 |
1,30,785 |
1,31,068 |
1,71,920 |
1,94,290 |
1,63,522 |
92,717 |
2. |
Call/Term Funding from Financial Institutions |
1,13,936 |
-2,984 |
5,756 |
7,441 |
10,455 |
-1,116 |
7,015 |
-685 |
2,217 |
-15,786 |
-3,561 |
Sources |
|
|
|
|
|
|
|
|
|
|
|
1. |
Credit to the Government |
11,55,786 |
50,067 |
68,965 |
27,436 |
36,136 |
33,245 |
-19,641 |
99,566 |
83,955 |
1,26,014 |
75,338 |
2. |
Credit to the Commercial Sector (a to d) |
29,95,361 |
-13,527 |
1,34,775 |
94,969 |
2,42,980 |
40,471 |
1,30,938 |
1,25,746 |
1,49,109 |
62,935 |
60,661 |
| |
a. |
Bank Credit |
27,75,549 |
-36,348 |
1,42,638 |
87,012 |
2,37,422 |
31,325 |
1,57,787 |
92,708 |
1,31,815 |
-7,563 |
1,05,169 |
| |
|
i. Food Credit |
46,211 |
-2,564 |
-6,948 |
3,259 |
4,131 |
5,748 |
-4,971 |
6,934 |
-5,899 |
14,450 |
-18,244 |
| |
|
ii. Non-food Credit |
27,29,338 |
-33,784 |
1,49,586 |
83,752 |
2,33,291 |
25,577 |
1,62,758 |
85,774 |
1,37,714 |
-22,014 |
1,23,413 |
| |
b. |
Net Credit to Primary Dealers |
1,671 |
-282 |
780 |
1,370 |
-1,146 |
-797 |
-1,174 |
1,520 |
-1,400 |
-508 |
3,753 |
| |
c. |
Investments in Other Approved Securities |
10,624 |
-384 |
-1,010 |
-654 |
-357 |
-194 |
-567 |
-1,360 |
-309 |
-96 |
6,221 |
| |
d. |
Other Investments (in non-SLR Securities) |
2,07,517 |
23,487 |
-7,634 |
7,241 |
7,061 |
10,136 |
-25,109 |
32,877 |
19,003 |
71,967 |
-54,482 |
3. |
Net Foreign Currency Assets |
|
|
|
|
|
|
|
|
|
|
|
| |
Of commercial Banks (a-b-c) |
-53,359 |
2,817 |
-16,584 |
974 |
-16,793 |
-19,924 |
-5,564 |
33,708 |
8,618 |
27,733 |
-26,244 |
| |
a. |
Foreign Currency Assets |
55,312 |
-8,312 |
-9,934 |
-781 |
-8,537 |
-8,383 |
2,934 |
24,151 |
5,421 |
18,428 |
-29,440 |
| |
b. |
Non-resident Foreign Currency |
|
|
|
|
|
|
|
|
|
|
|
| |
|
Repatriable Fixed Deposits |
67,268 |
-4,202 |
-1,181 |
-3,490 |
-1,653 |
2,048 |
3,898 |
-2,323 |
6,710 |
755 |
416 |
| |
c. |
Overseas Foreign Currency Borrowings |
41,404 |
-6,928 |
7,830 |
1,734 |
9,909 |
9,494 |
4,600 |
-7,234 |
-9,907 |
-10,060 |
-3,611 |
4. |
Net Bank Reserves |
2,46,748 |
6,468 |
76,009 |
-22,695 |
21,268 |
28,526 |
35,997 |
-1,16,193 |
27,252 |
-17,189 |
20,787 |
5. |
Capital Account |
3,32,444 |
26,813 |
24,184 |
6,887 |
11,937 |
47,618 |
4,932 |
3,043 |
4,230 |
41,256 |
2,584 |
Note: 1. Data are provisional.
2. Data relate to last reporting Friday of each quarter. |
4.43 The C-D ratio and I-D ratio, based on the outstanding amount, have remained more or less stable for the last three years. Thus the C-D ratio, which was 74.6 per cent as at end March 2008 declined marginally to 73.9 per cent as at end March 2009, while the I-D ratio increased marginally from 35.5 per cent to 35.7 per cent in the same period.
4.44
Among bank-groups, the C-D ratio (in terms of outstanding amount) of new private sector banks was the highest at end-March 2009, followed by foreign banks and public sector banks (Chart IV.6). Old private sector banks continued to have the lowest C-D ratio.
4.45
The C-D ratio of public sector banks, barring IDBI Bank Ltd., remained range bound, in line with the pattern witnessed last year. This range was between 64.9 per cent (United Bank of India) and 77.8 per cent (State Bank of Travancore and State Bank of Mysore). The C-D ratio of IDBI Bank Ltd., however, was much higher at 92.0 per cent. In the case of old private sector banks, the C-D ratio ranged between 51.2 per cent (Bank of Rajasthan) and 71.3 per cent (Lakshmi Vilas Bank). The C-D ratio of new private sector banks ranged between 69.2 per cent (HDFC Bank) and 106.3 per cent (Kotak Mahindra Bank). In the case of top five foreign banks, the C-D ratio ranged between 55.2 per cent (Hongkong and Shanghai Banking Corporation) to 104.4 (ABN Amro Bank). Of the 30 foreign banks, the C-D ratio of as many as 9 banks was over 100 per cent. This suggests that the foreign banks have been much more aggressive in their lending, followed by the new private sector banks, while the public sector banks have been maintaining a mediocre path (Appendix Table IV.13).

 Maturity Profile of Assets and Liabilities of Banks
4.46 The broad pattern of the maturity structure of private sector banks suggests a shift from short term maturity (up to one year maturity) to medium term maturity (1-3 years and 3-5 years). This is indicative of the hardening of term interest rates in the first half of 2008-09 and augurs well from the point of view of financing long term projects. This pattern is also evident in case of borrowings where preference has shifted from the short term maturity to long- term maturity bucket for private sector and foreign banks. In contrast the investment pattern suggests a shift from medium term (1-3 years) to up to 1 year maturity buckets for public sector, old private sector and foreign banks, suggesting banks’ perception that the interest rates may harden in the near future. As at end-March 2009, the foreign banks had majority share of their deposits, borrowings, loans and advances as well as investments, in short term maturity buckets. In contrast however, the public sector banks had short term deposits, borrowings and loans and advances but long term investments (Table IV.19).
3. Off-Balance Sheet Operations
4.47
The off-balance sheet operations of the SCBs, which include forward exchange contracts, guarantees, acceptances, endorsements etc., had increased manifold in the recent years. The year 2008-09 however, marked an exception to this trend with the SCBs reducing their OBS exposures by 26.4 per cent as compared to last year (Chart IV.7). This partly reflected the strengthening of prudential regulations effected by the Reserve Bank on OBS exposures.
Table IV.19: Bank Group-wise Maturity Profile of Select Liabilities /Assets
(As at end-March) |
(Per cent to Total) |
Assets/Liabilities
|
Public Sector Banks |
Old Private Sector Banks |
New Private Sector Banks |
Foreign Banks |
2008 |
2009 |
2008 |
2009 |
2008 |
2009 |
2008 |
2009 |
1 |
2 |
3 |
4 |
5 |
6 |
7 |
8 |
9 |
I. |
Deposits |
|
|
|
|
|
|
|
|
| |
a) |
Up to 1 year |
44.1 |
45.7 |
50.9 |
48.3 |
57.1 |
53.1 |
64.7 |
63.8 |
| |
b) |
Over 1 year and up to 3 years |
26.5 |
27.3 |
35.5 |
38.4 |
34.3 |
35.6 |
33.3 |
23.1 |
| |
c) |
Over 3 years and up to 5 years |
10.3 |
8.4 |
7.7 |
8.4 |
2.5 |
3.7 |
0.4 |
9.6 |
| |
d) |
Over 5 years |
19.1 |
18.7 |
6.0 |
4.9 |
6.0 |
7.6 |
1.6 |
3.5 |
II. |
Borrowings |
|
|
|
|
|
|
|
|
| |
a) |
Up to 1 year |
69.6 |
70.8 |
79.1 |
76.7 |
49.2 |
44.3 |
90.9 |
84.8 |
| |
b) |
Over 1 year and up to 3 years |
16.5 |
23.9 |
5.4 |
7.8 |
25.4 |
30.8 |
8.4 |
13.9 |
| |
c) |
Over 3 years and up to 5 years |
6.0 |
3.6 |
3.0 |
5.7 |
21.9 |
19.3 |
0.3 |
1.3 |
| |
d) |
Over 5 years |
7.9 |
1.7 |
12.5 |
9.8 |
3.5 |
5.5 |
0.3 |
0.0 |
III. |
Loans and Advances |
|
|
|
|
|
|
|
|
| |
a) |
Up to 1 year |
38.0 |
39.1 |
40.4 |
40.8 |
33.6 |
32.4 |
49.6 |
55.8 |
| |
b) |
Over 1 year and up to 3 years |
33.3 |
33.5 |
36.1 |
35.5 |
34.2 |
35.5 |
34.4 |
24.1 |
| |
c) |
Over 3 years and up to 5 years |
11.2 |
9.9 |
11.5 |
12.3 |
12.2 |
14.0 |
6.6 |
10.1 |
| |
d) |
Over 5 years |
17.6 |
17.5 |
12.0 |
11.4 |
19.9 |
18.1 |
9.4 |
10.0 |
IV. |
Investments |
|
|
|
|
|
|
|
|
| |
a) |
Up to 1 year |
19.0 |
22.8 |
21.3 |
37.2 |
55.8 |
46.3 |
62.2 |
69.0 |
| |
b) |
Over 1 year and up to 3 years |
19.0 |
14.9 |
16.5 |
7.1 |
21.1 |
25.0 |
25.9 |
18.8 |
| |
c) |
Over 3 years and up to 5 years |
13.8 |
15.5 |
12.2 |
11.1 |
5.4 |
5.5 |
4.1 |
6.0 |
| |
d) |
Over 5 years |
48.2 |
46.8 |
50.0 |
44.7 |
17.6 |
23.2 |
7.8 |
6.2 |
4.48 The decline in OBS was especially evident in the case of foreign banks, whose contingent liabilities continue to be highest both in absolute terms as well as in terms of
percentage to total liabilities. Apart from the foreign banks, the State Bank Group and the new private sector banks also witnessed a decline in their OBS (Appendix Table IV.14).
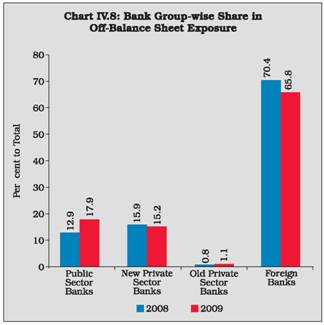
4.49 The foreign banks continued to have largest share of off-balance sheet exposures of the SCBs (65.8 per cent), followed by public sector banks (share of 17.9 per cent) and new private sector banks (15.2 per cent) (Chart IV.8).
4. Financial Performance of Scheduled Commercial Banks
4.50 The balance sheets of SCBs in India
remained robust against the backdrop of global
financial crisis and its effects on India economy
through various transmission channels. However,
the Indian banking sector was not completely
insulated from the effects of the slowdown of
the Indian economy as evident from the financial
performance of SCBs. The growth rates of
income as well as the expenditure of SCBs
decelerated, leading to deceleration in growth
of net profits. This deceleration in growth of profit
was due to the rising cost of deposits and
borrowing but declining return on investments.
The efficiency parameters like RoA and RoE,
however, increased during the year. In a nutshell,
as highlighted by the Report on Financial Sector
Assessment (2009), ‘The Indian economy has
withstood the shocks of the global meltdown well
and none of the key financial parameters point
to any discernable vulnerability’.
Interest Rate Scenario
4.51 Deposit and lending rates of SCBs across
various bank groups showed a generally
upward movement during the first half of the year
2008-09. Taking a cue from the Reserve Bank
monetary policy announcements, the SCBs
reduced their deposit and lending rates in the
second half of 2008-09. In the first half of
2009-10, (upto September 11, 2009), the
deposit and lending rates of SCBs have declined
further (Table IV.20 and Chart IV.9).
Cost of Deposits and Return on Advances
4.52 Notwithstanding the softening of the
deposit rates, especially in the second half of
2008-09, the cost of deposits, cost of borrowings
and cost of funds of SCBs increased as
compared with that during the previous year.
At the same time the return on investment
decreased. This was mainly on account of
several structural rigidities in the interest rates as spelt out in the Annual Monetary Policy Document, 2009-10. These trends in cost and return affected the spread of banks adversely. This trend was evident in case of almost all the bank groups (Table IV.21).
Table IV.20: Movements in Deposit and Lending Interest Rates |
(Per cent) |
Interest Rates |
March 2007 |
March 2008 |
October 2008 |
March 2009 |
June 2009 |
Sept. 2009** |
1 |
2 |
3 |
4 |
5 |
6 |
7 |
Term Deposit Rates
|
|
|
|
|
|
|
Public Sector Banks |
|
|
|
|
|
|
a) |
Up to 1 year |
2.75-8.75 |
2.75-8.50 |
2.75-10.25 |
2.75-8.25 |
1.00-7.00 |
1.00-6.75 |
b) |
1 year up to 3 years |
7.25-9.50 |
8.25-9.25 |
9.50-10.75 |
8.00-9.25 |
6.50-8.00 |
6.50-7.50 |
c) |
Over 3 years |
7.50-9.50 |
8.00-9.00 |
8.50-9.75 |
7.50-9.00 |
6.75-8.50 |
6.50-8.00 |
Private Sector Banks |
|
|
|
|
|
|
a) |
Up to 1 year |
3.00-9.00 |
2.50-9.25 |
3.00-10.50 |
3.00-8.75 |
2.00-7.50 |
2.00-7.00 |
b) |
1 year up to 3 years |
6.75-9.75 |
7.25-9.25 |
9.00-11.00 |
7.50-10.25 |
6.00-8.75 |
5.25-8.00 |
c) |
Over 3 years |
7.75-9.60 |
7.25-9.75 |
8.25-11.00 |
7.50-9.75 |
6.00-9.00 |
5.75-8.25 |
Foreign Banks |
|
|
|
|
|
|
a) |
Up to 1 year |
3.00-9.50 |
2.25-9.25 |
3.50-10.75 |
2.50-8.50 |
1.80-8.00 |
1.25-8.00 |
b) |
1 year up to 3 years |
3.50-9.50 |
3.50-9.75 |
3.50-11.25 |
2.50-9.50 |
2.25-8.50 |
2.25-8.50 |
c) |
Over 3 years |
4.05-9.50 |
3.60-9.50 |
3.60-11.00 |
2.50-10.00 |
2.25-9.50 |
2.25-8.50 |
BPLR |
|
|
|
|
|
|
Public Sector Banks |
12.25-12.75 |
12.25-13.50 |
13.75-14.75 |
11.50-14.00 |
11.00-13.50 |
11.00-13.50 |
Private Sector Banks |
12.00-16.50 |
13.00-16.50 |
13.75-17.75 |
12.75-16.75 |
12.50-16.75 |
12.50-16.70 |
Foreign Banks |
10.00-15.50 |
10.00-15.50 |
10.00-17.00 |
10.00-17.00 |
10.50-16.00 |
10.50-16.00 |
Actual Lending Rates* |
|
|
|
|
|
|
Public Sector Banks |
4.00-17.00 |
4.00-17.75 |
- |
3.50-18.00 |
3.50-17.50 |
- |
Private Sector Banks |
3.15-25.50 |
4.00-24.00 |
- |
4.75-26.00 |
4.10-26.00 |
- |
Foreign Banks |
5.00-26.50 |
5.00-28.00 |
- |
5.00-25.50 |
2.76-25.50 |
- |
– : Not Available.
* : Interest rate on non-export demand and term loans above Rs.2 lakh excluding lending rates at the extreme five per cent on both
sides.
** : As on September 11, 2009
Source: Special Fortnightly (VI-B, VI-AB) / Quarterly (VI-AC) Returns received from banks. |
 Income
4.53 Growth of income of SCBs during 2008-09 decelerated to 25.7 per cent from 34.3 per cent in the previous year, but was higher than the growth rate of 24.4 per cent in 2006-07. The income to assets ratio improved marginally to 8.8 per cent from 8.5 per cent last year. Reflecting the lower lending rates, growth of interest income of SCBs as at end March 2009 decelerated to 26.0 per cent as compared with 33.2 per cent in the previous year (Table IV.22).
Table IV.21: Cost of Funds and Returns on Funds - Bank Group-wise |
(Per cent) |
Indicator |
Public Sector Banks |
Old Private Sector Banks |
New Private Sector Banks |
Foreign Banks |
Scheduled Commercial Banks |
| |
2007-08 |
2008-09 |
2007-08 |
2008-09 |
2007-08 |
2008-09 |
2007-08 |
2008-09 |
2007-08 |
2008-09 |
1 |
2 |
3 |
4 |
5 |
6 |
7 |
8 |
9 |
10 |
11 |
1. |
Cost of Deposits |
5.4 |
5.6 |
5.7 |
6.2 |
5.9 |
6.4 |
3.8 |
4.3 |
5.4 |
5.7 |
2. |
Cost of Borrowings |
3.5 |
4.0 |
4.6 |
5.0 |
3.1 |
3.7 |
4.5 |
3.9 |
3.6 |
3.9 |
3. |
Cost of Funds |
5.3 |
5.5 |
5.7 |
6.1 |
5.5 |
6.0 |
3.9 |
4.2 |
5.3 |
5.5 |
4. |
Return on Advances |
8.6 |
9.1 |
9.6 |
11.0 |
10.0 |
10.8 |
9.8 |
12.4 |
8.9 |
9.6 |
5. |
Return on Investments |
6.6 |
6.2 |
6.3 |
5.7 |
6.4 |
6.9 |
7.1 |
6.7 |
6.6 |
6.4 |
6. |
Return on Funds |
8.0 |
8.2 |
8.5 |
9.1 |
8.7 |
9.5 |
8.7 |
9.9 |
8.2 |
8.5 |
7. |
Spread (6-3) |
2.7 |
2.7 |
2.8 |
3.0 |
3.2 |
3.5 |
4.8 |
5.7 |
2.9 |
3.0 |
Notes: 1. Cost of Deposits = Interest Paid on Deposits/Deposits.
2.Cost of Borrowings = Interest Paid on Borrowings/Borrowings.
3.Cost of Funds = (Interest Paid on Deposits + Interest Paid on Borrowings)/(Deposits + Borrowings).
4.Return on Advances = Interest Earned on Advances /Advances.
5.Return on Investments = Interest Earned on Investments /Investments.
6.Return on Funds = (Interest Earned on Advances + Interest Earned on Investments) / (Advances + Investments) |
4.54
The share of non-interest income in total income was gradually increasing during the period 2002-2004 but declined in the subsequent period i.e. 2005-07. For the last two years however this share is again witnessing a rise, with a corresponding decline in share of interest income (Chart IV.10).
4.55
The non-interest income witnessed acceleration at a higher pace as compared to the growth rate of both the interest income as well as total income during the period 2004-05
to 2007-08. In a reversal of this trend, the deceleration in growth of non-interest income during 2008-09 was much sharper than that of the other two series (Chart IV.11).
4.56
The growth rate of trading income decelerated to 40.2 per cent during 2008-09 but the growth rate of forex income accelerated to 44.1 per cent [Appendix Table IV.15].
4.57
Among bank-groups, income of foreign banks grew at the highest rate (29.2 per cent)
during 2008-09, followed closely by public sector banks (28.4 per cent). The interest income to total assets ratio of all the bank groups improved, while that of SBI group remained constant. The ‘other income’ component of SCBs witnessed a deceleration. This deceleration was witnessed across all bank groups, except SBI group [Appendix Table IV. 16, Appendix Table IV.17(A to G)].
Table IV.22: Important Financial Indicators of Scheduled Commercial Banks |
(Amount in Rs. crore) |
Item
|
2006-07 |
2007-08 |
2008-09 |
Amount |
Per cent to Assets |
Amount |
Per cent to Assets |
Amount |
Per cent to Assets |
1 |
2 |
3 |
4 |
5 |
6 |
7 |
1. |
Income |
2,74,716 |
7.9 |
3,68,873 |
8.5 |
4,63,837 |
8.8 |
| |
a) |
Interest Income |
2,31,675 |
6.7 |
3,08,482 |
7.1 |
3,88,816 |
7.4 |
| |
b) |
Other Income |
43,041 |
1.2 |
60,391 |
1.4 |
75,021 |
1.4 |
2. |
Expenditure |
2,43,514 |
7.0 |
3,26,147 |
7.5 |
4,11,066 |
7.8 |
| |
a) |
Interest Expended |
1,42,420 |
4.1 |
2,08,001 |
4.8 |
2,63,221 |
5.0 |
| |
b) |
Operating Expenses |
66,319 |
1.9 |
77,283 |
1.8 |
89,268 |
1.7 |
| |
|
of which : Wage Bill |
36,148 |
1.0 |
39,954 |
0.9 |
47,660 |
0.9 |
| |
c) |
Provision and Contingencies |
34,775 |
1.0 |
40,864 |
0.9 |
58,578 |
1.1 |
3. |
Operating Profit |
65,977 |
1.9 |
83,590 |
1.9 |
1,11,349 |
2.1 |
4. |
Net Profit |
31,203 |
0.9 |
42,726 |
1.0 |
52,771 |
1.0 |
5. |
Net Interest Income/Margin (1a-2a) |
89,255 |
2.6 |
1,00,481 |
2.3 |
1,25,596 |
2.4 |
Note: The number of scheduled commercial banks was 82 in 2005-06, 79 in 2006-07 and 80 in 2007-08. |

 Expenditure
4.58 Expenditure of SCBs decelerated to 26.0 per cent as at end March 2009 as compared with 33.9 per cent in the previous year. Among the major components of expenditure of SCBs, growth rate of interest expended decelerated sharply to 26.5 per cent as compared with 46.0 per cent growth in the previous year. Non-interest or operating expenses also decelerated while provisioning increased sharply (Table IV.23).
4.59
The ratio of interest expended as percentage of total assets, for SCBs has been rising since 2005-06. In line with this trend, the ratio increased in 2008-09 to 5.0 per cent from 4.8 per cent last year (Appendix Table IV.22). In a reversal of trend, the net interest income as percentage of total assets of SCBs, which was witnessing a declining trend during 2004-2008, increased to 2.4 per cent (Appendix Table IV.23). Similarly, provisions and contingencies as percentage of total assets ratio also increased in 2008-09 for the first time after declining during 2004-2008 (Appendix Table IV.24). The trend in case of operating expenses to total assets ratio however continued with the ratio falling to 1.7 per cent in 2008-09 from 1.8 per cent during the previous year (Appendix Table IV.25). As a result, banks’ burden (excess of non-interest expenditure over non-interest income) declined significantly to 0.3 per cent in 2008-09 from 0.4 per cent of total assets in 2007-08 and 0.7 per cent in 2006-07. The efficiency ratio (operating expenses as percentage of net interest income plus non-interest income) declined to 44.5 per cent as at end-March 2009 from 48.0 per cent as at end-March 2008 and 50.1 per cent in 2006-07, reflecting the rise in non-interest income and decline in operating expenses, which combined together outweighed the decline in net interest income (in relation to total assets).
Table IV.23: Variation in Income-Expenditure of Scheduled Commercial Banks |
(Amount in Rs. crore) |
Item
|
2007-08 |
2008-09 |
Amount |
Per cent |
Amount |
Per cent |
1 |
2 |
3 |
4 |
5 |
1. |
Income (a+b) |
94,157 |
34.3 |
94,964 |
25.7 |
| |
a) |
Interest Income |
76,807 |
33.2 |
80,334 |
26.0 |
| |
b) |
Other Income |
17,350 |
40.3 |
14,630 |
24.2 |
2. |
Expenses (a+b+c) |
82,634 |
33.9 |
84,918 |
26.0 |
| |
a) |
Interest Expenses |
65,581 |
46.0 |
55,219 |
26.5 |
| |
b) |
Other Expenses |
10,963 |
16.5 |
11,985 |
15.5 |
| |
c) |
Provisioning |
6,089 |
17.5 |
17,714 |
43.3 |
3. |
Operating Profit |
17,612 |
26.7 |
27,759 |
33.2 |
4. |
Net Profit |
11,523 |
36.9 |
10,046 |
23.5 |
Source: Balance Sheets of respective banks. |
4.60 Reflecting the slowdown in the economy in general, the share of wages in operating expenses for most of the bank groups remained almost stagnant during the year (Chart IV.12). The marginal rise in the share of wages of SCBs was mainly contributed by the new private sector banks and nationalised banks. The wage bill rose by around 18 per cent in case of both these bank groups. In terms of percentage to total assets, the wage bill of SCBs remained stagnant at 0.9 per cent in line with last year. In fact, the wage bill to total assets ratio remained constant in case of all the bank groups, except new private sector banks.

Net Interest Income
4.61 The net interest income i.e. the difference
between interest income and interest expenses
SCBs, showed a sharp increase in 2008-09
mainly reflecting the variations in interest rates
prevalent at different points of time during the
year. The net interest income to assets ratio of
almost all the bank groups, except State Bank
group, increased during the year (Appendix
Table IV.23).
Operating Profit
4.62 The operating profit of SCBs increased
sharply by 33.2 per cent as at end-March 2009,
mainly due to the sharp deceleration in growth
rate of interest expended component. Due to
this sharp rise, the operating profits to total
assets ratio during 2008-09 increased to 2.1 per
cent from 1.9 per cent. The bank group-wise
analysis reveals that the operating profits of
public sector banks increased sharply but that
of private sector banks and foreign banks
witnessed a slowdown. The operating profits to
assets ratio increased in case of all the bank
groups, except ‘other public sector banks’
(Appendix Table IV.16).
Provisions and Contingencies
4.63 Provisions and contingencies of SCBs
during 2008-09 grew at a much higher rate of
43.4 per cent as compared with 17.7 per cent
in the previous year. Provisions for NPAs
increased by 43.0 per cent, as compared to 28.4
per cent last year. Bank-group wise, provisions
and contingencies as percentage of total assets
declined for ‘other public sector bank’, but
increased for all other bank groups.
Net Profit
4.64 The growth in net profits of SCBs
decelerated to 23.5 per cent during 2008-09
from 36.9 per cent in the previous year. This
was mainly on account of sharp increase in the
provisions and contingencies (Table IV.24).
Table IV.24: Operating Profit and Net Profit - Bank Group-wise |
(Amount in Rs. crore) |
Bank Group
|
Operating Profit |
Net Profit |
2007-08 |
Percentage Variation |
2008-09 |
Percentage Variation |
2007-08 |
Percentage Variation |
2008-09 |
Percentage Variation |
1 |
2 |
3 |
4 |
5 |
6 |
7 |
8 |
9 |
Scheduled Commercial Banks |
83,590 |
26.7 |
1,11,349 |
33.2 |
42,726 |
36.9 |
52,771 |
23.5 |
Public Sector Banks |
50,307 |
17.9 |
66,972 |
33.1 |
26,592 |
32.0 |
34,394 |
29.3 |
Nationalised Banks |
31,563 |
15.0 |
42,184 |
33.6 |
16,856 |
30.2 |
21,639 |
28.4 |
State Bank Group |
17,444 |
22.1 |
23,410 |
34.2 |
9,006 |
37.0 |
11,896 |
32.1 |
Other Public Sector Bank |
1,299 |
43.3 |
1,378 |
6.0 |
729 |
15.7 |
859 |
17.7 |
Old Private Sector Banks |
3,604 |
19.3 |
4,799 |
33.2 |
1,978 |
76.3 |
2,409 |
21.8 |
New Private Sector Banks |
15,632 |
46.3 |
19,480 |
24.6 |
7,544 |
41.2 |
8,459 |
12.1 |
Foreign Banks |
14,047 |
46.0 |
20,098 |
43.1 |
6,612 |
44.2 |
7,510 |
13.6 |
Source: Balance sheets of respective banks. |
Return on Assets
4.65 Return on Assets (RoA) is an indicator
of efficiency with which banks deploy their
assets. During 2008-09, the net profits to assets
ratio of SCBs increased moderately to 1.02 per
cent from 0.99 per cent in 2007-08 (Chart IV.13).
In fact, the RoA increased of all the bank groups,
except the foreign banks.
Return on Equity
4.66 Return on Equity (RoE), is an indicator
of efficiency with which capital is used by banking institutions. The RoE of SCBs increased to 13.2 per cent during 2008-09 from 12.5 per cent in 2007-08. Bank group wise analysis indicates that the RoE of all the bank groups, except the foreign banks, increased during 2008-09.

5. Soundness Indicators
4.67 A sound and efficient banking system is sine qua non for maintaining financial stability. Therefore, considerable emphasis has been placed on strengthening the capital requirements in recent years. The Capital to Risk-weighted Assets Ratio (CRAR) of SCBs, a measure of the capacity of the banking system to absorb unexpected losses, improved further to 13.2 per cent at end-March 2009 from 13.0 per cent at end-March 2008. The asset quality of banks in India has been improving over the past few years as reflected in the declining NPA to advances ratio. It is especially noteworthy that notwithstanding the pressures of a slowdown in the economy and an atmosphere of uncertainty, the net NPA to net advances ratio increased only marginally to 1.1 per cent as at end March 2009 from 1.0 per cent as at end March 2008. Significantly, gross NPA to gross advances ratio remained constant at 2.3 per cent. Thus, in terms of the two crucial soundness indicators, viz., capital and asset quality, the Indian banking sector has exhibited resilience amidst testing times (Chart IV.14).
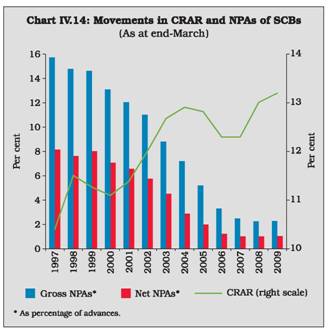 Asset Quality
4.68 The trend of improvement in the asset quality of banks continued during the year.
Indian banks recovered a higher amount of NPAs during 2008-09 than that during the previous year. Though the total amount recovered and written-off at Rs.38,828 in 2008-09 was higher than Rs.28,283 crore in 2007-08, it was lower than fresh addition of NPAs (Rs.52,382 crore) during the year. As a result, the gross NPAs of SCBs increased across all the bank groups (Table IV.25). In this context, it may be noted that in the present context of financial turmoil, some slippage in NPAs could be expected. Nevertheless, it may be noted that this slippage was moderate as compared to the problems faced by banks all over the world.
4.69 Among the various channels of recovery available to banks for dealing with bad loans, the SARFAESI Act and the Debt Recovery Tribunals (DRTs) have been the most effective in terms of amount recovered. The amount recovered as percentage of amount involved was the highest under the DRTs, followed by SARFAESI Act (Table IV.26).
Table IV.25: Movements in Non-performing Assets - Bank Group-wise |
(Amount in Rs. crore) |
Item |
Scheduled
Commercial
Banks |
Public Sector Banks |
Nationalised Banks |
State
Bank
Group |
Old Private Sector Banks |
New Private Sector Banks |
Foreign Banks |
1 |
2 |
3 |
4 |
5 |
6 |
7 |
8 |
Gross NPAs |
|
|
|
|
|
|
|
Closing balance for 2007-08 |
56,309 |
40,452 |
23,410 |
15,478 |
2,557 |
10,440 |
2,859 |
Opening balance for 2008-09 |
55,419 |
40,089 |
23,410 |
15,303 |
2,557 |
9,901 |
2,872 |
Addition during 2008-09 |
52,382 |
31,338 |
17,822 |
12,879 |
2,094 |
10,520 |
8,430 |
Recovered during 2008-09 |
37,314 |
26,271 |
15,863 |
9,829 |
1,579 |
6,510 |
2,954 |
Written off during 2008-09 |
1,514 |
0 |
0 |
0 |
0 |
0 |
1,514 |
Closing balance for 2008-09 |
68,973 |
45,156 |
25,368 |
18,352 |
3,072 |
13,911 |
6,833 |
Net NPAs |
|
|
|
|
|
|
|
Closing balance for 2007-08 |
24,730 |
17,836 |
8,245 |
8,509 |
740 |
4,907 |
1,247 |
Closing balance for 2008-09 |
31,424 |
21,033 |
9,339 |
10,745 |
1,165 |
6,253 |
2,973 |
Note: Closing balance for 2007-08 does not match with opening balance for 2008-09 due to the following reasons: a) For one bank, closing balance for 2007-08 does not match with opening balance for 2008-09. b) There were a few mergers of banks and a new foreign bank opened with a positive opening balance of gross NPAs.
Source: Balance sheets of respective banks. |
Table IV.26: NPAs Recovered by SCBs through Various Channels |
(Amount in Rs. crore) |
Recovery Channel |
2007-08 |
2008-09 |
No. of
cases
Referred |
Amount Involved |
Amount Recovered |
Col. (4) as % of Col. (3) |
No. of
cases
Referred |
Amount Involved |
Amount Recovered |
Col. (8) as % of Col. (7) |
1 |
2 |
3 |
4 |
5 |
6 |
7 |
8 |
9 |
i) |
Lok Adalats |
1,86,535 |
2,142 |
176 |
8.2 |
5,48,308 |
4,023 |
96 |
5.4 |
ii) |
DRTs |
3,728 |
5,819 |
3,020 |
51.9 |
2,004 |
4,130 |
3,348 |
81.1 |
iii) |
SARFAESI Act |
83,942# |
7,263 |
4,429 |
61.0 |
61,760 |
12,067 |
3,982 |
33.0 |
# : Number of notices issued. |
4.70 The recovery rate (percentage of recovery to demand) of direct agricultural advances of public sector banks has been declining for last couple of years. In line with this trend, the recovery rate declined to 75.4 per cent for the year ended June 2008 from 79.7 per cent a year ago (Table IV.27).
4.71
The Reserve Bank has so far issued Certificate of Registration (CoR) to 12 Securitisation Companies/Reconstruction Companies (SCs/RCs), of which 11 have commenced their operations. As at end-June 2009, the book value of total amount of assets acquired by SCs/RCs registered with the Reserve Bank was Rs.51,542 crore, showing an increase of 24.5 per cent during the year (July 2008 to June 2009). While security receipts subscribed to by banks/FIs amounted to Rs.9,570 crore, security receipts redeemed amounted to Rs.2,792 crore (Table IV.28).
Table IV.27: Recovery of Direct Agricultural Advances of PSBs |
(Amount in Rs. crore) |
Year ended June |
Demand |
Recovery |
Overdues |
Percentage of
Recovery to
Demand |
1 |
2 |
3 |
4 |
5 |
2006 |
46,567 |
37,298 |
9,269 |
80.1 |
2007 |
73,802 |
58,840 |
14,958 |
79.7 |
2008 |
95,100 |
71,739 |
23,361 |
75.4 |
Movements in Provisions for Non-Performing Assets
4.72
Provisioning made during 2008-09 was higher than write-back of excess provisioning during the year. Yet, net NPAs increased during the year due to increase in gross NPAs. Provisions made during the year were higher than write-back of excess provisions for all the bank groups. The outstanding provisions to gross NPA ratio declined in case of all the bank groups except new private sector banks and foreign banks (Table IV.29).
4.73
The gross NPAs to gross advances ratio for SCBs remained constant at 2.3 per cent.
Table IV.28: Details of Financial Assets Securitised by SCs/RCs |
(Amount in Rs. crore) |
Item |
End-June 2008 |
End-June 2009 |
1. |
Book Value of Assets Acquired |
41,414 |
51,542 |
2. |
Security Receipts Issued |
10,658 |
12,801 |
3. |
Security Receipts Subscribed by |
|
|
| |
(a) Banks |
8,319 |
9,570 |
| |
(b) SCs/RCs |
1,647 |
2,544 |
| |
(c) FIIs |
- |
- |
| |
(d) Others (QIBs) |
692 |
687 |
4. |
Amount of Security Receipts completely redeemed |
1,299 |
2,792 |
– : nil/negligible.
Source: Quarterly Statement Submitted by SCs/RCs. |
Table IV.29: Movements in Provisions for Non-performing Assets - Bank Group-wise |
(Amount in Rs. crore) |
Item |
Scheduled
Commercial
Banks
(80) |
Public
Sector
Banks
(27)* |
Nationalised
Banks
(19) |
State
Bank
Group
(7) |
Old Private
Sector
Banks
(15) |
New Private
Sector
Banks
(7) |
Foreign
Banks
(31) |
1 |
2 |
3 |
4 |
5 |
6 |
7 |
8 |
Provisions for NPAs |
|
|
|
|
|
|
|
As at end-March 2008 |
29.307 |
21.091 |
13,910 |
6,729 |
1,719 |
5,109 |
1,387 |
Add : Provisions made during the year |
23.129 |
11.415 |
6,409 |
4,807 |
706 |
7,907 |
3,099 |
Less : Write-off, write back of excess during the year |
17.048 |
10.071 |
5,853 |
4,054 |
613 |
5,373 |
989 |
As at end-March 2009 |
35.388 |
22.435 |
14,465 |
7,482 |
1,811 |
7,642 |
3,498 |
Memo: |
|
|
|
|
|
|
|
Gross NPAs |
68.972 |
45.155 |
25,368 |
18,352 |
3,072 |
13,911 |
6,833 |
Outstanding Provisions to Gross NPAs (per cent) |
|
|
|
|
|
|
|
End-March 2008 |
52.0 |
52.1 |
59.4 |
43.5 |
67.2 |
48.9 |
48.5 |
End-March 2009 |
51.3 |
49.7 |
57.0 |
40.8 |
59.0 |
54.9 |
51.2 |
* : Includes IDBI Bank Ltd.
Note: Figures in parentheses indicate the number of banks in that group at end-March 2009.
Source: Balance sheets of respective banks. |
The gross NPA to gross advances ratio of public sector banks declined but that of private and foreign banks increased. The net NPA ratio (net NPAs as percentage of net advances) increased marginally in case of SCBs (Table IV.30 and Appendix Tables IV.27 and IV.28).
Table IV.30: Gross and Net NPAs of Scheduled Commercial Banks – Bank Group-wise
(As at end-March) |
(Amount in Rs. crore) |
Bank Group/Year |
Gross Advances
Amount |
Gross NPAs |
Net Advances
Amount |
Net NPAs |
Amount |
Per cent to Gross Advances |
Per cent to total Assets |
Amount |
Per cent
to Net
Advances |
Per cent to total Assets |
1 |
2 |
3 |
4 |
5 |
6 |
7 |
8 |
9 |
All Scheduled Commercial Banks |
|
|
|
|
|
|
|
|
2008 |
25,07,885 |
56,309 |
2.3 |
1.3 |
24,76,936 |
24,730 |
1.0 |
0.6 |
2009 |
30,38,254* |
68,973 |
2.3 |
1.3 |
30,00,906 |
31,424 |
1.1 |
0.6 |
Public Sector Banks |
|
|
|
|
|
|
|
|
2008 |
18,19,074 |
40,452 |
2.2 |
1.3 |
17,97,401 |
17,836 |
1.0 |
0.6 |
2009 |
22,83,473 |
45,156 |
2.0 |
1.2 |
22,60,156 |
21,033 |
0.9 |
0.6 |
Old Private Sector Banks |
|
|
|
|
|
|
|
|
2008 |
1,13,404 |
2,557 |
2.3 |
1.3 |
1,11,670 |
740 |
0.7 |
0.4 |
2009 |
1,30,352* |
3,072 |
2.4 |
1.3 |
1,28,512 |
1,165 |
0.9 |
0.5 |
New Private Sector Banks |
|
|
|
|
|
|
|
|
2008 |
4,12,441 |
10,440 |
2.5 |
1.4 |
4,06,733 |
4,907 |
1.2 |
0.7 |
2009 |
4,54,713 |
13,911 |
3.1 |
1.8 |
4,46,824 |
6,253 |
1.4 |
0.8 |
Foreign Banks |
|
|
|
|
|
|
|
|
2008 |
1,62,966 |
2,859 |
1.8 |
0.8 |
1,61,133 |
1,247 |
0.8 |
0.3 |
2009 |
1,69,716 |
6,833 |
4.0 |
1.5 |
1,65,415 |
2, 973 |
1.8 |
0.7 |
*: For 2009, domestic data (unaudited) for Tamilnad Mercantile Bank Ltd. has been used.
Source: Off-site returns for Col. 2 and balance sheets of respective banks for other columns.
|
Table IV.31: Distribution of Scheduled Commercial Banks by Ratio of
Net NPAs to Net Advances |
(Number of banks) |
Bank Group |
As at end-March |
| |
2005 |
2006 |
2007 |
2008 |
2009 |
1 |
2 |
3 |
4 |
5 |
6 |
Public Sector Banks |
28 |
28 |
28 |
28 |
27 |
Up to 2 per cent |
19 |
23 |
27 |
28 |
27 |
Above 2 and up to 5 per cent |
7 |
5 |
1 |
0 |
0 |
Above 5 and up to 10 per cent |
2 |
0 |
0 |
0 |
0 |
Old Private Sector Banks |
20 |
20 |
17 |
15 |
15 |
Up to 2 per cent |
4 |
11 |
15 |
15 |
14 |
Above 2 and up to 5 per cent |
12 |
7 |
1 |
0 |
1 |
Above 5 and up to 10 per cent |
4 |
2 |
1 |
0 |
0 |
New Private Sector Banks |
9 |
8 |
8 |
8 |
7 |
Up to 2 per cent |
5 |
6 |
7 |
7 |
4 |
Above 2 and up to 5 percent |
3 |
2 |
1 |
1 |
3 |
Above 5 and up to 10 per cent |
1 |
0 |
0 |
0 |
0 |
Foreign Banks |
31 |
29 |
29 |
28 |
31 |
Up to 2 per cent |
23 |
25 |
27 |
25 |
24 |
Above 2 and up to 5 per cent |
2 |
0 |
1 |
2 |
6 |
Above 5 and up to 10 per cent |
2 |
0 |
0 |
1 |
1 |
Above 10 per cent |
4 |
4 |
1 |
0 |
0 |
Source: Balance sheets of respective banks. |
4.74 The net NPAs to net advances ratio of each of the public sector banks as at end-March 2009 was less than 2 per cent. The distribution of this ratio in case of other bank groups was also skewed, with only 10 banks in the ‘above 2 per cent and below 5 per cent’ category and only 1 bank in the ‘above 5 per cent and below 10 per cent category’ (Table IV.31). In sharp contrast to the distribution of the ratio as at end-March 2005, no bank had the net NPA to net advances ratio more than 10 per cent. This suggests overall improvement in the financial health of Indian banks in recent years (Appendix Table IV.27 and IV.28).
4.75
It is noteworthy that while the share of NPAs in ‘doubtful’ and ‘loss’ category remained more or less static, the share of ‘sub-standard’ category witnessed some variations. As per the asset classification norms, a sub-standard asset is one which has remained NPA for a period of upto 12 months. Thus, the above-mentioned increase in the share of sub-standard category is indicative of deterioration of the assets in last one year (Table IV.32).
Table IV.32: Classification of Loan Assets - Bank Group-wise
(As at end-March) |
(Amount in Rs. crore) |
Bank Group/Year |
Standard Assets |
Sub-standard Assets |
Doubtful Assets |
Loss Assets |
Total Gross NPAs |
Total Gross Advances |
| |
Amount |
per cent* |
Amount |
per cent* |
Amount |
per cent* |
Amount |
per cent* |
Amount |
per cent* |
Amount |
1 |
2 |
3 |
4 |
5 |
6 |
7 |
8 |
9 |
10 |
11 |
12 |
Scheduled Commercial Banks |
|
|
|
|
|
|
|
|
|
|
|
2008 |
24,51,217 |
97.7 |
26,541 |
1.1 |
24,507 |
1.0 |
5,619 |
0.2 |
56,668 |
2.3 |
25,07,885 |
2009 |
29,61,524 |
97.7 |
37,030 |
1.2 |
26,998 |
0.9 |
6,035 |
0.2 |
70,063 |
2.3 |
30,31,587 |
Public Sector Banks |
|
|
|
|
|
|
|
|
|
|
|
2008 |
17,78,476 |
97.8 |
17,290 |
1.0 |
19,291 |
1.1 |
4,018 |
0.2 |
40,598 |
2.2 |
18,19,074 |
2009 |
22,37,556 |
98.0 |
20,603 |
0.9 |
21,019 |
0.9 |
4,296 |
0.2 |
45,918 |
2.0 |
22,83,473 |
Old Private Sector Banks |
|
|
|
|
|
|
|
|
|
|
|
2008 |
1,10,847 |
97.7 |
816 |
0.7 |
1,346 |
1.2 |
395 |
0.3 |
2,557 |
2.3 |
1,13,404 |
2009 |
1,20,733 |
97.6 |
1,295 |
1.1 |
1,267 |
1.0 |
390 |
0.3 |
2,952 |
2.4 |
1,23,685 |
New Private Sector Banks |
|
|
|
|
|
|
|
|
|
|
|
2008 |
4,02,013 |
97.5 |
6,473 |
1.6 |
3,106 |
0.8 |
849 |
0.2 |
10,428 |
2.5 |
4,12,441 |
2009 |
4,40,813 |
96.9 |
9,258 |
2.0 |
3,708 |
0.8 |
934 |
0.2 |
13,900 |
3.1 |
4,54,713 |
Foreign Banks |
|
|
|
|
|
|
|
|
|
|
|
2008 |
1,59,882 |
98.1 |
1,962 |
1.2 |
764 |
0.5 |
358 |
0.2 |
3,084 |
1.9 |
1,62,966 |
2009 |
1,62,422 |
95.7 |
5,874 |
3.5 |
1,004 |
0.6 |
416 |
0.3 |
7,294 |
4.3 |
1,69,716 |
* : percent to gross advances
Note: 1. Constituent items may not add up to the total due to rounding off.
2. Data for 2009 excludes Tamilnad Merchantile Bank
Source: DSB Returns (BSA) submitted by respective banks. |
Table IV.33: Sector-wise NPAs – Bank Group-wise* |
(Amount in Rs. crore) |
Sector
|
Public Sector Banks |
Old Private Sector Banks |
New Private Sector Banks |
All SCBs |
2007- 08 |
2008-09 |
2007-08 |
2008- 09 |
2007- 08 |
2008- 09 |
2007-08 |
2008-09 |
1 |
2 |
3 |
4 |
5 |
6 |
7 |
8 |
9 |
A. |
Priority Sector |
25,287 |
24,318 |
1,338 |
1,233 |
2,080 |
2,407 |
28,705 |
27,958 |
| |
|
(0.8) |
(0.7) |
(0.7) |
(0.5) |
(0.3) |
(0.3) |
(0.7) |
(0.5) |
| |
i) Agriculture |
8,268 |
5,708 |
243 |
263 |
1,225 |
1,178 |
9,735 |
7,149 |
| |
|
(0.3) |
(0.2) |
(0.1) |
(0.1) |
(0.2) |
(0.2) |
(0.2) |
(0.1) |
| |
ii) Small Scale Industries |
5,805 |
6,984 |
359 |
307 |
292 |
363 |
6,456 |
7,654 |
| |
|
(0.2) |
(0.2) |
(0.2) |
(0.1) |
- |
- |
(0.2) |
(0.2) |
| |
iii) Others |
11,214 |
11,626 |
737 |
663 |
563 |
866 |
12,514 |
13,155 |
| |
|
(0.4) |
(0.3) |
(0.4) |
(0.3) |
(0.1) |
(0.1) |
(0.3) |
(0.3) |
B. |
Public Sector |
299 |
474 |
- |
- |
- |
75 |
299 |
549 |
C. |
Non-Priority Sector |
14,163 |
19,251 |
1,219 |
1,839 |
8,339 |
11,334 |
23,721 |
32,423 |
| |
|
(0.5) |
(0.5) |
(0.6) |
(0.8) |
(1.1) |
(1.4) |
(0.6) |
(0.6) |
Total (A+B+C) |
39,749 |
44,042 |
2,557 |
3,072 |
10,419 |
13,815 |
52,725 |
60,930 |
| |
(1.3) |
(1.2) |
(1.3) |
(1.3) |
(1.4) |
(1.7) |
(1.2) |
(1.2) |
* : Excluding foreign banks.
– : nil/negligible.
Note: Figures in brackets indicate percentage to the total assets of the respective bank group.
Source: Based on off-site returns submitted by banks. |
Sector-wise NPAs
4.76 While the NPAs of priority sector registered
a decline on year-on-year basis, that of non-priority
sector registered a rise of 36.7 per cent. The
decline in priority sector NPAs was contributed
by the agricultural sector, partly reflecting the effect
of the debt waiver scheme for farmers announced
by the Central Government in 2007. The sharp
rise in NPAs of non-priority sector was reflective
of the slowdown in the economy and stressed
financial conditions of corporates [Table IV.33,
Appendix Table IV.29 (A) and 29 (B); and Appendix
Table 30 (A) and 30 (B)]. It is noteworthy that the
Reserve Bank has issued guidelines regarding
restructuring of loans, as a one-time measure and
for a limited period of time in view of the
extraordinary external factors, for preserving the
economic and productive value of assets which
were otherwise viable.
Movements in Provisions for Depreciation on Investments
4.77 The provisions for depreciation on
investments by SCBs increased by 24.6 per cent as at end-March 2009 as compared with a decline of 11.6 per cent at end-March 2008, reflecting higher provisions made during the year than the write-offs and write-back of excess provisions. The provisions for depreciation on investments declined only in case of the foreign banks reflecting higher write-offs during the year (Table IV.34).
4.78 The objective of financial statements is to provide information about the financial position, performance and cash flows of an enterprise that is useful to a wide range of users in making economic decisions. Corporate financial statements, with the notes and narratives surrounding them, are intended to enable investors to predict cash flows, determine returns generated on capital invested, assess the business’ liquidity, and evaluate management’s performance. A number of different measurement methods are employed to different degrees and in varying combinations in financial statements. They include the Historical Cost, Amortised Cost and Fair Value. Although Fair Value Accounting (FVA) has been a part of Generally Acceptable Accounting Principles (GAAP) since the early 1990s, the use of fair value measurements has increased steadily over the past decade, primarily in response to investor demand for relevant and timely financial statements that are useful in making better informed decisions. The recent financial crisis has led to a serious debate on the pros and cons of Fair Value Accounting (FVA) posing a major challenge for the very concept of FVA (Box IV.2).
Table IV.34: Movements in Provisions for Depreciation on Investment – Bank Group-wise |
(Amount in Rs. crore) |
Item |
Scheduled
Commercial
Banks |
Public Sector Banks |
Nationalised Banks |
State
Bank
Group |
Old Private Sector Banks |
New Private Sector Banks |
Foreign Banks |
1 |
2 |
3 |
4 |
5 |
6 |
7 |
8 |
Provision for Depreciation on Investment |
|
|
|
|
|
|
|
As at end-March 2008 |
10,408 |
7,800 |
5,862 |
1,359 |
347 |
909 |
1,353 |
Add : Provision made during the year |
7,467 |
6,067 |
3,540 |
2,235 |
211 |
1,123 |
66 |
Less :Write-off, write-back of excess during the year |
4,917 |
3,916 |
2,103 |
1,262 |
140 |
326 |
534 |
As at end-March 2009 |
12,959 |
9,951 |
7,299 |
2,333 |
418 |
1,705 |
885 |
*: Includes IDBI Bank Ltd.
Source: Balance sheets of respective banks. |
Capital Adequacy
4.79 One of the major indicators suggesting that the Indian banking system has withstood the pressure of global financial turmoil is the improvement in the CRAR. The overall CRAR of all SCBs improved to 13.2 per cent at end-March 2009 from 13.0 per cent a year ago, thus, remaining significantly above the stipulated minimum of 9.0 per cent. The rise in CRAR was mainly due to maintenance of high growth rate of Tier II capital of banks (27.2 per cent from 28.9 per cent last year), notwithstanding deceleration in growth rate of both the Tier I capital (17.0 per cent from 41.4 per cent last year) and that of risk weighted assets (18.4 per cent from 29.7 per cent last year) (Table IV.35).
4.80
The Tier I CRAR has remained more than the present stipulated requirement of 4.5 per cent and also above the 6.0 per cent norm prescribed in the final guidelines for implementation of Basel II released by the Reserve Bank on April 27, 2007. As evident in Chart IV.19, the movements in Tier I CRAR and Tier II CRAR of SCBs have complemented each other, enabling a smooth maintenance of CRAR well above the prescribed prudential norms. In continuation of this trend, the marginal fall in Tier I CRAR (to 8.9 per cent as at end-March 2009 from 9.1 per cent last year), was more than compensated by the rise in Tier II CRAR (from 3.9 per cent to 4.2 per cent), thus resulting in an overall increase in CRAR from 13.0 per cent to 13.2 per cent (Chart IV.15).
4.81
During 2008-09, the CRAR of major bank groups remained static or improved, except for a marginal deterioration observed in case of public sector banks. The decline in CRAR of public sector banks was mainly contributed by the SBI Group and associates. In fact the CRAR of public sector banks group alone was below the industry average, while that of old private sector banks, new private sector banks and foreign banks was above the industry average (Table IV.36).
Box IV.2: Fair Value Accounting - Issues and Perspectives
In accounting, ‘fair value’ is used as an estimate of the market value of an asset (or liability) for which a market price cannot be determined primarily because there is no established market for the asset. Under US Generally Acceptable Accounting Principles (GAAP) (FAS 157), fair value of an asset is the amount at which the asset could be bought or sold in a current transaction between willing parties, other than in liquidation. On the other side of the balance sheet, the fair value of a liability is the amount at which that liability could be incurred or settled in a current transaction between willing parties other than in liquidation. If available, a quoted market price in an active market is the best evidence of fair value and should be used as a basis for the measurement. If quoted market price is not available, then the best information available is required to be used in estimation of the fair value, although it introduces an element of subjectivity. Although Fair Value Accounting (FVA) has been a part of GAAP since the early 1990s, the use of fair value measurements has increased steadily over the past decade, primarily in response to investor demand for relevant and timely financial statements that helps in making better informed decisions.
To increase consistency and comparability in fair value measurements and related disclosures, FAS 157 establishes a fair value hierarchy for assets or liabilities that prioritises the inputs, or assumptions, used in valuation techniques. Thus at level one, liquid assets with quoted prices, like price of liquid security, form the inputs. At the second level, the valuation is based on direct or indirect market observables. Examples of observable market inputs include: quoted prices for similar assets, interest rates, yield curve, credit spreads, prepayment speeds, etc. At level three, the valuation is based on non-observable assumption, like entity’s internal valuation model. This method is especially useful when the the cost and effort to obtain external information is very high.
There have been several attempts by the standard setters to enhance the fair value accounting methodologies in recent times. In May 2009, based on the discussions in various international bodies, especially the G 20, in the aftermath of the global financial turmoil, the International Accounting Standards Board (IASB) has published an exposure draft on fair value measurements.
The concept of fair value accounting assumes a greater importance during economic crisis, since the markets are thin for assets and trade is relatively infrequent. During such spells, there are few, if any, buyers for such products thereby complicating the marking process. The recent financial crisis has led to a serious debate on the pros and cons of fair-value accounting. A deeper analysis reveals that the turmoil in the financial markets cannot be attributed to FVA. Instead, much of the controversy results from lack of clarity as to what is new and different about FVA. Second, while there are legitimate concerns about marking to market (or pure FVA) in times of financial crisis, it is less clear whether these problems apply to FVA as stipulated by the accounting standards, be it IFRS or US GAAP. Third, historical cost accounting is unlikely to be the remedy since there are a number of concerns about this as well and these problems could be larger than those with FVA. Fourth, although it is difficult to fault the FVA standards per se, implementation issues are a potential concern, especially with respect to litigation.
The accounting rules for which assets and liabilities are held at fair value are complex. For commercial banks and other types of financial services firms, some asset classes are required to be carried at fair value, such as derivatives and marketable equity securities. For other types of assets, such as loan receivables and debt securities, it depends on whether the assets are held for trading (active buying and selling) or for long term/ till maturity. The use of the FVO by banks gives rise to some supervisory concerns. One important concern relates to extending fair value as a measurement basis for illiquid financial instruments for which there are no observable market prices. While allowing the bank use its own assumptions, the available market data, such as interest rates, default rates, prepayment speeds, etc. should not be ignored.
Notwithstanding several debates, there is a general consensus that the clock should not be turned back on Fair Value Accounting just to address the issue of temporary market illiquidity.
The Indian accounting standards are generally aligned to the International Financial Reporting Standards, though there are some differences. In India, we are yet to fully adopt the marking-to-market requirements as available in the international standards. The Indian standards are relatively conservative and do not permit recognition of unrealised gains in the profit and loss account or equity, though unrealised losses are required to be accounted. Banks are required to mark-to-market the investments in the Held for Trading (HFT) and Available for Sale (AFS) categories at periodical intervals, on a portfolio basis, and provide for the net losses and ignore the net gains. This has proved to be a stabilising factor, inasmuch as it has not induced an imbalance in the incentive structures and has also proved to be less pro-cyclical.
Table IV.35: Scheduled Commercial Banks –
Component-wise CRAR (As at end-March) |
(Amount in Rs. crore) |
Item / End-March |
2007 |
2008 |
2009 |
1 |
2 |
3 |
4 |
A. |
Capital Funds (i+ii) |
2,96,191 |
4,06,835 |
4,88,653 |
| |
i) Tier I Capital |
2,00,386 |
2,83,339 |
3,31,513 |
| |
of which: |
|
|
|
| |
Paid-up Capital |
29,462 |
41,178 |
46,339 |
| |
Reserves |
1,64,077 |
2,40,248 |
2,55,793 |
| |
Unallocated/
Remittable
Surplus |
20,387 |
23,846 |
53,336 |
| |
Deductions for Tier-I Capital |
13,662 |
21,933 |
19,576 |
| |
ii) Tier-II Capital |
95,794 |
1,23,496 |
1,57,141 |
| |
of which: |
|
|
|
| |
Discounted Subordinated Debt |
63,834 |
73,297 |
86,396 |
B. |
Risk-weighted Assets |
24,12,236 |
31,28,093 |
37,05,166 |
| |
of which: |
|
|
|
| |
Risk-weighted Loans and Advances |
17,17,810 |
21,66,234 |
25,67,787 |
C. |
CRAR
(A as per cent of B) |
12.3 |
13.0 |
13.2 |
| |
of which: |
|
|
|
| |
Tier I |
8.3 |
9.1 |
8.9 |
| |
Tier II |
4.0 |
3.9 |
4.2 |
Source: Based on off-site returns submitted by banks. |
4.82 Among the five largest SCBs in India, all the banks except ICICI bank witnessed a marginal decline during 2008-09, while still maintaining CRAR much higher than the 9 per cent prudential norm. It is noteworthy that notwithstanding the marginal decline in the CRAR of each of these banks, their Tier I capital as well as Tier II capital has risen during the year. The decline in CRAR is thus a mere reflection of higher risk weights assigned to the assets of these bank, in face of higher uncertainties prevalent in the financial markets and is not a cause of regulatory concern (Chart IV.16).
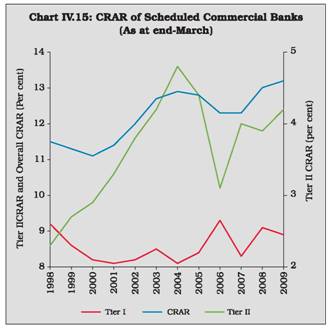
Table IV.36: Capital Adequacy Ratio – Bank Group-wise
(As at end-March) |
(Per cent) |
Bank Group |
2001 |
2002 |
2003 |
2004 |
2005 |
2006 |
2007 |
2008 |
2009 |
1 |
2 |
3 |
4 |
5 |
6 |
7 |
8 |
9 |
10 |
Scheduled Commercial Banks |
11.4 |
12.0 |
12.7 |
12.9 |
12.8 |
12.3 |
12.3 |
13.0 |
13.2 |
Public Sector Banks |
11.2 |
11.8 |
12.6 |
13.2 |
12.9 |
12.2 |
12.4 |
12.5 |
12.3 |
Nationalised Banks |
10.2 |
10.9 |
12.2 |
13.1 |
13.2 |
12.3 |
12.4 |
12.1 |
12.1 |
SBI Group |
12.7 |
13.3 |
13.4 |
13.4 |
12.4 |
11.9 |
12.3 |
13.2 |
12.7 |
Old Private Sector Banks |
11.9 |
12.5 |
12.8 |
13.7 |
12.5 |
11.7 |
12.1 |
14.1 |
14.3 |
New Private Sector Banks |
11.5 |
12.3 |
11.3 |
10.2 |
12.1 |
12.6 |
12.0 |
14.4 |
15.1 |
Foreign Banks |
12.6 |
12.9 |
15.2 |
15.0 |
14.0 |
13.0 |
12.4 |
13.1 |
15.1 |
Source: Based on off-site returns submitted by banks. |
4.83 As mentioned earlier, one of the significant indictors of the resilience of the Indian banking sector is the improvement in CRAR of all the SCBs. At the individual bank level, the CRAR of all SCBs was above the prescribed requirement of 9 per cent at end-March 2009. While the CRAR of as many as 78 banks was above 10 per cent, that of only one bank was in the range of 9 to 10 per cent (Table IV.37).
 4.84 The SCBs in India have switched over to the simple approaches available in the Basel II framework. This is expected to help in aligning the banks’ regulatory capital with their economic capital and thereby improving capital efficiency (Box IV.3).
6. Banks’ Operations in the Capital Market
Resources raised by Banks from the Primary Capital Market4.85
SCBs did not raise any resources from primary market during 2008-09 as against Rs.29,955 crore raised in the previous year. This could be explained mainly in terms of drying up of liquidity in the primary segment of the Indian capital market reflecting both lacklustre performance of the secondary market as well as postponement of investment demand by Indian corporate as a fallout of the international financial crisis. Comfortable liquidity with the banking system could be one important reason for the banks’ desisting from raising resources from the primary capital market (Table IV.38).
4.86
Banks preferred to raise resources through debt issues in the private placement market, which increased by 34.6 per cent during 2008-09 (Table IV.39).
Table IV.37: Distribution of Scheduled Commercial Banks by CRAR |
(Number of banks) |
Bank Group
|
2007-08 |
2008-09 |
Below
9 per cent |
Between
9-10 per cent |
Above
10 per cent |
Below
9 per cent |
Between
9-10 per cent |
Above
10 per
cent |
1 |
2 |
3 |
4 |
5 |
6 |
7 |
Nationalised Banks* |
- |
- |
20 |
- |
1 |
19 |
State Bank Group |
- |
- |
8 |
- |
- |
7 |
Old Private Sector Banks |
- |
1 |
14 |
- |
- |
15 |
New Private Sector Banks |
- |
- |
8 |
- |
- |
7 |
Foreign Banks |
- |
1 |
27 |
- |
- |
30 |
Total |
- |
2 |
77 |
- |
1 |
78 |
– : Nil/Negligible.
* : Includes data for IDBI Bank Ltd.
Source: Based on off-site returns submitted by banks. |
Box IV.3: Capital Adequacy under Basel-I and Basel-II: Indian Experience
Traditionally, banks held capital as a buffer against insolvency, and liquid assets – cash and securities – to guard against unexpected withdrawals by depositors or drawdowns by borrowers (Saidenberg and Strahan, 1999). Traditional approaches to bank regulation emphasise the positive features of capital adequacy requirements (Dewatripont and Tirole, 1994). On the other hand, it has been argued that capital requirements may increase risk taking behavior. If equity capital is more expensive to raise than deposits, then an increase in risk-based capital requirements tends to reduce banks’ willingness to screen and lend (Thakor, 1996). It has also been found that raising capital requirements forces banks to supply fewer deposits, which reduces the liquidity-providing role of banks. Given these pros and cons, it is now argued that capital that needs to be maintained should be consistent with the risk profile and operating environment. The Basel II framework is a step in this direction as these norms aim at aligning minimum capital requirements to banks’ underlying risk profiles.
The Basel I framework was confined to the minimum capital requirements for banks, and largely focussed on the credit risk. The Basel II framework, on the other hand expands this approach to include, inter alia, a largely new, risk-adequate calculation of capital requirements which (for the first time) explicitly includes operational risk in addition to market and credit risk. While Basel I required lenders to calculate a minimum level of capital based on a single risk weight for each of the limited number of asset classes, under Basel II, the capital requirements are more risk sensitive. Basel II capital adequacy rules are based on a ‘menu’ approach that allows differences in approaches in relationship in the nature of banks and the nature of markets in which they operate. Thus, Basel II prescriptions have ushered in a transition from capital adequacy to capital efficiency which implies that banks adopt a more dynamic use of capital, in which capital will flow quickly to its most efficient use. These elements of Basel II take the regulatory framework closer to the business models employed in several large banks.
All the SCBs in India have adopted the Standardised Approach (SA) for credit risk, Basic Indicator Approach (BIA) for operational risk and Standardised Duration approach for market risk for computing their capital requirements under the revised framework as at end-March 2009. Banks are required to maintain a minimum Capital to Risk-weighted Assets Ratio (CRAR) of 9 per cent on an ongoing basis. The Reserve Bank will take into account the relevant risk factors and the internal capital adequacy assessments of each bank to ensure that the capital held by a bank is commensurate with the bank’s overall risk profile. This would include, among others, the effectiveness of the bank’s risk management systems in identifying, assessing / measuring, monitoring and managing various risks including interest rate risk in the banking book, liquidity risk, concentration risk and residual risk. Accordingly, the Reserve Bank will consider prescribing a higher level of minimum capital ratio for each bank under the Pillar 2 framework on the basis of their respective risk profiles and their risk management systems. Further, in terms of the Pillar 2 requirements of the New Capital Adequacy Framework, banks are expected to operate at a level well above the minimum requirement.
Furthermore, the minimum capital maintained by banks on implementation of the revised framework will be subjected to a prudential floor, which shall be higher of the following amounts: a) Minimum capital required to be maintained as per the Revised Framework; b) A specified per cent of the minimum capital required to be maintained as per the Basel I framework for credit and market risks. The specified per cent will progressively decline as indicated in Table 1.
Table 1: Prudential Floor |
Financial Year Ending* |
March 2009 |
March 2010 |
March 2011 |
Prudential floor( as % of minimum capital requirement computed as per current (Basel I) framework for credit and market risks) |
100 |
90 |
80 |
*: The relevant periods shall be March 2009, March 2010 and March 2011 for banks implementing the revised framework with effect from March 31, 2009. |
Data on bank-wise CRAR based on Basel I and Basel II are available and are reported in Appendix IV.31. Out of 80 banks, all banks except Bank Internasional Indonesia and Sonali Bank have reported CRAR under Basel II and 14 banks have not reported CRAR under Basel I. A frequency distribution based on data of 64 banks, which have reported CRAR under both Basel I and Basel II, suggests that 12 per cent to 15 per cent is the modal range of CRAR (Table 2).
A bank-group wise analysis reveals that for the State Bank of India and all its associates, the CRAR under Basel II was higher than that under Basel I for the year 2008-09. Same trend was also observed in case of majority of nationalised banks. On the other hand, majority of the foreign sector banks reported higher CRAR under Basel I than that under Basel II. The private sector banks, however reported a mixed trend (Appendix IV.31).
Table 2: Distribution of banks based on CRAR |
CRAR (%) |
No. of banks as on March 31, 2009 |
Basel-I |
Basel-II |
Indian |
Foreign |
Total |
Indian |
Foreign |
Total |
9-12 |
12 |
0 |
12 |
6 |
0 |
6 |
12-15 (Modal range) |
26 |
4 |
30 |
29 |
4 |
33 |
15-18 |
2 |
2 |
4 |
5 |
4 |
9 |
18-21 |
2 |
2 |
4 |
2 |
0 |
2 |
21-24 |
1 |
0 |
1 |
1 |
1 |
2 |
24-27 |
0 |
0 |
0 |
0 |
3 |
3 |
27-30 |
0 |
2 |
2 |
0 |
0 |
0 |
30-33 |
0 |
2 |
2 |
0 |
0 |
0 |
33 & above |
1 |
8 |
9 |
1 |
8 |
9 |
Total |
44 |
20 |
64 |
44 |
20 |
64 |
References:
Dewatripont, M. and J. Tirole. 1994. The Prudential Regulation of Banks. Cambridge: MA MIT Press, Elizalde, A. and R. Repullo. 2006. “Economic and Regulatory Capital in Banking: What is the Difference?.”C.E.P.R. Discussion Papers. 4770.
Saidenberg, M. and P. Strahan. 1999. “Are Banks Important for Financing Large Businesses?” Current Issues in Economics and Finance, 5(12).
Thakor, A. 1996. “Capital Requirements, Monetary Policy and Aggregate Bank Lending: Theory and Evidence.” Journal of Finance, 51:279–324.
Table IV.38: Public Issues by the Banking Sector |
(Amount in Rs. crore) |
Year |
Public Sector Banks |
Private Sector Banks |
Total |
Grand Total |
| |
Equity |
Debt |
Equity |
Debt |
Equity |
Debt |
|
1 |
2 |
3 |
4 |
5 |
6 |
7 |
8 |
2004-05 |
3,336 |
- |
4,108 |
1,478 |
7,444 |
1,478 |
8,922 |
2005-06 |
5,413 |
- |
5,654 |
- |
11,067 |
- |
11,067 |
2006-07 |
7,82 |
- |
284 |
- |
1,066 |
- |
1,066 |
2007-08 |
17,552 |
- |
12,403 |
500 |
29,955 |
500 |
30,455 |
2008-09 |
- |
- |
- |
- |
- |
- |
- |
– : Nil/Negligible. |
Table IV.39: Resources Raised by Banks through Private Placements |
(Amount in Rs. crore) |
Category |
2007-08 |
2008-09 |
| |
No. of Issues |
Amount Raised |
No. of Issues |
Amount Raised |
1 |
2 |
3 |
4 |
5 |
Private Sector Banks |
10 |
2,090 |
13 |
6,967 |
Public Sector Banks |
58 |
24,109 |
52 |
28,304 |
Total |
68 |
26,199 |
65 |
35,271 |
Source: Merchant Bankers and Financial Institutions. |
Performance of Banking Stocks in the Secondary Market
4.87 The domestic stock markets in India which had witnessed buoyant conditions since 2003-04, registered considerable losses during 2008-09 as a fallout of the global financial crisis. The BSE Sensex registered a decline of 37.9 per cent during 2008-09. The BSE Bankex recorded a decline of 41.8 per cent during 2008-09 which was higher than that of BSE Sensex.
4.88
The volatility (as measured by the coefficient of variation) of BSE Bankex (23.8 per cent) was only marginally lower than that of BSE Sensex (24.2 per cent) during 2008-09 (Table IV.40).
4.89
In 2009-10 so far however, the BSE Bankex registered a sharper recovery as compared with BSE Sensex, even though its volatility was higher vis-a-vis that of BSE Sensex.
4.90
In line with the overall trend, all the bank stocks listed on BSE witnessed a downtrend during the year, except Union Bank of India. The downtrend in prices also reflected in the lower Price Earning (P/E) ratios of the bank stocks. It is noteworthy that, on an average, the decline in P/E ratios of private sector banks was sharper than the same in case of public sector banks. This was partly due to the fact that private sector banks, which had higher valuations during 2007-08, witnessed a sharper decline in stock prices during 2008-09 as compared to the public sector banks (Appendix Table IV.32).
Table IV.40: Performance of Bank Stocks – Risk and Return |
Indices |
Returns* |
Volatility@ |
| |
2007-08 |
2008-09 |
2009-10# |
2007-08 |
2008-09 |
2009-10# |
1 |
2 |
3 |
4 |
5 |
6 |
7 |
BSE Bankex |
18.0 |
-41.8 |
119.5 |
13.8 |
23.8 |
15.6 |
BSE Sensex |
19.7 |
-37.9 |
76.4 |
12.0 |
24.2 |
12.5 |
* : Percentage variations on a point-to-point basis.
@ : Defined as coefficient of variation.
# : Up to end-September, 2009.
Source: Bloomberg. |
Table IV.41: Relative Share of Bank Stocks – Turnover and Market Capitalisation |
(Per cent) |
Year |
Share of turnover of
bank stocks in total
turnover |
Share of capitalisation of
bank stocks in total market
capitalisation* |
1 |
2 |
3 |
2005-06 |
6.8 |
7.1 |
2006-07 |
5.3 |
6.8 |
2007-08 |
6.6 |
7.2 |
2008-09 |
12.3 |
7.7 |
* : As at end-period.
Note: Data for turnover and market capitalisation of banks
relate to Bank Nifty Index of NSE.
Source: National Stock Exchange of India Limited (NSE). |
4.91 Bank stocks continued to constitute 7
per cent of the market capitalisation of the
Indian equity market. More significantly, the
share of banking stocks in total turnover of NSE
nearly doubled during 2008-09 (Table IV.41).
Shareholding Pattern in Public Sector Banks
4.92 In line with the stated policy, the
Government shareholding in public sector
banks has remained above the 51 per cent
mark. The private shareholding pattern of
public sector banks, constituting shareholding
of resident and non-resident financial institutions, resident and non-resident corporate and resident and non-resident individuals, remained same as last year, except for that of the UCO Bank. Following the Government initiative to restructure the capital, the Government shareholding in UCO bank has fallen to 63.6 per cent from 75.0 per cent last year (Table IV.42 and Appendix Table IV.33).
4.93 The shareholding of Foreign Financial Institutions (FFIs) in Indian banks, especially public sector banks, witnessed a mixed trend. The reduced shareholding by FFIs in some of the public sector banks is reflective of the subdued conditions in the stock market in general and banking sector stocks in particular, coupled with net outflow of portfolio investments during the year (Table IV.43).
Table IV.42: Private Shareholding in
Public Sector Banks*
(As at end-March) |
Category |
2008 |
2009 |
1 |
2 |
3 |
Up to 10 per cent |
2 |
2 |
More than 10 and up to 20 per cent |
2 |
2 |
More than 20 and up to 30 per cent |
3 |
2 |
More than 30 and up to 40 per cent |
3 |
4 |
More than 40 and up to 49 per cent |
11 |
11 |
– : Nil/negligible
* : Including 19 nationalised banks, State Bank of India and IDBI Bank Ltd. |
Table IV.43: Foreign Financial Institutions (Non-resident) Shareholding in Indian Banks
(As at end-March) |
(No. of Banks) |
Category |
Public Sector Banks |
New Private Sector Banks |
Old Private Sector Banks |
2008 |
2009 |
2008 |
2009 |
2008 |
2009 |
1 |
2 |
3 |
4 |
5 |
6 |
7 |
Nil |
12 |
11 |
2 |
2 |
7 |
7 |
Up to 10 per cent |
3 |
8 |
- |
- |
- |
- |
More than 10 and up to 20 per cent |
13 |
8 |
1 |
1 |
2 |
2 |
More than 20 and up to 30 per cent |
- |
- |
2 |
1 |
3 |
3 |
More than 30 and up to 40 per cent |
- |
- |
1 |
2 |
1 |
3 |
More than 40 and up to 50 per cent |
- |
- |
1 |
- |
1 |
- |
More than 50 and up to 60 per cent |
- |
- |
- |
- |
1 |
- |
More than 60 and up to 70 per cent |
- |
- |
1 |
1 |
- |
- |
More than 70 and up to 80 per cent |
- |
- |
- |
- |
|
|
Total |
28 |
27 |
8 |
7 |
15 |
15 |
7. Technological Developments in Banks
4.94
Use of technology in expanding banking is one of the key focus areas of the Reserve Bank. The banks in India are using Information Technology (IT) not only to improve their own internal processes but also to increase facilities and services to their customers. Efficient use of technology has facilitated accurate and timely management of the increased transaction volume of banks that comes with a larger customer base. One of the visible outcomes of this is that banks are aiming to serve the hitherto unbanked population of the country at their doorstep by undertaking large scale financial inclusion by offering specially designed, simple, safe, yet technology based products.
4.95
During the year, the transmission of clearing data - both for cheque and Electronic Clearing services, collation of inputs from currency chests as part of the Integrated Currency Chest Operations and Management System (ICCOMS) was done using the secured web site. The existing IT system to process the requirements of the State and Central Governments for the accounting requirements was replaced by the Centralised Public Accounts Department System (CPADS), which is more secure, robust and user friendly system.
4.96 To facilitate a smoother and faster
bidding in the Primary Dated Securities
Auctions held by Reserve Bank a new version
of the Negotiated Dealing System Auction
module, developed and hosted by Clearing
Corporation of India was launched with effect
from May 11, 2009. The new auction platform
replaced the Auction platform which was
available under the PDO NDS application hosted
at the Reserve Bank.
4.97 The IDRBT, as ‘certifying authority’ for
the banking sector in India, has issued over
1,20,000 Digital Certificates enabling banks to
work in secured environment while operating RTGS, CFMS, Corporate e-mail, SFMS, CTS, Internet Banking Web Server, OLTAS and CCIL settlement applications etc. There are 133 Registration Authority (RA) covering 33 public sector banks, 31 private sector banks and 5 financial institutions, including 16 Registration Authority Offices created for State Bank of India. IDRBT is also acting as Registration Authority Office for banks and financial institutions that do not have an RA set up.
4.98
One of the major achievements during the year under review was the increase in coverage of the number of branches providing Core Banking Solution (CBS). The total number of branches of public sector banks which have implemented CBS increased from 35,464 as on March 31, 2008 to 44,304 as on March 31, 2009. The process of computerisation of the banking sector, which is regarded as the precursor to other technological initiatives, is almost on the completion stage. Public sector banks continued to spend large amounts on computerisation and development of communication networks. In fact the growth rate of amount spent by public sector banks on computerisation, which had shown some deceleration in 2007-08, accelerated during 2008-09. The cumulative amount spent from September 1999 to March 2009 aggregated Rs.18,168 crore, registering an increase of 21.0 per cent over the previous year (Appendix Table IV.34). In line with the trend witnessed last year, the proportion of branches providing core banking solution in total branches increased significantly during 2008-09 (Table IV.44).
4.99
The proportion of public sector bank branches which achieved full computerisation increased from 93.7 per cent as at end-March 2008 to 95.0 per cent as at end-March 2009. Continuous progress is being made by banks to achieve a higher target, as more number of banks have moved into the 'more than 90 per cent but less than 100 per cent' category (Appendix Table IV.35).
Table IV.44: Computerisation in Public Sector Banks
(As at end-March) |
(Per cent of total bank branches) |
Category |
2008 |
2009 |
1 |
2 |
3 |
Fully Computerised Branches (i+ii) |
93.7 |
95.0 |
i) |
Branches Under Core Banking Solution |
67.0 |
79.4 |
ii) |
Branches already Fully Computerised # |
26.6 |
15.6 |
Partially Computerised Branches |
6.3 |
5.0 |
# : Other than branches under Core Banking Solution. |
4.100
During 2008-09, the total number of ATMs installed by the banks grew by 25.4 per cent, with number of ATMs of SBI Group registering a sharp growth of 34.5 per cent. While, the ATMs installed by new private sector banks and foreign banks were more than 3 times of their respective branches, the ATM to branch ratio was much lower for other bank groups (Table IV.45, Appendix Table IV.36).
4.101
Of all the ATMs installed in the country at end-March 2009, new private sector banks had the largest share in off-site ATMs, while nationalised banks had the largest share in on-site ATMs (Chart IV.17).
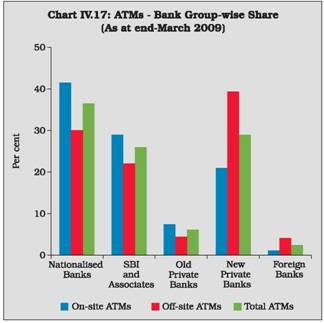
Table IV.45: Branches and ATMs of Scheduled Commercial Banks
(As at end-March 2009) |
Bank Group |
Number of Bank/Branches |
Number of ATMs |
Off-site
ATMs as
percent
age of
total ATMs |
ATMs as percent
age of Bran
ches |
Rural |
Semi-urban |
Urban |
Metropolitan |
Total |
On-site |
Off- site |
Total |
1 |
2 |
3 |
4 |
5 |
6 |
7 |
8 |
9 |
10 |
11 |
i) |
Nationalised Banks |
13,381 |
8,669 |
8,951 |
8,375 |
39,376 |
10,233 |
5,705 |
15,938 |
35.8 |
40.2 |
ii) |
State Bank Group |
5,560 |
4,835 |
3,043 |
2,624 |
16,062 |
7,146 |
4,193 |
11,339 |
37.0 |
29.0 |
iii) |
Old Private Sector Banks |
842 |
1,554 |
1,344 |
933 |
4,673 |
1,830 |
844 |
2,674 |
31.6 |
56.9 |
iv) |
New Private Sector Banks |
271 |
1,084 |
1,371 |
1,478 |
4,204 |
5,166 |
7,480 |
12,646 |
59.2 |
296.6 |
v) |
Foreign Banks |
4 |
4 |
52 |
233 |
293 |
270 |
784 |
1,054 |
74.4 |
357.3 |
Total (i to v) |
20,058 |
16,146 |
14,761 |
13,643 |
64,608 |
24,645 |
19,006 |
43,651 |
43.5 |
67.0 |
4.102 In recent years, the use of electronic payments has witnessed manifold increase, partly reflecting increased adoption of technology. The growth of volume of transactions directed through electronic payment method, however, decelerated from 41.4 per cent in 2007-08 to 24.8 per cent in 2008-09 (Table IV.46). More strikingly, the value of transactions directed through electronic payment method declined sharply during 2008-09. The entire decline is due to 87.5 per cent fall in value of transaction in respect of ECS-credit. It is noteworthy in this regard that the sharp rise in ECS credit value during 2007-08 was mainly due to the refund of the oversubscription amount of IPOs floated by companies using electronic mode as mandated by the stock exchange. Therefore, the decline in value of ECS credit transactions during 2008-09 may be interpreted more as returning to normal trend rather than a matter of concern.
Table IV.46: Transactions through Retail Electronic Payment Methods |
Type
|
Volume of transactions (000’s) |
Growth in volume (per cent) |
Value of transactions
(Rs. crore) |
Growth in value (per cent) |
2006-07 |
2007-08 |
2008-09 |
2007-08 |
2008-09 |
2006-07 |
2007-08 |
2008-09 |
2007-08 |
2008-09 |
1 |
2 |
3 |
4 |
5 |
6 |
7 |
8 |
9 |
10 |
11 |
1. |
ECS-Credit |
69,019 |
78,365 |
88,394 |
13.5 |
12.8 |
83,273 |
7,82,222 |
97,487 |
839.3 |
-87.5 |
2. |
ECS-Debit |
75,202 |
1,27,120 |
1,60,055 |
69.0 |
25.9 |
25,441 |
48,937 |
66,976 |
92.3 |
36.9 |
3. |
EFT/ NEFT |
4,776 |
13,315 |
32,161 |
178.8 |
141.5 |
77,446 |
1,40,326 |
2,51,956 |
81.2 |
79.6 |
4. |
Credit Cards |
1,69,536 |
2,28,203 |
2,59,561 |
34.6 |
13.7 |
41,361 |
57,984 |
65,356 |
40.2 |
12.7 |
5. |
Debit Cards |
60,177 |
88,306 |
1,27,654 |
46.7 |
44.6 |
8,172 |
12,521 |
18,547 |
53.2 |
48.1 |
Total |
3,78,710 |
5,35,309 |
6,67,825 |
41.4 |
24.8 |
2,35,693 |
10,41,990 |
5,00,322 |
342.1 |
-52.0 |
4.103 The volume of ECS credit and more significantly ECS debit continued to show an increasing trend during 2008-09 in line with the trend witnessed during past few years [Chart IV.18(a) and IV.18(b)].
4.104 The large value payment systems include the Real Time Gross Settlement (RTGS), Government securities clearing and forex clearing. The RTGS has been working smoothly since its operationalisation in March 2004. As at end-August 2009, 107 participants (96 banks, 8 primary dealers, the Reserve Bank and the Deposit Insurance, Credit Guarantee Corporation and Clearing Corporation of India Limited) are members of the RTGS system. The reach and utilisation of the RTGS is consistently increasing. The bank/branch network coverage increased to 58,720 branches at more than 10,000 centres leading to increased usage of this mode of funds transfer. The daily average volume of transactions is 90,000 for about Rs.1,200 billion of which 82,000 transactions for about Rs.980 billion pertain to customer transactions as at end of August 2009 (Chart IV.19).
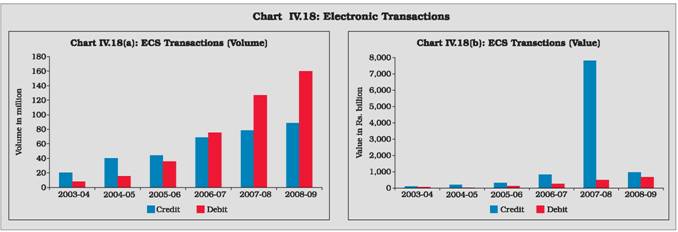
 8. Regional Spread of Banking
4.105
Access to reasonably priced and conveniently located financial and banking services, play a crucial role in financial inclusion initiatives of a country. The equitable regional spread of banking assumes special importance in a vast country like India, with its diverse regional characteristics. The Basic Statistical Return system is especially designed and suitably modified over the years to provide granular data on regional spread of banking. This dataset provides comprehensive information on the banking operations across country and is therefore a valuable and indispensible dataset for policy formulation.
4.106
The total number of branches of SCBs registered an increase of 5.7 per cent as at end-March 2009 as compared with the growth rate of 7.2 per cent during the last year. In absolute terms, number of bank branches are highest in rural area, mainly reflecting the policy thrust of the Reserve Bank. On the other hand, however, the share of rural braches in the total is witnessing a fall in recent years, while that of urban and metropolitan branches is witnessing a rise. As revealed by Table IV.52, the major part
of business for the banks is earned by the top hundred centres, mainly situated in metropolitan and urban areas. The SBI Group and the Nationalised Banks had maximum proportion of branches in rural areas. Foreign bank branches were, however, mostly concentrated in the urban and metropolitan areas with negligible presence in rural and semi-urban areas (Chart IV.20 and Appendix Table IV.36).

4.107 The top hundred centres accounted for around a quarter of the total number of offices but nearly 70 per cent of total deposits and 78.5 per cent of total credit. This indicates the continuing crucial role played by top hundred centres both in raising deposits as well as allocation of credit (Table IV.47).
Table IV.47: Share of Top Hundred Centres in Aggregate Deposits and Gross Bank Credit |
(Per cent) |
End-March |
Deposits |
Credit |
| |
Offices |
Amount |
Offices |
Amount |
1 |
2 |
3 |
4 |
5 |
2008 |
25.7 |
69.7 |
25.6 |
77.8 |
2009 |
26.2 |
69.2 |
26.2 |
78.5 |
Source: Basic Statistical Return-7. |
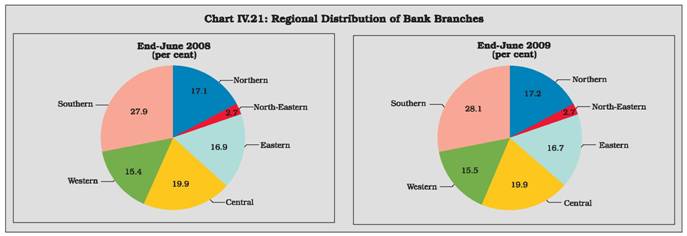 4.108 The rate of expansion of total number of bank branches decelerated to 4.5 per cent during 2008-09 from 5.2 per cent during the 2007-08. The average population served by a single bank branch remained unchanged at 15,000 as at end-June 2009 as compared with end-June 2008 (Appendix Table IV.37).In continuation of the trend, the Southern region continued to account for the largest percentage of existing bank branches during 2008-09, followed by the Central, Northern, Eastern, Western and the North-Eastern regions. The share of Southern, Northern and Western region increased during 2008-09 while that of Eastern region fell (Chart IV.21, Appendix Table IV.38). The Southern region (30.7 per cent of incremental branches) and the Central region (19.8 per cent of incremental branches) continued to be the leaders in opening new branches during July 2008 to June 2009.
4.109
The region-wise credit-deposit (C-D) ratio is one of the indicators to evaluate the performance of banks at the regional level in the context of its role to enable development of the region. The ‘Expert Group on Credit – Deposit Ratio’ (Chairman: Shri. Y. S. P. Thorat) (November 2004), suggested that as the C-D ratio should realistically reflect efforts of the banking system in contributing to the economic development of the States, the investments made by banks in State Government securities and bonds of State level enterprises should also be factored into the concept. Following this recommendation, in addition to the C-D ratio, the investment plus credit to deposit ratio is also being used widely. Further, as the RIDF represents the resource support provided by banks to the States, it was felt that use of investment plus credit plus RIDF deposit ratio would provide a better picture regarding banks’ performance9. In view of this, region-wise data on investment plus credit plus RIDF deposit ratio are now being compiled and disseminated (Appendix I V. 39).
4.110 Continuing the trend witnessed during 2007-08, the all-India C-D ratio declined further to 72.6 per cent at the end-March 2009, reflecting some deceleration in the overall credit growth. The C-D ratio (as per sanction) as well as investment plus credit to deposit ratio of the Southern region was the highest among all the regions, followed by the Western region. The same trend is witnessed in investment plus credit deposit ratio as well as investment plus credit plus RIDF deposit ratio (Chart IV.22).
 Foreign Banks’ Operations in India
4.111 As at end-June 2009, 32 foreign banks were operating in India with 293 branches as compared with 30 foreign banks with 279 branches as at end-June 2008. These banks originated from 23 different countries. In addition, 43 foreign banks operated in India through representative offices. During the period from July 2008 to June 2009, permission has been granted to the four existing foreign banks to open 12 branches and to three new foreign banks, (viz., CIMB Bank Berhad, Malaysia, Commonwealth Bank of Australia and FirstRand Bank Ltd.) to open one maiden branch each in India. During the same period, permission was granted to three foreign banks (viz., Kfw-IPEX Bank GmbH, Toronto Dominion Bank and Duncan Lawrie Ltd.) to open a representative office each in India. Three foreign banks viz., DBS Bank Ltd., Deutsche Bank AG and FirstRand Bank Ltd. together set up 12 branches during July 2008 to June 2009. Besides, two foreign banks, viz., DnB NOR Bank and KfW IPEX Bank GmbH opened a representative office each in India during the same period.
Indian Banks’ Operations Abroad
4.112 Indian banks continued to expand their
presence overseas. Even though Bank of
Baroda continued to have largest overseas
presence, State Bank of India also increased
its operations overseas significantly during the
year to narrow the gap (Table IV.48). During
the year 2008-09, the total assets of the
overseas branches increased by USD 6,570
million (10.9 per cent), and stood at USD
67,129 million as on March 31, 2009. The
growth in assets was mainly contributed by net
increase in customer credit by USD 5,988
million during the year. The asset growth had
been largely funded by inter-branch borrowings
and customer deposits, which had gone up by
USD 2,906 million (121.8 per cent) and USD
2,107.44 million (10.4 per cent) and stood at
USD 5,293 million and USD 2,2376 million
respectively as on March 31, 2009.
9. Customer Service and Financial Inclusion
4.113 Banking Ombudsman (BO) offices
receive the complaints from general public
relating to their grievances against commercial
banks, regional rural banks and scheduled
primary co-operative banks. Complainants have
the facility to send the complaints by email,
online or by post. These complaints are tracked
by BO offices by means of a complaint tracking
software. During 2008-09, 69,117 complaints
were received by 15 BO offices as against 47,887
complaints received during the previous year.
Maximum number of complaints related to
credit cards, followed by complaints relating to
failure to meet commitments made. A significant
number of complaints related to pension
payments (especially in case of public sector
banks) and direct selling agents (especially for
new private sector banks) (Table IV.49 and
Appendix Table IV.40).
Table IV.48: Overseas Operations of Indian Banks |
(Actually Operational) |
Name of the Bank |
Branch |
Subsidiary |
Representative Office |
Joint Venture Bank |
Total |
2007-08 |
2008-09 |
2007-08 |
2008-09 |
2007-08 |
2008-09 |
2007-08 |
2008-09 |
2007-08 |
2008-09 |
1 |
2 |
3 |
4 |
5 |
6 |
7 |
8 |
9 |
10 |
11 |
I. |
Public Sector Banks |
121 |
130 |
19 |
18 |
28 |
34 |
7 |
7 |
175 |
189 |
| |
1 |
Allahabad Bank |
1 |
1 |
- |
- |
1 |
1 |
- |
- |
2 |
2 |
| |
2 |
Andhra Bank |
- |
- |
- |
- |
1 |
2 |
- |
- |
1 |
2 |
| |
3 |
Bank of Baroda |
45 |
46 |
8 |
8 |
4 |
3 |
1 |
1 |
58 |
58 |
| |
4 |
Bank of India |
23 |
24 |
3 |
3 |
4 |
5 |
1 |
1 |
31 |
33 |
| |
5 |
Canara Bank |
2 |
3 |
- |
- |
1 |
- |
- |
- |
3 |
3 |
| |
6 |
Indian Bank |
3 |
3 |
- |
- |
- |
- |
- |
- |
3 |
3 |
| |
7 |
Corporation Bank |
- |
- |
- |
- |
- |
2 |
- |
- |
- |
2 |
| |
8 |
Indian Overseas Bank |
6 |
6 |
1 |
1 |
3 |
3 |
- |
- |
10 |
10 |
| |
9 |
Punjab National Bank |
2 |
3 |
1 |
1 |
3 |
4 |
1 |
1 |
7 |
9 |
| |
10 |
State Bank of India |
33 |
38 |
6 |
5 |
7 |
8 |
4 |
4 |
50 |
55 |
| |
11 |
Syndicate Bank |
1 |
1 |
- |
- |
- |
- |
- |
- |
1 |
1 |
| |
12 |
UCO Bank |
4 |
4 |
- |
- |
2 |
2 |
- |
- |
6 |
6 |
| |
13 |
Union Bank |
1 |
1 |
- |
- |
2 |
3 |
- |
- |
3 |
4 |
| |
14 |
Oriental Bank of Commerce |
- |
- |
- |
- |
- |
1 |
- |
- |
- |
1 |
II. |
New Private Sector Banks |
10 |
11 |
3 |
3 |
15 |
16 |
- |
- |
28 |
30 |
| |
14 |
Axis Bank |
3 |
3 |
- |
- |
2 |
2 |
- |
- |
5 |
5 |
| |
15 |
HDFC Bank Ltd. |
- |
1 |
- |
- |
2 |
2 |
- |
- |
2 |
3 |
| |
16 |
ICICI Bank Ltd. |
7 |
7 |
3 |
3 |
8 |
8 |
- |
- |
18 |
18 |
| |
17 |
IndusInd Bank Ltd. |
- |
- |
- |
- |
2 |
2 |
- |
- |
2 |
2 |
| |
18 |
Federal Bank Ltd. |
- |
- |
- |
- |
1 |
1 |
- |
- |
1 |
1 |
| |
19 |
Kotak Mahindra Bank Ltd. |
- |
- |
- |
- |
- |
1 |
- |
- |
- |
1 |
Total |
131 |
141 |
22 |
21 |
43 |
50 |
7 |
7 |
203 |
219 |
–: Nil
Note: Data relate to end-June. |
4.114 BO offices at New Delhi, Chennai, and Mumbai together accounted for 44.1 per cent of the total complaints received during 2008-09 as compared to 36.3 per cent during the previous year (Table IV.50).
4.115
In terms of the BO Scheme, 2006 (as amended up to May 2007), complainants/banks can appeal to the Appellate Authority (Deputy Governor) against the decisions given by Banking Ombudsman. 269 such appeals were received during 2008-09, as compared to 186 appeals received during the previous year.
‘No-frills’ Accounts
4.116 With a view to providing financial
inclusion, the Reserve Bank advised all banks in November 2005 to make available a basic banking ‘no-frills’ account either with ‘nil’ or low minimum balances as well as charges. The basic idea behind this was that extending banking services to lower income groups would trigger a virtuous cycle whereby access to banking services would enable more equitable distribution of the benefits of high economic growth, resulting in improvement in the level of income of the lower income groups. This will lead to increase in average deposit size in the accounts opened by the lower income groups, thereby making financial inclusion an operationally profitable and sustainable business proposition for banks. The low cost or free of cost account is internationally considered to be helpful in expanding the access of banking services, particularly to the low income groups. Similar types of accounts, though with different names, have also been extended by banks in various other countries with a view to making financial services accessible to the common man either at the behest of banks themselves or the respective Governments10. There has been a significant progress in the number of ‘no frills’ accounts opened by banks in India (Table IV.51).
Table IV.49: Bank-Group-wise Complaints received at Banking Ombudsman Offices – 2008-09 |
Nature of Complaint |
Scheduled
Commercial
Banks
(3+6+9) |
Public Sector Banks (4+5) |
Nationalised Banks |
State
Bank
Group |
Private Sector Banks (7+8) |
Old Private Sector Banks |
New Private Sector Banks |
Foreign Banks |
UCBs/ RRBs/ others |
Total |
1 |
2 |
3 |
4 |
5 |
6 |
7 |
8 |
9 |
10 |
11 |
Total Complaints Received (1 to 10) |
66,823 |
33,141 |
14,974 |
18,167 |
21,982 |
1,177 |
20,805 |
11,700 |
2,294 |
69,117 |
1) |
Deposit Accounts |
6,550 |
3,353 |
1,941 |
1,412 |
2,470 |
126 |
2,344 |
727 |
156 |
6,706 |
2) |
Remittances |
5,210 |
3,523 |
1,722 |
1,801 |
1,386 |
94 |
1,292 |
301 |
125 |
5,335 |
3) |
Credit Cards |
17,603 |
5,916 |
1,220 |
4,596 |
5,950 |
73 |
5,877 |
5,737 |
45 |
17,648 |
4) |
Loans/Advances (a+b) |
7,863 |
4,201 |
2,536 |
1,665 |
2,666 |
204 |
2,462 |
996 |
311 |
8,174 |
| |
a) General |
7,040 |
3,867 |
2,333 |
1,534 |
2,291 |
191 |
2,100 |
882 |
291 |
7,331 |
| |
b) Housing Loans |
823 |
334 |
203 |
131 |
375 |
13 |
362 |
114 |
20 |
843 |
5) |
Charges without Prior Notice |
4,740 |
1,898 |
898 |
1,000 |
2,080 |
132 |
1,948 |
762 |
54 |
4,794 |
6) |
Pension |
2,907 |
2,862 |
842 |
2,020 |
33 |
6 |
27 |
12 |
9 |
2,916 |
7) |
Failure on Commitments Made |
11,446 |
6,560 |
3,434 |
3,126 |
3,736 |
326 |
3,410 |
1,150 |
378 |
11,824 |
8) |
Direct Selling Agents |
2,954 |
1,410 |
780 |
630 |
1,016 |
58 |
958 |
528 |
64 |
3,018 |
9) |
Notes and Coins |
110 |
64 |
34 |
30 |
35 |
4 |
31 |
11 |
3 |
113 |
10) |
Others |
7,440 |
3,354 |
1,567 |
1,787 |
2,610 |
154 |
2,456 |
1,476 |
1,149 |
8,589 |
Table IV.50: Region-wise Complaints received at Banking Ombudsman Offices |
Sr. No.
|
Office
|
No. of Complaints received |
2007-08 |
2008-09 |
1 |
2 |
3 |
4 |
1 |
Ahmedabad |
2,855 |
3,732 |
2 |
Bangalore |
2,975 |
3,255 |
3 |
Bhopal |
3,402 |
3,375 |
4 |
Bhubaneswar |
998 |
1,159 |
5 |
Chandigarh |
2,331 |
2,634 |
6 |
Chennai |
4,545 |
10,381 |
7 |
Guwahati |
282 |
455 |
8 |
Hyderabad |
2,843 |
3,961 |
9 |
Jaipur |
3,369 |
3,688 |
10 |
Kanpur |
5,340 |
7,776 |
11 |
Kolkata |
2,815 |
3,671 |
12 |
Mumbai |
6,070 |
9,631 |
13 |
New Delhi |
6,742 |
10,473 |
14 |
Patna |
1,480 |
2,110 |
15 |
Thiruvananthapuram |
1,840 |
2,816 |
Total |
47,887 |
69,117 |
Table IV.51: Number of No-frills Accounts Opened by SCBs |
Bank Group |
End-March 2007 |
End-March 2008 |
End-March 2009 |
1 |
2 |
3 |
4 |
Public Sector Banks |
5,865,419 |
13,909,935 |
29,859,178 |
Private Sector Banks |
860,997 |
1,845,869 |
3,124,101 |
Foreign Banks |
5,919 |
33,115 |
41,482 |
Total |
6,732,335 |
15,788,919 |
33,024,761 |
Note: Data are provisional. |
10. Micro Finance
4.117 Micro finance is the provision of thrift,
credit and other financial services and products
of very small amount to the poor in rural, semi-
urban and urban areas for enabling them to raise
their income levels and improve their living
standards. The beginning of the micro finance
movement in India could be traced to the self-
help group (SHGs) - bank linkage programme
(SBLP) started as a pilot project in 1992 by
National Bank for Agricultural and Rural
Development (NABARD). This programme not
only proved to be very successful but has also
emerged as the most popular model of micro
finance in India. Other approaches like
microfinance delivery through micro finance
institutions (MFIs) also emerged subsequently in
the country. The MFIs in India are characterised
by diverse institutional and legal forms.
Recognising the potential of micro finance to
positively influence the development of the poor,
the Reserve Bank, NABARD and SIDBI have taken
several initiatives over the years to give a further
fillip to the micro finance movement in India.
SHG-Bank Linkage Programme (SBLP) Approach
4.118 An SHG is a small homogenous affinity
group of about 15 to 20 people who join together to address common issues. Voluntary thrift activities are undertaken on a regular basis by the group and these pooled savings are used to make interest bearing loans to the group members. Apart from inculcating the habit of thrift, the SHG activity also imbibes concepts like financial intermediation and handling of resources. Once the group is stabilised, it gets linked to the banks and avails financial services from banks.
4.119
The SBLP has made considerable progress since its inception in the early 1990s, both in terms of the number of SHGs credit linked with banks, as also the bank loans disbursed to SHGs. As per the trend witnessed so far, the commercial banks continued to be the leaders in disbursing loans to SHGs, followed by RRBs and co-operative banks in 2008-09 as well (Table IV.52).
4.120
Under the SBLP, as on March 31, 2009, 4.2 million SHGs had outstanding bank loans of Rs.22,680 crore. The share of commercial banks in total outstanding loans increased from 68 per cent to 71 per cent, with a corresponding decline in the share of regional rural banks and co-operative banks (Table IV.53).
4.121
As on March 31, 2009, the number of SHGs maintaining savings bank accounts with the banking sector was 6.1 million with outstanding savings of Rs.5,546 crore. Though commercial banks continued to have the maximum share of the SHG’s savings, their share declined from 55 per cent as at end March 2008 to 50 per cent as at end-March 2009. While the share of co-operative banks remained almost same, that of RRBs rose from 31 per cent to 36 per cent during the same period (Table IV.54).
Table IV.52: Agency-wise SHG-Bank Linkage Programme
(as at end-March) |
(Amount in Rs. crore) |
Agency
|
No. of SHGs (in ‘000) |
Bank Loan Disbursed |
2007-08 |
2008-09 |
2007-08 |
2008-09 |
Total |
Of which
under SGSY* |
Total |
Of which
under SGSY* |
Total |
Of which
under SGSY* |
Total |
Of which
under SGSY* |
1 |
2 |
3 |
4 |
5 |
6 |
7 |
8 |
9 |
Commercial Banks |
735 |
161 |
1,005 |
133 |
5,404 |
1,104 |
8,061 |
1,102 |
Regional Rural Banks |
328 |
65 |
406 |
82 |
2,652 |
598 |
3,193 |
655 |
Co-operative Banks |
165 |
21 |
199 |
50 |
794 |
156 |
999 |
258 |
Total |
1,228 |
247 |
1,610 |
265 |
8,849 |
1,858 |
12,254 |
2,015 |
* : Inclusive of ‘Swarnjayanti Gram Swarozgar Yojna’ (SGSY) and other sponsored schemes.
Note: Totals may not add up due to rounding off.
Source: NABARD. |
Table IV.53: Bank Loans Outstanding under SBLP
(as at end-March) |
(Amount in Rs. crore) |
Agency
|
No. of SHGs (in ‘000) |
Outstanding Loans |
2007-08
|
2008-09
|
2007-08
|
2008-09
|
Total |
Of which
under SGSY* |
Total |
Of which
under SGSY* |
Total |
Of which
under SGSY* |
Total |
Of which
under SGSY* |
1 |
2 |
3 |
4 |
5 |
6 |
7 |
8 |
9 |
Commercial Banks |
2,378 |
638 |
2,831 |
645 |
11,475 |
3,226 |
16,149 |
3,961 |
Regional Rural Banks |
876 |
223 |
978 |
259 |
4,421 |
1,332 |
5,224 |
1,508 |
Co-operative Banks |
371 |
55 |
415 |
73 |
1,103 |
259 |
1,306 |
392 |
Total |
3,626 |
917 |
4,224 |
977 |
17,000 |
4,817 |
22,680 |
5,862 |
* : Inclusive of ‘Swarnjayanti Gram Swarozgar Yojna’ (SGSY) and other sponsored schemes.
Note: Totals may not add up due to rounding off.
Source: NABARD. |
4.122 The recovery performance of bank loans to SHGs remained at a higher level with recovery rate of 80-94 per cent being the modal class, in case of all the bank groups except the private sector banks. In case of private sector banks, 95 per cent and above was the modal class (Table I V. 55).
MFI Approach
4.123 The emerging role of MFIs as institutions other than banks engaged in providing financial services to the poor is being recognised and the banking sector has been extending loans to MFIs for on-lending to SHGs. During the year 2008-09, bank loan amounting Rs.3,732 crore was disbursed to 581 MFIs, taking the total loans outstanding to Rs.5,009 crore to 1915 MFIs as on March 31, 2009 (Table IV.56).
Table IV.54: Savings of SHGs with Banks
(as at end-March) |
(Amount in Rs. crore) |
Agency
|
No. of SHGs (in ‘000) |
Savings of SHGs |
2007-08 |
2008-09 |
2007-08 |
2008-09 |
Total |
Of which
under SGSY* |
Total |
Of which
under SGSY* |
Total |
Of which
under SGSY* |
Total |
Of which
under SGSY* |
1 |
2 |
3 |
4 |
5 |
6 |
7 |
8 |
9 |
Commercial Banks |
2,811 |
766 |
3,550 |
931 |
2,078 |
527 |
2,773 |
682 |
Regional Rural Banks |
1,387 |
357 |
1,629 |
434 |
1,166 |
211 |
1,990 |
775 |
Co-operative Banks |
812 |
80 |
943 |
140 |
541 |
72 |
783 |
107 |
Total |
5,010 |
1,203 |
6,121 |
1,506 |
3,785 |
810 |
5,546 |
1,563 |
* : Inclusive of ‘Swarnjayanti Gram Swarozgar Yojna’ (SGSY) and other sponsored schemes.
Note: Totals may not add up due to rounding off.
Source: NABARD. |
Table IV.55: Recovery Performance of Bank loans to SHG - Agency-wise
(As at end-March 2009) |
(No of banks) |
Category of Bank |
Total no. of
reporting
banks |
Recovery Performance of Bank Loans to SHG |
95 per cent and above |
80-94
per cent |
50-79
per cent |
less than 50 per cent |
1 |
2 |
3 |
4 |
5 |
6 |
Public Sector Banks |
25 |
6 |
12 |
7 |
0 |
| |
|
(24.0 ) |
(48.0) |
(28.0) |
(0.0) |
Private Sector Bank |
7 |
5 |
1 |
0 |
1 |
| |
|
(71.4) |
(14.3) |
(0.0) |
(14.3) |
Regional Rural Banks (RRBs) |
65 |
12 |
31 |
15 |
7 |
| |
|
(18.5) |
(47.7) |
(23.1) |
(10.8) |
Cooperative Banks |
170 |
56 |
58 |
37 |
19 |
| |
|
(32.9) |
(34.1) |
(21.8) |
(11.2) |
Total |
267 |
79 |
102 |
59 |
27 |
| |
|
(29.6) |
(38.2) |
(22.1) |
(10.1) |
Note: Figures in brackets indicate percentage shares in agency-wise totals.
Source: NABARD. |
4.124 The microfinance movement has been playing a crucial role in the financial inclusion efforts in the Indian context. Against the backdrop of current global financial crisis however, concerns have been raised internationally about possibilities of surge in non-performing loans, shortage of liquidity and funding, declining profitability and weakness in management and corporate governance11.
Table IV.56: Bank Loans Provided to MFIs
(as at end-March) |
(Amount in Rs. crore |
Category of Bank |
Loans disbursed
by to Banks
MFIs |
Outstanding Bank
Loans against
MFIs |
2007-08 |
2008-09 |
2007-08 |
2008-09 |
1 |
2 |
3 |
4 |
5 |
Commercial Banks |
1,969 |
3,719 |
2,745 |
4,978 |
| |
(497) |
(522) |
(1,072) |
(1,762) |
Regional Rural Banks |
2 |
13 |
4 |
31 |
| |
(8) |
(59) |
(24) |
(153) |
Co-operative Banks |
0.04 |
- |
0.02 |
- |
| |
(13) |
(0) |
(13) |
(0) |
Total |
1,970 |
3,732 |
2,749 |
5,009 |
| |
(518) |
(581) |
(1,109) |
(1,915) |
– : nil/ negligible.
Note: 1. Figures in parentheses represent the number of MFIs.
2. The actual number of FIs would be less as some FIs have availed loans from more than one bank. |
11. Regional Rural Banks
4.125 The origin of the Regional Rural Banks
in India can be traced back to the promulgation
of RRB Act of 1976. The idea behind creation
of this new set of regionally oriented rural
banks, was to combine the local feel and
familiarity of rural problems characteristic of
cooperatives with the professionalism and large
resource base of commercial banks. The RRBs
equity is held by the Central Government,
concerned State Government and the Sponsor
Bank in the proportion of 50:15:35.
4.126 In a multi-agency approach for
agricultural and rural credit in India, RRBs have a special place. Being local level institutions, RRBs are ideally suited for achieving financial inclusion. RRBs, together with commercial and co-operative banks, have a critical role in the multi-agency approach to delivery of agriculture and rural credit. After the concerns expressed by Narasimhan Committee (1991) about the poor financial health of RRBs in India, a number of policy initiatives were taken by the Reserve Bank and NABARD to improve their performance.
4.127
Khankhoje and Sathye (2008)12 calculated the production efficiency score of regional rural banks in India for the years 1990 to 2002. The scores were calculated using the non-parametric technique of Data Envelopment Analysis. As major restructuring of these banks occurred in the year 1993-94, the mean efficiency scores of pre-restructuring and post restructuring years were compared using ANOVA to test whether restructuring has resulted in improving efficiency of these banks. The study shows that the mean efficiency score of RRBs has shown a significant increase. This study recommends that the existing policy of bringing down non-performing assets as well as curtailing the establishment expenditure through voluntary retirement scheme for bank staff and rationalisation of rural branches are steps in the right direction that could help these banks in improving efficiency further over a period of time.
4.128
The Advisory Committee on Flow of Credit to Agriculture and Related Activities (Chairman : Prof V S Vyas) in June 2004 recommended restructuring of RRBs in order to improve the operational viability of RRBs and take advantage of the economies of scale. Following this, an Internal Working Group on RRBs was set up by the Reserve Bank to examine various alternatives available within the existing legal framework for strengthening the RRBs. In order to reposition RRBs as an effective instrument of credit delivery in the Indian financial system, the Government of India, after consultation with NABARD, the concerned State Governments and the sponsor banks initiated State-level sponsor bank-wise amalgamation of RRBs from September 2005 to overcome the deficiencies prevailing in RRBs and make them viable and profitable. As at end-March 2009, there were 86 RRBs including 45 amalgamated and 41 stand-alone RRBs.
Recapitalisation of RRBs
4.129 A scheme for phased recapitalisation of
RRBs with negative net worth was announced
in the budget for 2007-08. 27 RRBs having
negative net worth as on March 31, 2007 were
taken up for recapitalisation. The amount
required for recapitalisation aggregated to
Rs.1,796 crore. Of this, the contribution of the
State Governments, sponsor banks and
Government of India were to be Rs.269 crore
(15 per cent), Rs.629 (35 per cent) and Rs.898
crore (50 per cent) respectively. The
recapitalisation process has been completed in
respect of aforesaid 27 RRBs.
Financial Performance of RRBs
4.130 The consolidated balance sheet of RRBs
showed an increase in size of 16.5 per cent during
2008-09 as compared to 16.8 per cent in 2007-08.
On the assets side, net advances of RRBs
increased by 19.9 per cent during the period.
Among the major items on the liabilities side,
deposits and borrowings increased by 19.1 and
1.7 per cent respectively during the year. Credit-
deposit ratio of RRBs declined marginally to
58.5 per cent as at end-March 2009 from 59.5
per cent last year (Table IV.57).
Table IV.57: Regional Rural Banks: Consolidated Balance Sheet |
(Amount in Rs. crore) |
Item |
March 31, 2008 |
March 31, 2009P |
Percentage Variation |
1 |
2 |
3 |
4 |
Liabilities |
1,25,194 |
1,45,824 |
16.5 |
Share Capital |
196 |
197 |
0.5 |
Reserves |
5,703 |
5,914 |
3.7 |
Share Capital Deposits |
2,833 |
3,946 |
29.3 |
Deposits |
99093 |
117984 |
19.1 |
Current |
5716 |
6204 |
8.5 |
Savings |
53371 |
66920 |
25.4 |
Term |
40006 |
44860 |
12.1 |
Borrowings |
11494 |
11686 |
1.7 |
NABARD |
7992 |
8191 |
2.5 |
Sponsor Bank |
3078 |
3228 |
4.9 |
Others |
424 |
267 |
-37.0 |
Other Liabilities |
5875 |
6097 |
3.8 |
Assets |
125194 |
145824 |
16.5 |
Cash in Hand |
1404 |
1502 |
7.0 |
Balances with RBI |
7164 |
10317 |
44.0 |
Other Bank Balances |
22338 |
23361 |
4.6 |
Other Investments |
30166 |
34168 |
13.3 |
Loans and Advances (net) |
57568 |
69030 |
19.9 |
Fixed Assets |
241 |
292 |
21.2 |
Other Assets# |
6313 |
7154 |
13.3 |
Memorandum Items: |
|
|
|
a. Credit-Deposit Ratio |
59.5 |
58.5 |
|
b. Investment-Deposit Ratio |
49.0 |
48.8 |
|
c. (Credit+Investment)-Deposit Ratio |
108.5 |
107.2 |
|
P : Provisional. – : Nil/Negligible. # : Includes accumulated loss.
Source: NABARD. |
4.131 As per the provisional data available so far, during 2008-09, 86 RRBs extended new loans to the extent of Rs.41,273 crore to 9.4 million borrowers as against Rs.38,464 crore during 2007-08 to 9.3 million borrowers. Of this, the share of priority sector loans issued was 82.6 per cent. In terms of number of borrowers’ coverage, the share of priority sector was about 84 per cent to total loans issued during 2008-09. As at end-March 2009, the outstanding advances of RRBs were Rs.69,030 crore and the share of priority sector was 83.3 percent. The share of agricultural loans declined marginally to 52.8 percent as at the end of March 2009 from 56.3 per cent a year ago (Table IV.58).
4.132
Following the amalgamation of RRBs, the number of profit making RRBs increased to 80
and loss making RRBs declined to 6 as at end-March 2009 from 82 and 8 respectively at end March 2008.
Table IV.58: Purpose-wise Outstanding Advances by RRBs |
(Amount in Rs. crore) |
Purpose/End-March |
2007 |
2008 |
2009P |
1 |
2 |
3 |
4 |
I. |
Agriculture (i to iii) |
27,452 |
33,216 |
36,466 |
| |
Per cent to total loans outstanding |
56.6 |
56.3 |
52.8 |
| |
i. |
Short-term loans (crop loans) |
18,707 |
22,748 |
24,986 |
| |
ii. |
Term loans (for agriculture and
allied activities) |
3,745 |
10,468 |
11,480 |
| |
iii. |
Indirect Advances |
- |
- |
- |
II. |
Non-agriculture (iv to vii) |
21,041 |
25,768 |
32,564 |
| |
Per cent to total loans outstanding |
43.4 |
43.9 |
41.2 |
| |
iv. |
Rural Artisans, etc. |
736 |
671 |
820 |
| |
v. |
Other Industries |
880 |
1,227 |
1,400 |
| |
vi. |
Retail Trade, etc. |
3,677 |
4,531 |
5,015 |
| |
vii. |
Other purposes |
15,748 |
19,339 |
25,329 |
Total (I+II) |
48,493 |
58,984 |
69,030 |
Memo item: |
|
|
|
a) |
Priority Sector |
39,852 |
48,894 |
57,528 |
b) |
Non-priority Sector |
8,641 |
10,090 |
11,502 |
c) |
Share of Priority Sector (Per cent to Total) |
82.2 |
82.9 |
83.3 |
P : Provisional. – : Nil/Negligible.
Source: NABARD. |
4.133 The growth rate of aggregate income of RRBs decelerated to 19.5 per cent as at end-March 2009 from 20.0 per cent last year. This deceleration was mainly on account of slowdown in ‘other income’. The expenditure of RRBs, however, rose sharply mainly on account of increase in interest expended and rise in provision and contingencies. Out of 86 RRBs, 80 RRBs earned profit amounting to Rs.1,405 crore, whereas 6 RRBs incurred loss amounting to Rs.36 crore for the year 2008-09. Thus, RRBs together earned net profits of Rs.1,369 crore during the year 2008-09 as compared to Rs.1,027 crore during the previous year. The improvement in the performance of RRBs is also reflected in the decline of NPAs (both gross and net) during 2008-09. While gross NPAs to total loan assets ratio declined to 4.2 per cent as at the end of March 2009 from 6.1 per cent a year ago, the net NPAs to loan assets ratio declined to 1.8 per cent from 3.4 per cent for the same period (Table IV.59).
Table IV.59: Financial Performance of Regional Rural Banks |
(Amount in Rs. crore) |
Particulars
|
2007-08 |
2008-09(P) |
Variation |
Loss
Making
[8] |
Profit
Making
[82] |
Total
RRBs
[90] |
Loss
Making
[6] |
Profit
Making
[80] |
Total
RRBs
[86] |
Col. (7) over Col. (4) |
Amount |
Per cent |
1 |
2 |
3 |
4 |
5 |
6 |
7 |
8 |
9 |
A. |
Income (i+ii) |
286 |
9,120 |
9,406 |
276 |
10,975 |
11,251 |
1,831 |
19.5 |
| |
i) |
Interest income |
271 |
8,468 |
8,739 |
262 |
10,181 |
10,443 |
1,690 |
19.3 |
| |
ii) |
Other income |
15 |
652 |
667 |
14 |
794 |
808 |
141 |
21.1 |
B. |
Expenditure (i+ii+iii) |
342 |
8,037 |
8,379 |
312 |
9,570 |
9,882 |
1,503 |
17.9 |
| |
i) |
Interest expended |
212 |
4,545 |
4,757 |
200 |
5,517 |
5,717 |
960 |
20.2 |
| |
ii) |
Provisions and contingencies |
13 |
819 |
832 |
12 |
1,246 |
1,258 |
426 |
51.2 |
| |
iii) |
Operating expenses |
117 |
2,673 |
2,790 |
100 |
2,807 |
2,907 |
117 |
4.2 |
| |
|
of which : Wage Bill |
100 |
1,954 |
2,054 |
85 |
2,018 |
2,103 |
49 |
2.4 |
C. |
Profit |
|
|
|
|
|
|
|
|
| |
i) |
Operating Profit/Loss |
-43 |
1,902 |
1,859 |
-24 |
2,651 |
2,627 |
768 |
41.3 |
| |
ii) |
Net Profit/Loss |
-56 |
1,083 |
1,027 |
-36 |
1,405 |
1,369 |
342 |
33.3 |
D. |
Total Assets |
4,548 |
1,20,646 |
1,25,194 |
3,250 |
1,42,574 |
1,45,824 |
20,630 |
16.5 |
E. |
Financial Ratios @ |
|
|
|
|
|
|
|
|
| |
i) |
Operating Profit |
-1.0 |
1.6 |
1.5 |
-0.7 |
1.8 |
1.8 |
- |
- |
| |
ii) |
Net Profit |
-1.2 |
1.0 |
0.9 |
-1.1 |
1.0 |
0.9 |
- |
- |
| |
iii) |
Income |
6.3 |
7.6 |
7.5 |
8.5 |
7.6 |
7.7 |
- |
- |
| |
|
a) Interest income |
6.0 |
7.0 |
7.0 |
8.1 |
7.1 |
7.2 |
- |
- |
| |
|
b) Other Income |
0.3 |
0.5 |
0.5 |
0.4 |
0.6 |
0.6 |
- |
- |
| |
iv) |
Expenditure |
7.5 |
6.7 |
6.7 |
9.7 |
6.7 |
6.8 |
- |
- |
| |
|
a) Interest expended |
4.7 |
3.8 |
3.8 |
6.2 |
3.8 |
3.9 |
- |
- |
| |
|
b) Operating expenses |
2.6 |
2.2 |
2.2 |
3.1 |
2.0 |
2.0 |
- |
- |
| |
|
of which: Wage Bill |
2.2 |
1.6 |
1.6 |
2.6 |
1.4 |
1.4 |
- |
- |
| |
v) |
Provisions and contingencies |
0.3 |
0.7 |
0.7 |
0.4 |
0.9 |
0.9 |
- |
- |
| |
vi) |
Gross NPAs |
|
|
6.1 |
|
|
4.2 |
- |
- |
| |
vii) |
Net NPAs |
|
|
3.4 |
|
|
1.8 |
- |
- |
P : Provisional. @ : Ratios to total assets. * : Before tax. Note: Figures in brackets represent number of RRBs.
Source: NABARD. |
4.134 In line with the trend witnessed during last few years, productivity of RRBs, both in terms of per branch and per employee, showed further improvement during 2008-09. While accumulated loss as percentage to assets remained at previous year’s level, financial return and net margins improved during 2008-09 (Table IV.60).
12. Local Area Banks
4.135 The Local Area Bank Scheme was introduced in August 1996 pursuant to the announcement made in the Union Budget of that year. The idea behind setting up of new private local banks with jurisdiction over two or three contiguous districts was to help the mobilisation of rural savings by local institutions and make them available for investments in the local areas. The Local Area Banks (LABs) were expected to bridge the gaps in credit availability and strengthen the institutional credit framework in the rural and semi-urban areas. Following this, guidelines for setting up of LABs in the private sector were announced by the Reserve Bank of India (RBI) in August 1996. There were four local area banks (LABs) in the country at end-March 2009.
Table IV.60: Business and Financial Indicators of RRBs |
Indicator |
2002-03 |
2003-04 |
2004-05 |
2005-06 |
2006-07 |
2007-08 |
2008-09 P |
1 |
2 |
3 |
4 |
5 |
6 |
7 |
8 |
No. of RRBs |
196 |
196 |
196 |
133 # |
96 # |
90 # |
86 # |
Net profit 1 (Rs crore) |
519 |
769 |
748 |
617 |
596 |
1328 |
1830 |
Per Branch Productivity 2 (Rs. crore) |
5.0 |
5.7 |
6.6 |
7.7 |
9.1 |
10.7 |
12.4 |
Per Employee Productivity 3 (Rs. crore) |
1.0 |
1.2 |
1.4 |
1.6 |
1.9 |
2.3 |
2.7 |
Accumulated loss as percentage to assets |
4.4 |
3.9 |
3.5 |
2.9 |
2.6 |
2.1 |
2.1 |
Salary as percentage to Assets |
2.3 |
2.6 |
2.0 |
2.1 |
1.9 |
1.9 |
1.8 |
Financial Return 4 (per cent) |
9.6 |
8.9 |
8.2 |
7.7 |
7.7 |
8.1 |
8.2 |
Financial Cost 5 (per cent) |
6.1 |
5.4 |
4.6 |
4.1 |
4.1 |
4.4 |
4.5 |
Financial margin 6 (per cent) |
3.5 |
3.5 |
3.6 |
3.6 |
3.6 |
3.7 |
3.7 |
Risk, operational and other cost (per cent) |
2.6 |
2.2 |
2.3 |
2.8 |
2.9 |
2.7 |
2.6 |
Net margin7(per cent) |
0.9 |
1.3 |
1.3 |
0.8 |
0.7 |
1.0 |
1.1 |
#: Reduction in number of RRBs was due to amalgamation, which began in September 2005. Financial performance analysis relates to
90 RRBs (excluding the new RRB).
Data for 2008-09 are provisional
Note: 1. Net profit i.e. difference between the gross profit (before tax) and losses incurred by RRBs.
2.Average level of business (in terms of total deposits and gross advances) per branch during the reporting year.
3.Average level of business (in terms of total deposits and gross advances) per employee of RRBs during the year.
4.Percentage of total income from both advances and investments against average working funds during the year.
5.Percentage of total interest expended for deposits, borrowings etc. against average working funds during the year.
6.Difference between the financial return and financial cost.
7.Difference between the financial margin and risk, operational and other costs, plus miscellaneous income.
Source: NABARD. |
4.136 During 2008-09, the growth rate of aggregate assets, deposits and gross advanced of LABs witnessed a deceleration, partly reflecting the overall slowdown in economic activity and increased uncertainty. In particular, aggregate assets increased by 20.3 per cent, deposits by 20.0 per cent and gross advances by 23.8 per cent during 2008-09 as compared with the growth rate of 32.2 per cent, 32.4 per cent and 35.5 per cent, respectively during 2007-08. More or less similar growth rate was observed across all LABs barring Krishna Bhima Samruddhi Local Area Bank Ltd. that showed a significantly higher growth (Table IV.61).
Table IV.61: Profile of Local Area Banks |
(Amount in Rs. crore) |
Bank |
Assets |
Deposits |
Gross Advances |
| |
2008 |
2009 |
2008 |
2009 |
2008 |
2009 |
1 |
2 |
3 |
4 |
5 |
6 |
7 |
Capital Local Area Bank Ltd. |
466 |
549 |
393 |
461 |
243 |
296 |
Coastal Local Area Bank Ltd. |
76 |
100 |
56 |
73 |
43 |
57 |
Krishna Bhima Samruddhi Local Area Bank Ltd. |
81 |
99 |
43 |
56 |
52 |
64 |
Subhadra Local Area Bank Ltd. |
31 |
39 |
22 |
27 |
17 |
23 |
Total |
654 |
787 |
514 |
616 |
355 |
439 |
Source: Based on off-site returns. |
Table IV.62: Financial Performance of Local Area Banks
(As at end-March) |
(Rs. crore) |
Particulars |
|
|
Variation |
2007-08 |
2008-09 |
Absolute |
Percentage |
1 |
2 |
3 |
4 |
5 |
A.Income (i+ii) |
68.2 |
90.6 |
22.5 |
33.0 |
i) |
Interest income |
54.9 |
74.9 |
20.0 |
36.4 |
ii) |
Other income |
13.3 |
15.8 |
2.5 |
18.5 |
B. Expenditure (i+ii+iii) |
58.3 |
76.5 |
18.2 |
31.2 |
i) |
Interest expended |
29.9 |
41.7 |
11.8 |
39.4 |
ii) |
Provisions and contingencies |
6.1 |
7.8 |
1.7 |
27.4 |
iii) |
Operating expenses of which : |
22.3 |
27.0 |
4.7 |
21.2 |
| |
Wage Bill |
9.9 |
12.2 |
2.3 |
23.1 |
C. Profit |
|
|
|
|
i) |
Operating Profit/Loss |
15.6 |
21.9 |
6.3 |
40.5 |
ii) |
Net Profit/Loss |
9.5 |
14.1 |
4.6 |
48.9 |
D. Spread (Net Interest Income) |
25.0 |
33.2 |
8.2 |
32.9 |
E. Total Assets |
653.5 |
786.6 |
133.1 |
20.4 |
F. Financial Ratios@ |
|
|
|
|
i) |
Operating Profit |
2.4 |
2.8 |
|
|
ii) |
Net Profit |
1.5 |
1.8 |
|
|
iii) |
Income |
10.4 |
11.5 |
|
|
iv) |
Interest income |
8.4 |
9.5 |
|
|
v) |
Other Income |
2.0 |
2.0 |
|
|
vi) |
Expenditure |
8.9 |
9.7 |
|
|
vii) |
Interest expended |
4.6 |
5.3 |
|
|
viii) |
Operating expenses |
3.4 |
3.4 |
|
|
ix) |
Wage Bill |
1.5 |
1.5 |
|
|
x) |
Provisions and Contingencies |
0.9 |
1.0 |
|
|
xi) |
Spread (Net Interest Income) |
3.8 |
4.2 |
|
|
Note: @ Ratios to Total Assets.
Source: Based on off-site returns. |
4.137 Similar to the trend mentioned above, the financial performance of LABs also witnessed a slowdown. Thus during 2008-09, all the relevant variables like income, expenditure, profit and total assets increased at a slower pace as compared with 2007-08. Both the growth rate of interest income and non-interest income witnessed a deceleration, though the deceleration in growth of other income was more pronounced. On the expenditure side, growth rate of interest expended, provisions and contingencies as well as that of wage bills decelerated sharply. On balance, notwithstanding this deceleration in growth rate of expenditure, the growth rate of operating profits and that of net profits decelerated sharply. On the positive side, however, the financial ratios of operating profit and net profit increased during 2008-09 as compared with 2007-08 (Table IV.62).
13. Conclusion
4.138 The Indian banking system has exhibited resilience against the backdrop of global financial turmoil and slowdown of the Indian economy. Notwithstanding some slowdown in growth of balance sheet, income and profitability, the overall CRAR has improved and the asset quality remains at a comfortable level. The Indian banking system has thus remained sound and robust. As the commercial banks are the dominant institutions with linkages to other segments of the Indian financial system, the strength of this sector has provided an anchor to the Indian economy in turbulent times. The off-balance sheet exposures of banks, which had seen an exponential growth in recent years, witnessed some slowdown this year. It is however, necessary to constantly monitor and evaluate the risks entailed by such types of exposures of banks, given their systemic implications. SCBs are now fully Basel II complaint; going forward the need to increase public sector banks’ capital has to be assessed and suitable policy measures may be initiated. Further, the banks need to strengthen their corporate governance practices. With the economy showing some signs of recovery after the slowdown, the banking sector needs to gear up to meet the credit needs of the economy. During an uptrend, the banks will have to tread the balance between risk and return carefully.
1 As at end-March 2009, SCBs comprised 27 public sector banks (State Bank of India and its six associates, 19 nationalised banks and the IDBI Bank Ltd.), 7 new private sector banks, 15 old private sector banks and 31foreign banks. For Tamilnad Mercantile Bank Ltd., as of September 30, 2009, only the unaudited balance sheet is available and the same has been used.
2 As at end-March 2008.
3 Including Bank Internasional Indonesia, which ceased operations in India and is being wound up.
4 Leverage ratio generally refers to Tier 1 capital as a per cent of total adjusted assets, wherein adjustments to assets include items
that have already been deducted from Tier 1 capital, such as goodwill. The actual calculation of leverage ratio in most countries,
such as the US, is based on Tier 1 capital to total assets and the same is used here.
5 World Bank (2009), “Banking and the Leverage Ratio”, Background note available at www.crisistalk.worldbank.org.
6 The targets and sub-targets for all banks are now linked to the adjusted net bank credit (ANBC) or credit equivalent amount of off-balance sheet exposures (CEOBSE), whichever is higher.
7 The Reserve Bank had advised public sector banks to prepare Special Agricultural Credit Plans on an annual basis since 1994-95, with a view to achieving distinct and marked improvement in the flow of credit to agriculture. Under SACP, the banks are required to fix self-set targets for achievement during the year (April-March). The targets are generally fixed by the banks showing an increase of about 20-25 per cent over the disbursements made in the previous year.
8 Based on information received under Section 42(2) Returns of the Banking Regulation Act, 1949.
9 Refer to ‘Chapter V: Developments in Co-operative Banking’ for details on RIDF.
10 Reserve Bank of India, (2008): Report on Currency and Finance, 2006-08.
11 Centre for the Study of Financial Innovation (2009): ‘Microfinance Banana Skins: Confronting Crisis and Change’, June. Available on http://www.cgap.org.
12 Khankhoje, D. and Sathye M. (2008), ‘Efficiency of Rural Banks: The Case of India’, International Business Research, Vol. 1, No. 2, April. Available on http://www.ccsenet.org/journal.html
|
 IST,
IST,


