 IST,
IST,


Operation and Performance of Commercial Banks
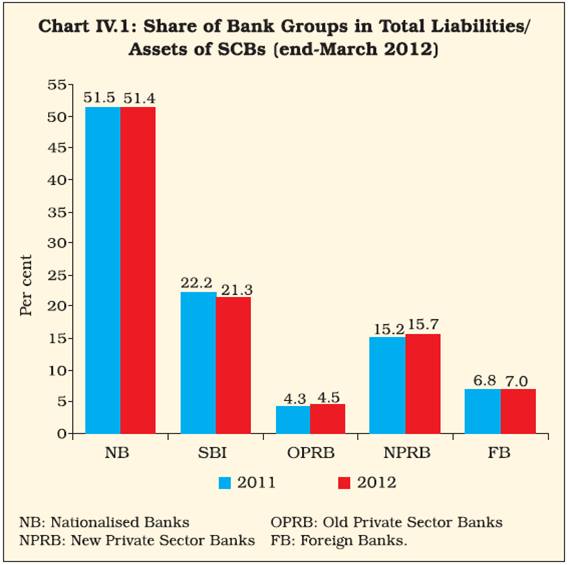
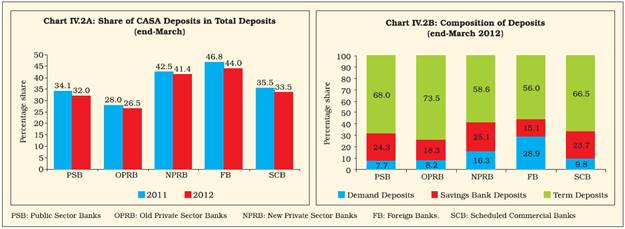
Performance of the Indian banking sector during 2011-12 was influenced by the slowdown in the domestic economy. Consequently, balance sheet expansion of banks was lower than the previous year. Major profitability indicators, i.e., return on assets (RoA) and return on equity (RoE) dipped marginally. However, cost to income ratio of banks improved during 2011-12, reflecting marginal gains in efficiency. Though Indian banks remained well-capitalised, concerns about the growing non-performing assets (NPAs) loomed large. Banks’ exposure to the stressed power and airline sectors particularly added to deterioration in their asset quality. Though progress has been made in expanding banking coverage, more efforts are needed to achieve meaningful financial inclusion. Customer services of banks need to be strengthened to face the emerging challenges. 1. Introduction 4.1 Indian banking sector, which withstood the turmoil of the global financial crisis during 2008-09, started showing some signs of stress during the subsequent period. Performance of Indian banks during the post-crisis period was conditioned to a large extent by fragile recovery of the global financial markets as well as a challenging operational environment on the domestic front, with high inflation and muted growth performance. In addition, stressed financial condition of some State Electricity Boards and airline companies further added to the deterioration in the asset quality of banks. 4.2 Against this backdrop, this chapter analyses the operations and performance of Indian banking sector (including regional rural banks and local area banks) during 2011-12, based on the audited balance sheets of banks and off-site returns submitted to the Reserve Bank. Various sections of this chapter focus on balance sheet operations, profitability and efficiency indicators, soundness position, overseas operations, operations in the capital market, customer services and technological developments. Progress under financial inclusion plans is delineated in a separate section. The concluding section highlights major issues that emerge from the analysis. 2. Balance Sheet Operations of Scheduled Commercial Banks Balance sheet expansion slowed down led by muted growth in deposits as well as loans and advances 4.3 Consolidated balance sheet of SCBs grew at a slower pace during 2011-12 as compared with the previous year. On the liabilities side, the deceleration in growth was broad-based with the major items of liabilities, i.e., capital, deposits and borrowings, registering moderation in growth. On the assets side, the slowdown was mainly attributed to deceleration in growth of loans and advances, reflecting the slowdown in all key segments of domestic macro-economy (Tables IV.1 and IV.2). 4.4 Reflecting the deceleration in the balance sheet of public sector banks, their share in total assets of the banking system dipped marginally during 2011-12. Notwithstanding this, Indian banking sector remained broadly public in nature with public sector banks accounting for more than two-thirds of total assets of all scheduled commercial banks, as at end-March 2012 (Chart IV.1). Major Liabilities of SCBs Deposits grew at a subdued pace 4.5 As at end-March 2012, deposits constituted more than three-fourths of the total liabilities of the banking sector. Deposits grew at a slower rate than the previous year, which mainly emanated from contraction of demand deposits as well as slower growth of savings bank deposits. On the other hand, growth in term deposits accelerated. Going forward, the slowdown in demand and savings banks deposit mobilisation, which are the least cost sources of funds, could put downward pressure on profitability of Indian banks (Table IV.2). Proportion of CASA deposits in total deposits declined 4.6 The share of current and savings account (CASA) deposits in total deposits declined during 2011-12 due to the decline in demand deposits as well as slowdown in savings bank deposit mobilisation. As at end-March 2012, CASA deposits formed almost one-third of total deposits of SCBs. Bank group-wise analysis of composition of deposits revealed that foreign banks had the highest proportion of CASA deposits followed by new private sector banks. This could be partly explained by the fact that number of private sector banks revised their savings bank deposits rates upwards after the deregulation of savings bank interest rate in October 2011 (Chart IV.2). Recourse to borrowings higher during 2011-12 4.7 As at end-March 2012, borrowings constituted almost 10 per cent of the total liabilities of the banking sector, which was marginally higher than the previous year (Table IV.1). Major Assets of SCBs Lower credit off-take led by both demand and supply side factors 4.8 Total loans and advances witnessed moderation in growth compared with the previous year. The deceleration in bank credit was broad-based with credit off-take by all major sectors slowing down during 2011-12. Credit to industry and services sector, which together constituted more than two-thirds of total bank credit, recorded slower growth. Risk aversion by banks was evident from higher investment in government securities 4.9 In contrast with the overall slowdown observed in the major balance sheet items of banks, growth in investments accelerated during 2011-12 compared with the previous year. As against deceleration in credit growth, banks’ investment in government securities increased substantially. This trend partly reflected increase in risk aversion by banks with a growing preference to park funds in safer instruments, against the backdrop of weak macro-economic outlook as well as rising NPAs. Investments in non-SLR instruments declined 4.10 As at end-March 2012, banks’ investments in non-SLR instruments contracted compared with the corresponding period of the previous year, due to decline in investments in shares and mutual funds. The decline in investments in mutual funds could be partly attributed to the policy tightening by the Reserve Bank in order to curb banks’ exposure to liquid/short term debt schemes of mutual funds. However, banks’ investments in commercial papers increased sharply (Table IV.3). International Liabilities and Assets of Scheduled Commercial Banks While growth in total international liabilities moderated, international assets registered higher growth 4.11 During 2011-12, total international liabilities of banks grew at a lower rate compared with the previous year, mainly due to the contraction in other liabilities owing to a decline in ADRs/GDRs issued by the domestic banks. However, inflows through NRE rupee deposits increased which could be due to the increase in interest rate under NRE term deposits following the deregulation of interest rates on both savings deposit and term deposits under NRE accounts (Table IV.4).
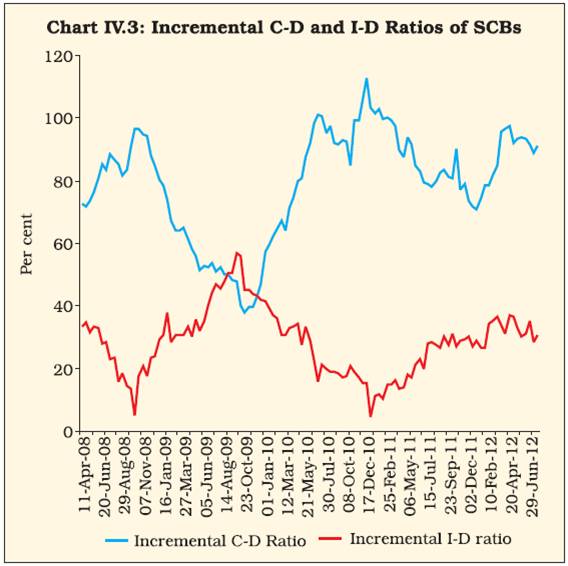
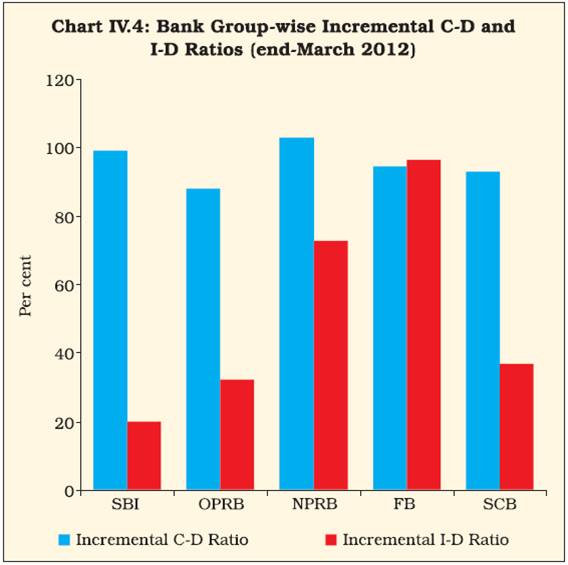
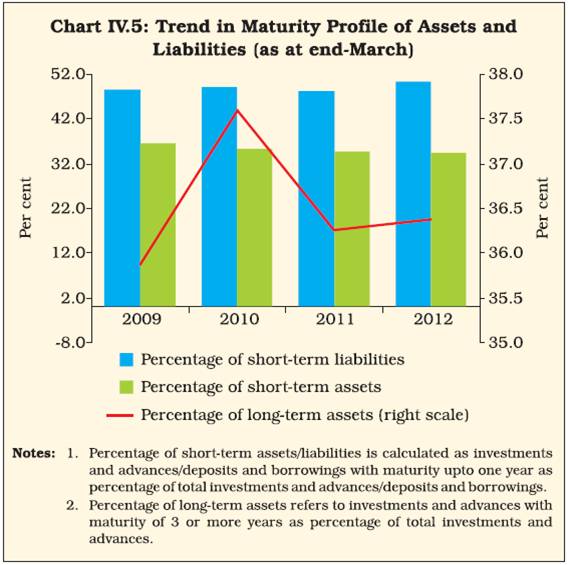
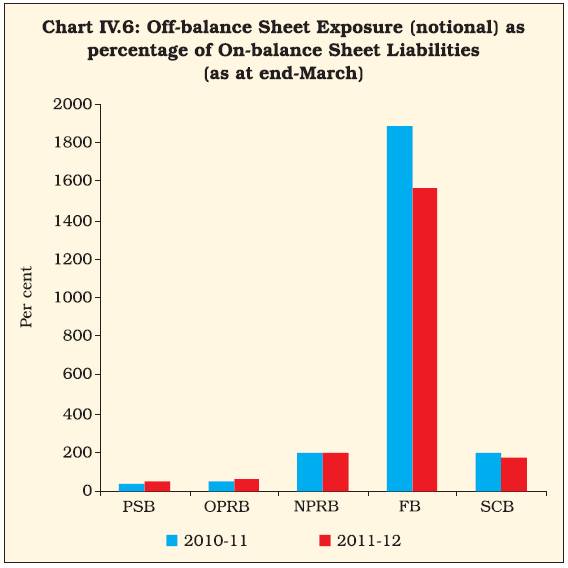
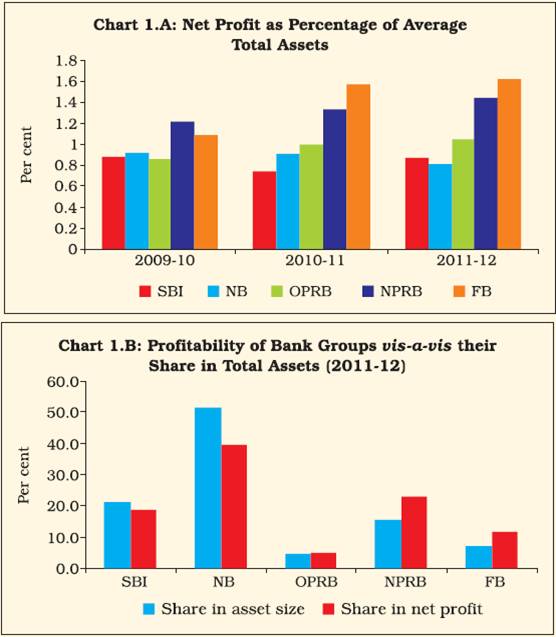
4.12 In contrast, international assets of the banking sector registered higher growth in 2011- 12 compared with the previous year, mainly led by foreign currency loans to residents, and Nostro balances (Table IV.5). Consolidated international claims registered higher growth 4.13 Continuing the trend observed during the previous year, total consolidated international claims registered accelerated growth during 2011- 12. However, no significant change was discernible in the maturity (residual)-wise as well as sector-wise composition of total international claims (Table IV.6). The growth in the consolidated international claims of banks on countries other than India was mainly led by claims of banks on the UAE, Hong Kong, the US, Singapore and the UK (Table IV.7). Credit-Deposit (C-D) and Investment-Deposit (I-D) Ratios Incremental C-D ratio remained well above incremental I-D ratio 4.14 The incremental C-D ratio declined during the first three quarters of 2011-12, partly reflecting the slowdown in bank credit. There was a sharp rise in the ratio during the fourth quarter of 2011-12 as deposits growth decelerated sharply even as growth in credit remained stable. Incremental C-D ratio was highest for new private sector banks while foreign banks recorded the highest incremental investment-deposit (I-D) ratio (Charts IV.3 and IV.4)1. Maturity Profile of Assets and Liabilities Maturity mismatch continued to persist with proportion of short-term liabilities registering an increase 4.15 The persistent mismatch in the average maturity profile of assets with that of liabilities has been a concern for Indian banking sector in recent years. The proportion of short-term liabilities registered an increase from 2008 onwards. On the other hand, the proportion of short-term assets in total assets exhibited a declining trend from 2008 onwards (Chart IV.5 and Table IV.8). Off-Balance Sheet Operations of SCBs Off-balance sheet exposures continued to increase, albeit, at a slower pace 4.16 In recent years, off-balance sheet activities of banks have come under the scrutiny of the Reserve Bank, especially given the fact that the excessive growth in off-balance sheet exposure of banks in advanced economies has been one of the factors behind the global financial turmoil. During 2011-12, total off-balance sheet liabilities (notional) of banks registered lower growth than the previous year. Bank group-wise analysis of off-balance sheet exposure revealed that, off-balance sheet exposure (notional) as percentage of on-balance sheet liabilities was significantly higher for foreign banks as compared with other bank groups, due to their higher exposure in forward contracts, guarantees and acceptance/endorsements (Chart IV.6 and Appendix Table IV.2). 3. Financial Performance of Scheduled Commercial Banks 4.17 Financial performance of banks came under pressure during 2011-12, mainly due to the increased cost of deposits in the backdrop of an elevated interest rate environment. However, on a positive note, the efficiency of banks improved. The two main indicators of profitability, i.e., RoE and RoA declined marginally during 2011-12, reflecting deceleration in the net profit of banks. Profitability Growth in consolidated net profit slowed down due to spurt in interest expenditure 4.18 Despite accelerated growth in total income, the consolidated net profit of the banking sector increased at a slower rate compared with the previous year, mainly due to the steep increase in interest expended. 4.19 Interest expended on deposits accounted for more than three-fourths of the total interest expenditure of banks. This, along with an increase in the proportion of relatively high-cost term deposits, led to an acceleration in the interest cost of banks. In addition, retail deposits became more costly in the backdrop of a high interest rate environment. Net interest margin dipped slightly 4.20 During 2011-12, the net interest margin (NIM) of banks dipped marginally compared with the previous year, mainly reflecting the steep rise in interest expended (Table IV.9). Consequent to the slowdown in net profit, RoA and RoE dipped marginally 4.21 During 2011-12, two major indicators of profitability, RoA and RoE dipped marginally compared with the previous year, mainly reflecting the slowdown in net profit caused by increased interest expenditure (Table IV.10). A more detailed analysis of RoA and RoE of bank groups is provided in Box IV.1. Efficiency Operating efficiency, as captured by cost to income ratio witnessed improvement 4.22 During 2011-12, operating efficiency of banks in terms of cost-to-income ratio2 witnessed an improvement. The other efficiency indicator, NIM, dipped marginally, which implied reduction in cost of financial intermediation (Chart IV.7). Cost/Return on funds Spread of banks narrowed due to increased cost of funds 4.23 During 2011-12, both cost as well as return on funds increased for the banks. However, the spreads narrowed due to the higher increase in cost of funds. At the bank group level, cost of funds was lower in the case of foreign banks, partly because low cost CASA deposits formed a higher proportion of total deposits for foreign banks (Table IV.11 and Chart IV.8). 4. Soundness Indicators 4.24 All scheduled commercial banks in India have become Basel II compliant as per the standardised approach with effect from April 1, 2009. For migrating to advanced approaches of Basel II, the Reserve Bank issued separate set of guidelines and the applications received from banks for migration to advanced approaches of Basel II are at various stages of examination with the Reserve Bank. Parallel to this process, the Reserve Bank came out with the final guidelines for implementation of Basel III in May 2012. The guidelines issued by the Reserve Bank will become effective from January 1, 2013. Against this backdrop, it is important to examine the existing capital position and other soundness indicators of Indian banks in order to assess banks’ preparedness to migrate to the more advanced regulatory approaches. Box IV.1: What Drives the Profitability of Indian Banks?: A Du Pont Analysis for Bank Groups Profitability of banks facilitates many aspects, which includes, inter alia, enhancing the ability of banks to mobilise resources from the capital market, as well as better management of nonperforming assets. In addition, sound profitability of banks enhances their ability to augment the financial inclusion process. During the pre-liberalisation period, banks in India were operating in a rather tight regulatory environment. After liberalisation, Indian banks operated in a less regulated environment in terms of interest rate liberalisation, reduction in reserve requirements, and entry deregulation. In addition, with the advent of complex financial products, banks’ business has expanded in recent years beyond the traditional financial intermediation process. Also, off-balance sheet exposure of banks has witnessed a significant increase in recent years. Against this backdrop, it is important to analyse the main sources of profitability of Indian banks. In recent years, significant variation in profitability has been observed among bank groups. It was observed that, generally profitability of foreign banks was higher than that of other bank groups. Some past studies on profitability of Indian banks concluded that higher profitability of foreign banks could be attributed to their access to low cost CASA deposits, diversification of income as well as higher “other income”. During 2011-12, foreign banks accounted for close to 12 per cent of the total net profit of SCBs. As against this, their share in total assets of Indian banking sector stood at 7 per cent (Charts 1.A and 1.B). In order to understand the sources of profitability across bank groups, RoE analysis and Du Pont analysis have been carried out taking the bank group-wise data for 2011-12. The RoE analysis decomposes the profitability of banks into two components, i.e., profitability of bank assets, as captured by RoA and leverage, captured by the ratio of total average assets to total average equity. Further, decomposition of RoE suggests that banks’ profitability can be associated with higher return from assets or higher leverage or both. There are some studies which focused on the possibility of getting a higher RoE by substitution of equity capital with lower cost long-term debt. While higher return on assets is always considered good, a higher leverage ratio exposes bank to the risk of insolvency.
It follows from the empirical result presented in Table 1.1, that the higher RoE for the SBI group and nationalised banks was associated with a higher leverage ratio, while for new private sector banks, the higher RoE was attributable to higher profitability of assets and lower leverage. Among the bank groups, foreign banks had the highest return from assets as well as the lowest leverage ratio. The capital to assets ratio, as calculated for various bank groups using balance sheet data, further corroborates the findings of RoE analysis. As at end- March 2012, this ratio was highest for foreign banks, indicating their better capital position vis-à-vis other bank groups. Du Pont analysis decomposes profitability of banks into two components, viz., asset utilisation and cost management. Asset utilisation is captured by the total income net of interest expenditure and provisions/contingencies as percentages of average total assets. The ratio of operating expenses to average total assets indicates how efficiently a bank is using its resources and is thus termed as a parameter to understand the efficiency of cost management by banks. Better profit of banks can be attributed to better asset utilisation or better cost management or both simultaneously. Table 1.2 summarises the result of Du Pont analysis carried out on banks, for 2011-12. According to the results of Du Pont analysis, foreign banks registered the highest RoA among bank groups, mainly on account of better asset utilisation, though their operating expenses to assets ratio was also higher when compared to other bank groups. This result corroborates the findings of past literature according to which foreign banks’ higher profitability could be attributed to better fund management practices.
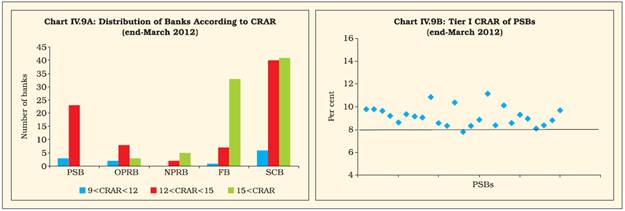
Capital Adequacy CRAR under both Basel I and II remained well above the stipulated norm 4.25 The capital to risk-weighted assets ratio (CRAR) remained well above the stipulated 9 per cent for the system as a whole as well as for all bank groups during 2011-12, indicating that Indian banks remained well-capitalised. Also, the CRAR (Basel II) at the system-level improved marginally compared with the previous year (Table IV.12). Tier I capital constituted more than 70 per cent of capital funds of banks 4.26 The component-wise breakup of capital funds indicated that Tier I capital accounted for more than 70 per cent of the total capital of Indian banks both under Basel I and II, reflecting the sound capital position of banks. As at end-March 2012, the core CRAR stood well above the stipulated minimum of 6 per cent (Table IV.13). 4.27 As at end-March 2012, the majority of public sector banks had Tier I capital adequacy ratio within the range of 8 to 12 per cent (Chart IV.9).
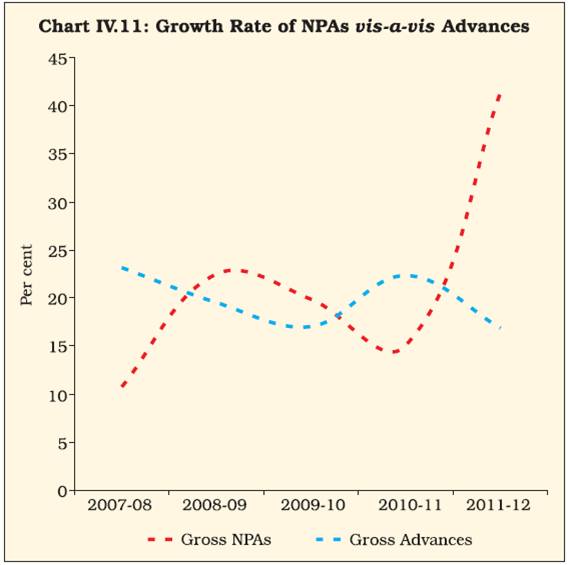
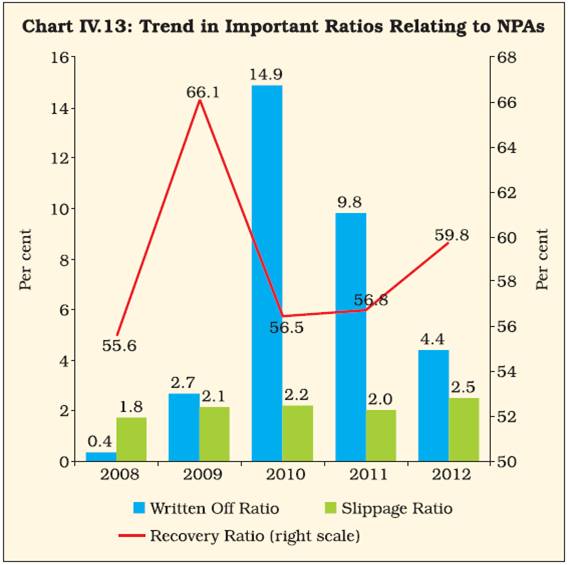
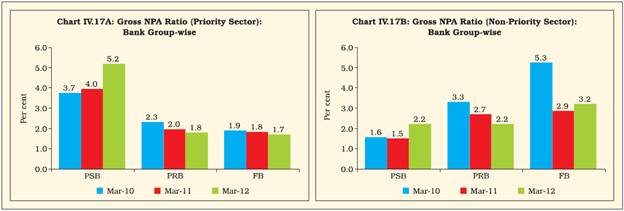
Leverage Ratio Leverage ratio remained well above 4.5 per cent 4.28 In 2011-12, the leverage ratio, calculated as Tier I capital (under Basel II) as percentage of total assets increased compared with the previous year and remained above 4.5 per cent3. This was in sync with the increase in CRAR (under Basel II) (Chart IV.10). Non-Performing Assets Gross NPA ratio at system-level increased, mainly on account of the deterioration in asset quality of public sector banks 4.29 During 2011-12, the deteriorating asset quality of the banking sector emerged as a major concern, with gross NPAs of banks registering a sharp increase. The spurt in NPAs could be attributed to the slowdown prevailing in the domestic economy as well as inadequate appraisal and monitoring of credit proposals (Chart IV.11)4. 4.30 The deterioration in asset quality was more pronounced in the case of public sector banks. During 2011-12, the gross NPAs of public sector banks increased at a higher rate as compared with the growth rate of NPAs at a system-level (Table IV.14 and Chart IV.12). Slippage ratio deteriorated, though recovery ratio witnessed an improvement 4.31 In addition to an increase in gross NPAs at the system-level, fresh accretion of NPAs, as captured by the slippage ratio5 also increased during 2011-12 compared with the previous year. However, on a positive note, the recovery ratio6 of the banking sector witnessed an improvement during the year. During 2011-12, the written-off ratio7 was significantly lower as compared with the previous year (Chart IV.13). 4.32 At the bank group level, the accretion to NPAs as captured by the slippage ratio was higher in the case of public sector banks and foreign banks. However, their recovery performance was also better than private sector banks. Among various bank groups, new private sector banks relied more on writing off NPAs as a measure to contain their NPAs level (Chart IV.14). Restructured standard advances increased significantly 4.33 In recent years, restructuring of advances has been one of the important channels used by banks to contain the deterioration in asset quality caused by burgeoning NPAs. Consequent to the slowdown in domestic economy, banks, especially public sector banks actively resorted to restructuring their advances under the special dispensation scheme of the Reserve Bank announced during 2008. The scheme enabled banks to retain the status of standard accounts even after restructuring. The steep increase in gross NPAs during 2011-12 was accompanied by a considerable pick-up in the growth of restructured advances. This was mainly due to the steep increase in restructured advances by public sector banks, particularly nationalised banks (Charts IV.15 and IV.16). 4.34 During 2011-12, total amount of NPAs recovered through the Securitisation and Reconstruction of Financial Assets and Enforcement of Security Interest Act (SARFAESI Act), Debt Recovery Tribunals (DRTs) and Lok Adalats registered a decline compared with the previous year. Of the total amount recovered through these channels, recoveries under the SARFAESI Act constituted almost 70 per cent. 4.35 Banks approach the DRTs in case they fail to recover total amount of their bad loans through the SARFAESI Act. At present, there are 33 DRTs and five Debt Recovery Appellate Tribunals across the country. NPAs recovered through DRTs constituted almost 28 per cent of total NPAs recovered through these three channels (Table IV.15). 4.36 As at end-June 2012, banks subscribed to almost 70 per cent of total security receipts issued by 14 securitisation/reconstruction companies. These companies, which function under the SARFAESI Act, acquire NPAs from banks, which helps the banking sector to improve the quality of their balance sheets (Table IV.16). Provisioning coverage ratio declined 4.37 Though total provisioning increased at a higher rate, in sync with the higher growth of NPAs, the provisioning coverage ratio (PCR) dipped compared with the previous year. This was mainly due to the decline in the PCR of public sector banks (Table IV.17). Net NPAs increased significantly 4.38 In sync with the acceleration in growth of gross NPAs as well as a lower provisioning coverage, net NPAs registered higher growth. Net NPA ratio was on a higher side for public sector banks, as compared with private sector and foreign banks (Also see Table IV.14). NPAs became stickier, with proportion of substandard as well as doubtful assets in gross advances registering an increase 4.39 Apart from an increase in NPAs, the deterioration in asset quality was also evident in the form of rising sub-standard/doubtful assets as a percentage of gross advances. Increase in these two categories of NPAs as percentage of gross advances indicated that NPAs became stickier (Table IV.18). Sector-wise Analysis of Non-performing Assets8 Deterioration in asset quality of public sector banks was spread across priority and non-priority sectors 4.40 Bank group-wise analysis of the ratio of gross NPAs to gross advances indicated that for public sector banks, this ratio increased for both the priority and non-priority sectors. In addition, the gross NPAs to gross advances ratio (priority sector) was significantly higher for public sector banks than other bank groups (Chart IV.17). Nearly half of the total NPAs were attributed to priority sectors 4.41 During 2011-12, total priority sector NPAs increased at a significantly higher rate than the growth rate of credit to the priority sector. However, the share of the priority sector in total NPAs declined compared with the previous year. Among bank groups, proportion of priority sector in total NPAs was higher for public sector banks. Share of agricultural sector in total NPAs registered an increase 4.42 The sectoral classification of NPAs revealed that, during 2011-12, the share of agriculture in total NPAs increased marginally. However, despite the subdued industrial performance, the share of micro and small enterprises in total NPAs of the banking sector came down as compared with the previous year (Chart IV.18 and Table IV.19).
Liquidity Liquidity ratio exhibited marginal decline 4.43 During 2011-12, the liquidity of banks was adversely affected by many structural and frictional factors, which include, inter alia, deceleration in deposits growth rate, growing mismatch in maturity profile of assets and liabilities as well as exposure to long-run infrastructure projects. The percentage of liquid assets (cash and balances with the Reserve Bank in excess of CRR requirements, and investments and advances with maturity up to one year) in total assets can be taken as a rough measure of banks’ liquidity condition. This ratio deteriorated marginally during 2011-12. 5. Sectoral Deployment of Bank Credit Deceleration evident in the growth of aggregate non-food bank credit 4.44 The growth in aggregate non-food bank credit decelerated in 2011-12. This trend is in consonance with the overall slowdown observed in the growth of loans and advances in banks’ consolidated balance sheet. Sluggish growth performance of the domestic economy due to cyclical and structural factors partly explains the slowdown in credit off-take. The overall slowdown in non-food bank credit during 2011-12 mainly emanated from slower growth in credit to industry, services and personal loans. 4.45 Given that majority of the personal loans are long-term in nature, growth in personal loans assumes special significance, especially in the backdrop of increase in NPAs during 2011-12. On a year-on-year basis, the growth in personal loans decelerated during 2011-12 compared with the previous year. Within the personal loans segment, housing credit slowed down (Table IV.20).
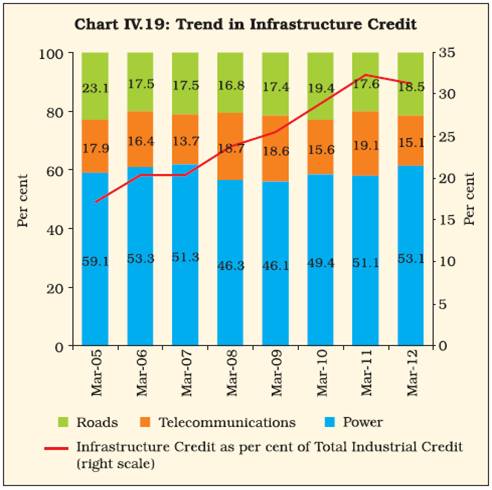
Credit to infrastructure grew at a slower pace 4.46 Following the overall deceleration in credit growth, credit to infrastructure also slowed down. As at end-March 2012, power sector accounted for more than half of total infrastructure credit (Chart IV.19). Also, the growth of credit to power sector was higher than the overall growth of credit to infrastructure. Going forward, there is a need to monitor the impact of lending to power sector on banks’ asset quality, especially given the slowdown observed in this sector in recent times. In addition, lending to infrastructure, being long-term in nature may result in an increase in maturity mismatch. A detailed analysis of the same is provided in Box IV.2. Credit to Priority Sectors 4.47 During 2011-12, public and private sector banks’ advances to priority sectors were less than 40 per cent of adjusted net bank credit/credit equivalent off-balance sheet exposure, whichever is higher. In addition, advances to agriculture and weaker sections by both public and private sector banks were less than 18 per cent and 10 per cent, respectively, at the aggregate level (Table IV.21).
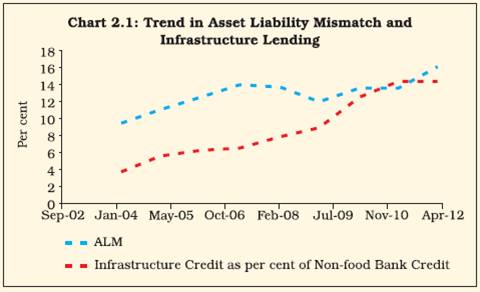
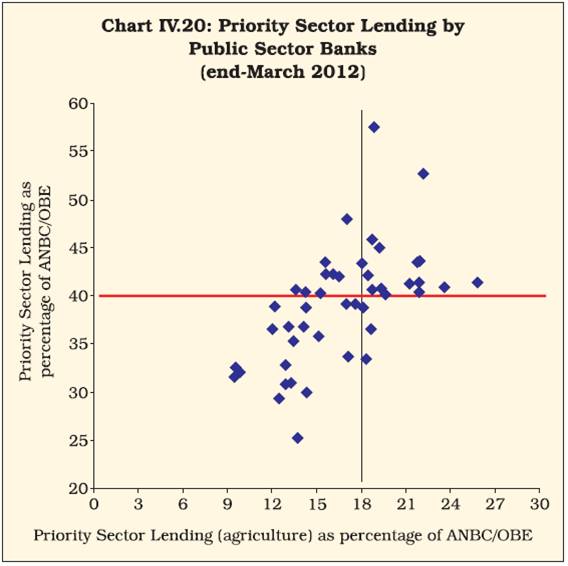
Domestic banks’ failure to meet the priority sector target remains a concern 4.48 The bank-wise provisional data on priority sector lending as on last reporting Friday of March 2012 indicates that 16 out of 26 public sector banks could not meet the overall priority sector target of 40 per cent. The number of public sector banks, which could not meet the sub-target of priority sector lending to agriculture and weaker sections stood at 15 and 11, respectively. As on the last reporting Friday of March 2012, 6 private sector banks could not meet the overall priority sector target of 40 per cent. In addition, 13 private sector banks could not achieve the sub-target set for agriculture (Chart IV.20). A detailed analysis of priority sector lending is provided in Box IV.3. Box IV.2: Bank Lending to Infrastructure and Asset-Liability Mismatches: How Strong is the Linkage? In a developing country like India, infrastructure plays a crucial role in sustaining the growth momentum of the country. According to the Approach Paper of 12th Five-Year Plan, the investment requirements in the infrastructure sector are estimated to be around `45 trillion during the 12th Plan period. This implies that infrastructure investment to GDP ratio needs to increase from about 8 per cent during 2011-12 to 10 per cent by 2016-17. However, investment in infrastructure development bears some special significance for the financial sector of the country as these investments are typically lump sum and involving long gestation, thus having implications for asset liability management. Apart from this, infrastructure projects are often subject to procedural delays and thus expose the lender to the risk of non-realisation of return in time. During the last few years, the total credit extended by the SCBs to infrastructure segment increased within a range of 40-43 per cent. Also, infrastructure accounted for almost 15 per cent of total non-food gross bank credit in recent years. As against this, there was an increase in short-term liabilities of the banking sector during recent years. The asset-liability mismatch (ALM), calculated as the gap between proportion of short-term deposits and borrowings (with maturity up to one year) and proportion of short-term credit and investments (with maturity up to one year) also witnessed an upward trend in recent years (Chart 2.1). In order to understand the possible impact of infrastructure lending on asset liability mismatches of the banking sector, a regression analysis was carried out taking the ALM as dependent variable, and credit to infrastructure as percentage of total non-food gross bank-credit and proportion of term deposits in total deposits, as explanatory variables. While increased proportion of term deposits is expected to increase the stability of balance sheet and thus reduce asset liability mismatches, increase in infrastructure lending could further exacerbate the asset-liability mismatches. Empirical results of the analysis are presented in Table 2.1.
From the results, it can be seen that proportion of infrastructure credit in total non-food gross bank credit is positively correlated with the ALM and this correlation was statistically significant. However, though the coefficient associated with proportion of term deposits was negative, the corresponding “t” value came out as statistically insignificant. Recognising the possible adverse impact of infrastructure financing by banks on their asset-liability management, the Reserve Bank has taken certain measures in recent years such as permitting banks to enter into take out financing arrangement with IDFC/other FIs. Going forward, there is a need to conduct detailed impact analysis of the effect of infrastructure lending on asset liability mismatches of banks. Also, there is a need to make infrastructure projects commercially viable, apart from strengthening the corporate bond market, which would reduce the dependence on banks for infrastructure funds. Banks’ retail loan portfolio expanded at a higher rate 4.49 During 2011-12, banks’ retail loan portfolio witnessed expansion at a higher rate as compared with the previous year, mainly led by growth in credit card receivables and other personal loans. Housing loans continued to constitute almost half of total retail portfolio of banks (Table IV.22).
Credit flow to sensitive sectors registered subdued growth 4.50 The Reserve Bank considers capital market, real estate, and commodities as sensitive sectors as sudden spurt in credit to these sectors could adversely affect the asset quality of banks due to price fluctuations in related asset/product markets. During 2011-12, growth in credit to sensitive sectors slowed down as compared with the previous year. As a consequence, proportion of credit to sensitive sectors in total credit also registered a decline. Real estate exposure accounted for more than 90 per cent of total bank exposure to sensitive sectors. At the bank group level, foreign banks’ exposure to these sectors was higher as compared with other bank groups (Appendix Table IV.3). 6. Operations of Scheduled Commercial Banks in Capital Market Resource mobilisation through public and private placements slowed down 4.51 In an increasingly liberalised and competitive market, banks’ resource mobilisation through the capital market provides an important avenue for growth in their balance sheet. However, following the uncertainties prevailing in the domestic market and relatively subdued performance of the equity market during the first half of 2011-12, banks abstained from raising resources through public issues during 2011-12 (Table IV.23).
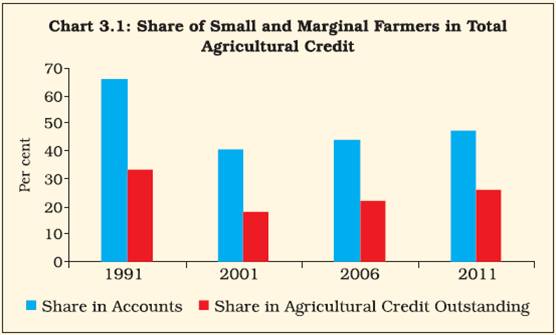
Box IV.3: Priority Sector Lending – is there a Bias towards Bigger Credit Needs? The effort of extending formal credit to key priority sectors, i.e., agriculture and small scale industries had been set in motion back in 1968, when the Reserve Bank, in consultation with the National Credit Council (NCC) for the first time emphasised the need to increase commercial banks’ commitment to priority sector lending. The description of the priority sectors was later formalised in 1972 on the basis of the report submitted by the Informal Study Group on Statistics relating to advances to the priority sectors. Although no specific target was fixed for lending to priority sectors during the initial years, banks were advised to increase the share of these sectors in their aggregate advances to the level of 33 per cent by March 1979. Later, banks were advised to increase the proportion of their priority sector lending to 40 per cent by March 1985. Subsequently, other committees and working groups on priority sector lending continued with the recommendation of a specific priority sector mandate for banks, though there have been periodic changes in the scope of priority sector definition from time to time. The recent development regarding priority sector lending involved constitution of a Working Group within the Reserve Bank under the Chairmanship of Shri M. V. Nair, with the mandate of re-examining the existing classification and suggesting revised guidelines with regard to priority sector lending classification and related issues. As per the revised priority sector norms, there is no change in the overall target of 40 per cent. However, foreign banks having 20 branches or more will be subject to same targets as domestic banks, to be achieved within a period of five years (from April 1, 2013); in the case of other foreign banks, the existing target of 32 per cent continues to apply. In this context, an attempt has been made to understand whether loans are concentrated in larger accounts at the cost of small borrowers within the priority sectors. Agriculture is one of the most important employment intensive sectors of the economy, and as such a sub-target of 18 per cent of ANBC is prescribed for ensuring adequate credit flow to this sector. While there have been concerns about non-adherence to this target by banks in general, a further disaggregated analysis shows that only about one-fourth of total agricultural credit is going to small and marginal farmers. Further, the share of small and marginal farmers in total agricultural accounts continued to decline during past two decades. However, on the positive side, share of small and marginal farmers in the total agricultural credit outstanding witnessed an increasing trend from the 2000 onwards (Chart 3.1). Importantly, 13.6 per cent of total agricultural credit was absorbed by corporate, partnership firms and institutions engaged in agriculture, as on the last reporting Friday of March 2011. Agro-processing units accounted for almost 5 per cent of the total agricultural credit during the same period. Data on credit to micro and small enterprises also revealed a bias in favour of relatively bigger enterprises. As on the last reporting Friday of March 2011, of the total credit outstanding to the micro and small enterprises, only 21.1 per cent was disbursed to micro (manufacturing) enterprises with investment up to `5 lakh and micro (service) enterprises with investment up to `2 lakh as against the prescribed target of 40 per cent. Priority sector loans across different sectors to certain borrowers are classified as weaker sections and a separate target of 10 per cent of ANBC is prescribed for this category. Though number of accounts in weaker section category witnessed higher growth during late 2000s as compared with early 2000s, amount outstanding under small and marginal farmers, DRI beneficiaries as well as SHGs decelerated during late 2000s (Table 3.1). Thus, within the priority sectors, especially within agriculture and micro and small enterprises, majority of loans are concentrated in relatively larger accounts. There is a need to change credit concentration within the priority sector in order to further facilitate the process of inclusive growth.
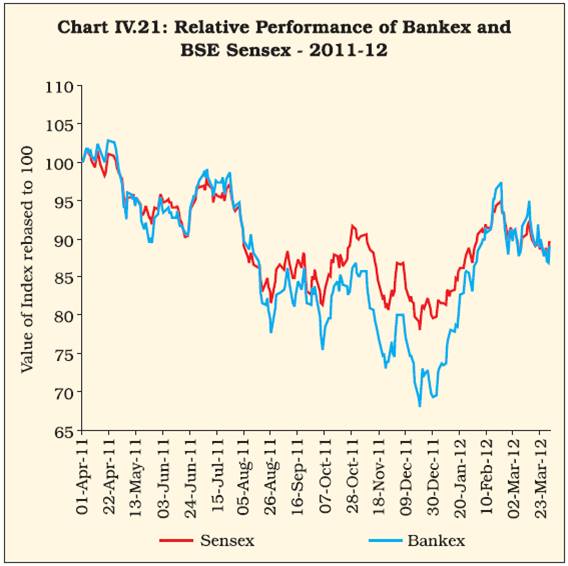
4.52 During 2011-12, banks’ resource mobilisation through private placements also slowed down as compared with the previous year. This reduction in resource mobilisation through private placements was in the case of public sector banks, while private sector banks continued to raise resources through private placements. Due to the global uncertainties emanating from the deteriorating European sovereign debt crisis, Indian banks did not mobilise resources from euro issues (Table IV.24). Performance of BSE Bankex was subdued 4.53 Indian equity market witnessed sluggishness until December 2011, before picking up in the fourth quarter of 2011-12 following renewed FII buying. In tandem, the BSE Bankex, which represents the banking sector scrips, recorded negative return during 2011-12. The volatility of the BSE Bankex was also higher than the BSE Sensex, reflecting the higher risk perception in banking stocks. However, performance of BSE Bankex improved in the later part of the year and during February-March 2012, it outperformed the BSE Sensex (Table IV.25 and Chart IV.21). 4.54 In sync with the overall trend of the BSE
Bankex, most banks recorded a lower price
earning (P/E) ratio in 2011-12 compared with the
previous year. During 2011-12, though the share
of bank stocks in total turnover maintained an
upward trend, banks’ share in total market capitalisation declined as compared with the
previous year (Appendix Table IV.4 and Table
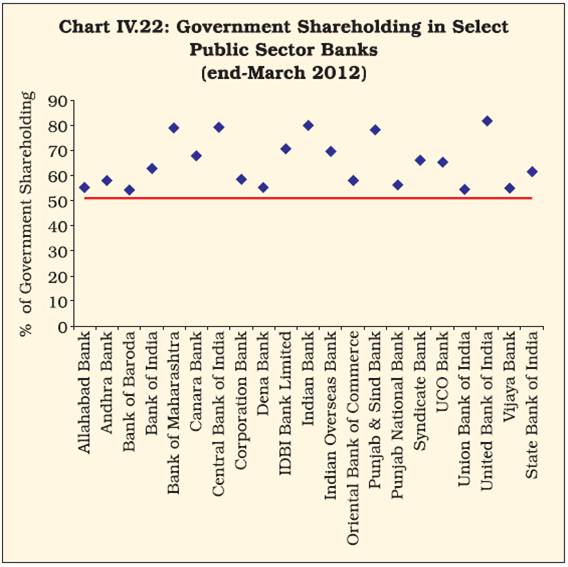
IV.25). 7. Shareholding Pattern in Scheduled Commercial Banks Government shareholding in PSBs was well above the statutory requirement 4.55 During 2011-12, majority of public sector banks had Government shareholding of more than the stipulated 51 per cent, though for a number of public sector banks, this percentage was close to the statutory floor (Chart IV.22). As at end-March 2012, 10 out of 26 public sector banks had private shareholding ranging from 20 per cent to 40 per cent. In addition, foreign shareholding in public sector banks was only upto 17.4 per cent. As at end-March 2012, foreign shareholding in private sector banks was upto 70.7 per cent, which was within the stipulated limit of 74 per cent (Table IV.26 and Appendix Table IV.5). 8. Foreign Banks’ Operations in India and Overseas Operations of Indian Banks 4.56 As at end-March 2012, there were 41 foreign banks operating in India with 323 branches. Another 46 foreign banks had their representative offices in India. Among foreign banks, Standard Chartered had the maximum spread of bank branches in India (96 branches) followed by HSBC (50 branches), Citi Bank N.A. (42 branches) and Royal Bank of Scotland N.V. (31 branches). 4.57 As at end-March 2012, 23 Indian banks had overseas presence with a total number of overseas branches of 250, as compared with 244 during the previous year. Of these overseas branches, 215 branches were of public sector banks. Among these banks, the State Bank had maximum number of overseas branches followed by Bank of Baroda and Bank of India. In addition, 25 Indian banks had a total of 55 representative offices in other countries. The number of subsidiaries and joint ventures of Indian banks abroad stood at 24 and 6, respectively (Table IV.27).
9. Technological Developments in Scheduled Commercial Banks 4.58 Over the years, the Reserve Bank has laid special emphasis on technology infusion in the day to day operations of banks. Technology, apart from increasing the efficiency of banking services, is expected to boost the ongoing process of financial inclusion emphasised by the Reserve Bank. In recent years, increase in the number of off-site ATMs in various locations as well as use of mobile phones for delivering banking technology has further facilitated banking outreach in remote areas. The IT Vision Document, 2011-17 of the Reserve Bank sets out the roadmap for implementation of key IT applications in banking with special emphasis on seamless delivery of banking services through effective implementation of Business Continuity Management (BCM), Information Security Policy, and Business Process Re-engineering (BPR). 4.59 With the computerisation and adoption of Core Banking Solutions in banks almost reaching the final stage of completion, the focus has now shifted to adoption of more advanced technologies in banking, which would use analytics and business intelligence to enhance their Customer Relationship Management (CRM) and improve internal effectiveness including Management Information Systems (MIS) and managing risks arising out of IT implementation. Sustained increase in total number of ATMs indicating move towards door-step banking 4.60 During 2011-12, an additional 21,000 ATMs were deployed by the banks. Public sector banks accounted for more than 60 per cent of the total number of ATMs as at end-March 2012, while close to one-third of the total ATMs were attributable to new private sector banks (Table IV.28).
Public sector banks were major issuers of debit cards 4.61 Issuance of credit cards declined, while debit cards showed a high growth trend. Foreign banks, however, showed a small decline in the issuance of debit cards. More than three-fourths of the total debit cards outstanding as at the end of March 2012 were issued by public sector banks. In contrast, more than half of the outstanding credit cards as at the end of March 2012 were issued by new private sector banks (Table IV.29 and Chart IV.23). Both volume and value of transactions through major electronic payment systems registered an increase 4.62 A trend in favour of cashless payments is discernible in recent years with both volume and value of transactions through major electronic modes of payments registering an increase (Table IV.30 and Box IV.4). Box IV.4: Changing Trend of the Payment Systems from Cash to Cashless In India, cash continues to be the pre-dominant mode of payment. The policy initiatives and the regulatory stance of the Reserve Bank has continued to focus on increasing the acceptance and penetration of safe, secure and efficient non-cash payment modes comprising cheques, credit/debit cards, and transactions through ECS/RTGS/NEFT, over the years. Due to these measures the average ratio of non-cash retail payment to GDP continues to hover around 6 per cent over the last three years. (Table 4.1).
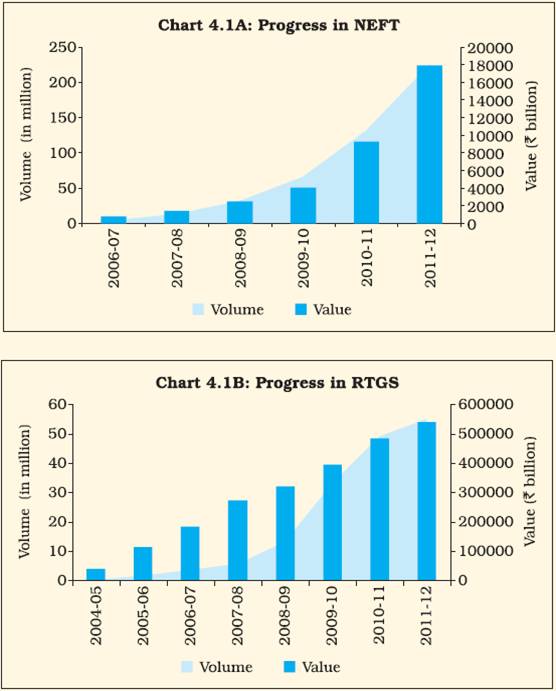
The bank-led model for mobile banking has also started gaining popularity in the recent months. As at the end of June 2012, 69 banks were granted approval to provide mobile banking facility, of which 49 have started operations. In November 2010, National Payment Corporation of India (NPCI) was given approval to launch Interbank Mobile Payment Service (IMPS), which is a unique 24X7 inter-bank electronic funds transfer system providing instantaneous credit to the beneficiaries. With this channel having now stabilised and gaining further customer acceptance, the earlier transaction limit for mobile banking has been removed by the Reserve Bank. The banks are now free to fix their own per transaction limit based on their own risk perception with the approval of their respective Boards. Apart from this, the volume and value of transactions through the two major electronic payment systems of the country, i.e., RTGS and NEFT has increased rapidly (Chart 4.1A and 4.1B). Pre-paid payment instruments (PPIs) have emerged as a convenient replacement/substitution for cash transaction, besides providing a proper audit trail. PPIs are payment instruments that facilitate purchase of goods and services against the value stored on such instruments. As at end- June 2012, 40 banks (including the Department of Posts, GoI) and 21 non-bank entities were granted approval/ authorisation under the Payment and Settlement System (PSS) Act, 2007 to issue PPIs in India. Three types of PPIs are popularly issued viz., paper voucher, cards and m-wallets. Amongst these, the paper vouchers are the most popular in terms of numbers and value. These were mainly issued by non-banks (Table 4.2). However, efforts are underway to migrate these paper based PPIs to electronic modes.
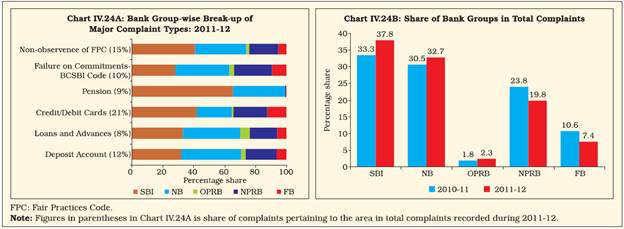
Going forward, the relaxations in the domestic money transfer guidelines introduced in October 2011 are expected to provide further impetus towards financial inclusion through electronic PPIs, including the use of m-wallets, by enabling all authorised entities (both banks as well as nonbanks) to increase domestic remittances through formal payment channels. Implementation of Business Continuity Plan (BCP) and Automated Data Flow is in progress 4.63 At the present juncture, banking in India is largely dependent on technology. It is, therefore, necessary that banks have appropriate and adequate arrangements for disaster recovery and business continuity to face any event of natural disasters or operational failure. During recent years, an integrated Business Continuity Management (BCM) arrangement encompassing continuity planning for all business functions including data centres has evolved, with support provided by the Reserve Bank. In addition, to address the issues of disruption in business process arising from technology failure, appropriate disaster recovery and business continuity arrangements have been implemented at RBI data centres. 4.64 Considering the importance of accuracy and timeliness in regulatory reporting, a project on automating data flow from the core banking solution (CBS) or other IT systems of commercial banks to the Reserve Bank was announced in the Monetary Policy Statement of 2010-11. The Approach Paper released in November 2011, prepared by a core group with representation from banks, the Reserve Bank, IDRBT and the IBA envisages the implementation in two phases. In the first phase, banks were advised to ensure seamless flow of data from their transaction server to their management information system (MIS) server while the second phase would involve the Reserve Bank to introduce a system for generating all returns from banks’ MIS. Implementation of the first phase is in progress, and is monitored and reviewed at quarterly intervals. The project is expected to be completed by March 2013. In the second phase, the Reserve Bank would introduce a system for the flow of data from the MIS server of banks in a straight through process. 4.65 Considering the tremendous growth in volume of transactions through the RTGS system, a Technical Advisory Group (TAG) with members from technology institutes, banks and the Reserve Bank was constituted in order to review the RTGS system. The Group recommended building up the New Generation RTGS (NG-RTGS) system, which would encompass key features such as (i) liquidity-saving mechanism (ii) advanced queue management system (iii) various modes of access as per the size of the bank (iv) Extensible Mark-up Language (XML) based messaging system and (v) real-time information and transaction monitoring and control system having the dashboard facility. 10. Customer Service 4.66 Providing efficient and hassle-free banking services has been one of the important priorities pursued by the Reserve Bank. A separate Customer Services Department was set up within the Reserve Bank in July 2006 to oversee the grievance redressal mechanism of various banks as well as the Reserve Bank as also administering the Banking Ombudsman (BO) scheme. At present, the BO is functional across 15 major banking centres of the country. Major metropolitan cities accounted for almost 40 per cent of total complaints 4.67 The major metropolitan centres, i.e., New Delhi, Mumbai, Kolkata, and Chennai accounted for almost 40 per cent of the total number of complaints received across the country (Table IV.31). Majority of complaints relate to credit/debit cards and violation of fair practices code 4.68 According to the category-wise data on complaints sourced from all 15 BO offices, majority of complaints were regarding credit/debit cards followed by non-observance of the fair practices code, deposits account, failure of commitments made under the BCSBI code and pensions. Public sector banks accounted for almost two-thirds of total complaints 4.69 In continuation of the trend observed during the previous year, public sector banks accounted for bulk of the complaints (70 per cent) received during 2011-12. Within public sector banks, the State Bank group alone accounted for almost 38 per cent of total complaints received during 2011-12. Though across all major categories of complaints, the combined share of the State Bank group and nationalised banks was more than 50 per cent, it was particularly marked for complaints related to pensions (Chart IV.24 and Appendix Table IV.7). 4.70 Going forward, there is a need to improve customer services in public sector banks across all spheres of banking and particularly in areas related to deposit accounts, loans and advances, failure of commitments made under the BCSBI code and pensions. In addition, services related to credit/debit cards, which have been subject to frequent complaints from customers in recent years, need to be improved across all bank groups. With the advent of technology, there is a need to further strengthen customer service in areas of net and mobile banking to enhance customer confidence in these technologies. 4.71 There is a further need to improve the customer data base, which apart from facilitating banks to acquaint themselves with the whereabouts of the customers, would help them to prevent incidents of fraud/money-laundering. A new initiative, namely, Unique Customer Identification Code (UCIC) has been taken up by the Reserve Bank in this area (refer to Box III.1 of Chapter III). Need to improve customer awareness to contain incidents of frauds involving customers 4.72 With greater infusion of technology in banking, the incident of frauds in internet banking has witnessed an increase in recent times. Ensuring efficiency of the banking sector by way of technology infusion while minimising the occurrence of such fraudulent events has become one of the major objectives of the Reserve Bank in recent years. Complaints related to unauthorised fund transfers, fraudulent withdrawals from ATMs using duplicate cards, phishing E-mails aimed at extracting personal information have registered significant increase in recent times. 4.73 Going forward, there is a need for building up a robust mechanism to prevent incidents of fraud in areas of mobile/net banking and electronic fund transfer. Along with this, the initiatives by various BO offices to improve customer education and awareness need to be stepped up further, which would require active support from banks as well as State Governments. 11. Financial Inclusion 4.74 In sync with the objective of inclusive growth, the Reserve Bank has given high priority to the agenda of financial inclusion over the past few years. Initiatives were taken by the Reserve Bank in recent years to expand banking services to remote areas of the country. This includes relaxation of branch authorisation policy, and directing commercial banks to open at least 25 per cent of their total branches in hitherto unbanked areas of the country. In addition, considering the difficulty of opening brick-and-mortar branches in all the remote parts of the country, the Reserve Bank has been encouraging banks to improve banking penetration through Business Correspondents (BCs)/ Business Facilitators (BFs). Further, the Reserve Bank has also allowed for-profit organisations to work as BCs. Apart from this, leverage of technology for the expansion of banking services has been encouraged by the Reserve Bank in recent years. The use of mobile technology to deliver banking services is an important initiative in this direction. Despite all the attempts made by the Reserve Bank, the extent of financial exclusion continued to be significant in India, when compared with some of the advanced as well as developing countries (Table IV.32). Majority of the new bank branches were opened in rural and semi-urban areas 4.75 In accordance with the efforts put forward by the Reserve Bank for opening new bank branches in rural areas, more than two-thirds of total new branches opened during 2011-12 were in rural or semi-urban areas. Among the regions, southern region accounted for almost 30 per cent of total new bank branches opened (Table IV.33). Majority of the new bank branches were located in Tier 2-6 centres 4.76 Consequent to the liberalisation of the branch authorisation policy, banks are not required to take prior approval from the Reserve Bank in order to open branches in Tier-2 to Tier- 6 centres. Of the total new bank branches opened during 2011-12, almost 70 per cent (4,831 bank branches) were located in Tier-2 to Tier-6 centres. Off-site ATMs as substitute for brick-and-mortar branches 4.77 Off-site ATMs play an important role by providing the basic banking services like cash withdrawal, transfer of funds even without the presence of full-fledged brick-and-mortar branches. During 2011-12, there was an addition of 14,365 new off-site ATMs. However, metropolitan areas accounted for the maximum number of newly opened ATMs. Southern region had maximum number of newly opened ATMs, followed by northern region. However, the share of rural areas in the total number of ATMs continued to remain small (Chart IV.25 and Table IV.34).
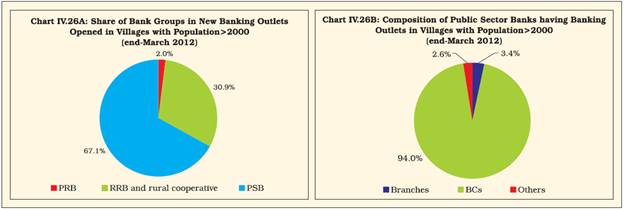
The process of providing banking outlets in all villages with population more than 2,000 is on the verge of completion 4.78 As at end-March 2012, 99 per cent of the identified villages have been provided with banking outlets. Four States, viz., Uttar Pradesh, Bihar, West Bengal and Andhra Pradesh accounted for more than 50 per cent of these newly opened banking outlets. On a positive note, all identified villages in the north-eastern region have been provided with banking outlets. Region-wise analysis of the progress made in banking penetration indicated that significant progress has been made in eastern as well as north-eastern region on this front (Table IV.35). Public sector banks and regional rural banks play a key role in financial inclusion process 4.79 Bank group-wise analysis of new banking outlets in identified villages revealed that public sector banks as well as RRBs played a key role in expanding the banking network in rural India (Chart IV.26). 4.80 Further, in sync with the Government’s mandate of transferring all benefits directly to the beneficiaries’ bank accounts, the Reserve Bank is encouraging banks to implement Electronic Benefit Transfers (EBT). Since the social security beneficiaries may be residing in villages with a population of less than 2000, there is an immediate need for expanding EBT-enabled bank accounts across smaller villages. Initiatives undertaken for implementation of the process of EBT 4.81 The Reserve Bank has issued guidelines to SLBC convenor banks in June 2012 mandating them to prepare a roadmap covering all un-banked villages of population less than 2,000 and allot these villages to banks for providing banking services, in a time-bound manner. Banks have also been advised to have a BC touch point in each of the villages in the country, to start with, for provision of EBT services. 4.82 Further, banks have been advised to give priority, in the initial stages, to provide door step services to EBT beneficiaries through regular visits by BCs to the allotted villages, for making it a self-sustaining business model and over a period of time, ensure that all kinds of banking services, viz., remittances, recurring deposit, entrepreneurial credit in the form of KCC and GCC, and other banking services are available to all the residents of the village through a mix of brick-and-mortar branches and BC network. 4.83 Keeping in view the difficulty faced by one lead bank in implementing EBT across all villages of the concerned district under the erstwhile “one district-one bank” model, the Reserve Bank has recommended the implementation of EBT through the “one district-many banks-one leader bank” model, in its “Operational Guidelines for Implementation of EBT and its Convergence with Financial Inclusion Plan”. Under this model, all banks having presence in the concerned district would participate in EBT, though for administrative convenience, the Government would deal with only one leader bank. The revised model is expected to expedite EBT implementation due to its simplicity and scalability. Financial Inclusion Plan (FIP) is in progress 4.84 All public and private sector banks were advised to put in place Board approved three-year financial inclusion plans (FIPs) from April 2010 onwards. The FIP should broadly contain self-set targets with respect to; i) opening rural brick and mortar branches; ii) deployment of BCs; iii) coverage of villages with population of more than 2000 as also other un-banked villages with population below 2,000 through branches/BCs/ other modes; iv) opening no-frills accounts including through BC-ICT; v) issuing Kisan Credit Cards (KCCs) and General Credit Cards (GCCs), and other specific products designed by them to cater to the financially excluded segments. 4.85 The progress, so far, by banks in achieving FIP during the last two years has been impressive. A brief analysis of the progress shows that penetration of banking has increased multi-fold in rural areas. As at end-March 2012, villages covered through BCs constituted more than 80 per cent of the total villages covered under the FIP. This indicates move towards the widespread acceptance of BC model of financial inclusion by banks as well as consumers in rural India. Volume of transactions through ICT-based accounts increased steadily 4.86 No-frills accounts enable small customers to avail of hassle-free credit in the form of in-built overdraft facility. As at end-March 2012, the total number of no-frills accounts had surpassed 100 million. However, only two per cent of these no-frills accounts had overdraft facility. One welcome development noticed in this regard is that, the number of ICT-based accounts as percentage of no-frills accounts has witnessed steady increase in the last two years, indicating increased acceptance of ICT-based products among rural customers. 4.87 In the ensuing year, focus would be on the number and value of transactions in the no-frills accounts and credit disbursed through ICT-based BC outlets. For the purpose, banks have been advised to ensure that FIPs prepared by their Head Offices are disaggregated at the respective controlling offices and at the branch level and a mechanism is put in place to monitor the progress at these levels periodically. Details of the progress made by banks under FIP are given in Table IV.36.
SHG-Bank Linkage Programme and Micro- Finance 4.88 The self-help group (SHG) - bank linkage programme started in 1992 as a pilot project initiated by NABARD and involving three agencies, viz., the SHGs, banks and NGOs. Though progress under the SHG-bank linkage programme was slow during the initial years of commencement, it started expanding rapidly after 1999. As at end- March 2012, about 103 million rural households had access to regular savings through 7.96 million SHGs linked to different banks. Though the number of SHGs maintaining savings accounts with banks increased during 2011-12, compared with the previous year, total amount of SHG savings outstanding in banks declined. 4.89 In recent years, micro-finance institutions have emerged as an important conduit of channelling credit to the rural parts of the country, due to their widespread reach in these areas as well as the ability to offer customised financial products, suited to the needs of average rural customers (Table IV.37).
12. Local Area Banks 4.90 Local Area Banks (LABs) play an important role in financial inclusion process. LABs came into existence in 1996, as a result of the initiatives taken by the Reserve Bank to establish local banks in private sector with minimum paid up capital of ` 500 million. It was expected that LABs would extend credit to agriculture and allied activities, small-scale industries, agro-industrial activities, trading activities and the non-farm sectors. LABs are also subject to the requirement of priority sector lending target set at 40 per cent of ANBC and at least 25 per cent of their priority sector deployment is to be disbursed to the weaker sections. 4.91 Though initially six LABs were licensed by the Reserve Bank, only four of them remained operational in the subsequent years. Of these four banks, Capital Local Area Bank accounted for more than 70 per cent of total assets of all four LABs taken together (Table IV.38 and IV.39).
13. Regional Rural Banks 4.92 As in the case of SCBs, the consolidated balance sheet of RRBs registered lower growth during 2011-12 compared with the previous year. On the liabilities side, the lower growth was mainly due to lower growth in deposits as well as borrowings. On the assets side, the deceleration in the balance sheet was attributable to reduction in balances with the Reserve Bank as well as deceleration in investments. It is noteworthy that, the share of CASA deposits in total deposits of RRBs was higher than the corresponding share for SCBs (Table IV.40). 4.93 During 2011-12, out of total 82 RRBs operating in the country, 79 made profit whereas the remaining three RRBs incurred loss. Though net profits of RRBs witnessed improvement in recent years, their net margin exhibited a mixed trend (Chart IV.27 and Table IV.41).
4.94 As at end-March 2012, priority sector advances comprised of more than 80 per cent of the total credit of RRBs. Purpose-wise composition of credit disbursed by RRBs remained broadly unchanged during 2011-12, with more than half of total credit going to the agricultural sector (Table IV.42). 14. Overall Assessment 4.95 Performance of banks during 2011-12 was conditioned by slowdown in the domestic economy coupled with higher interest rate environment. However, Indian banks remained well-capitalised. In addition, the efficiency of banks improved as reflected by lower cost-to-income ratio and NIM. Progress made by banks under the financial inclusion plans was broadly satisfactory. Deterioration in asset quality of banks remains a concern 4.96 The deterioration in asset quality, as evident by a steep rise in NPAs for banks in general, and public sector banks in particular, has emerged as a serious concern. Moreover, fresh accretion to NPAs, as captured by the slippage ratio witnessed an increase. Further, the provisioning coverage ratio declined. Though banks aggressively resorted to restructuring of advances, in the long-run it may have implications for asset quality, in case, significant proportion of these restructured advances turn into bad loans. Need to closely monitor impact of infrastructure lending on asset-liability mismatch 4.97 The liquidity condition of banks remained under stress, reflecting structural issues as well as the policy environment prevailing during 2011-12. Though credit to infrastructure registered slower growth, it continued to account for almost one-third of total bank credit to industry. Large exposure to long-gestation infrastructure projects could further exacerbate the maturity mismatch prevailing in the banking sector. Going forward, Indian banking sector needs careful monitoring of rising bad loans as well as exposure to long-term infrastructure projects. Banks’ inability to meet priority sector lending target remained a concern 4.98 During 2011-12, majority of public sector banks failed to meet the priority sector target. Though at an aggregate level, foreign banks’ performance was better as compared to domestic banks, bank-wise data revealed that some foreign banks also failed to meet the priority sector lending target. Need to further strengthen financial inclusion and improve customer service 4.99 Data on complaints received from various Ombudsman offices showed that public sector banks accounted for the majority of complaints underlining the need to improve customer services particularly with respect to pensions accounts, as their share of complaints in this area was significantly high. In addition, non-observance of the fair practices code by banks led to number of complaints from customers in recent years. Though progress in financial inclusion was broadly satisfactory, there is still a long way to go, especially given that India continues to lag behind some major developing countries in terms of financial inclusion. With increased use of technology in banking, greater emphasis is required for improving customer services in the areas of net banking and credit/debit cards as well as further developing the existing electronic payment systems. 1 Incremental C-D and I-D ratios for bank groups were calculated from consolidated balance sheet of SCBs for end-March 2011 and end-March 2012. 2 Calculated as operating expenses as percentage of total income. 3 As per the Basel III guidelines, the statutory minimum for the leverage ratio has been prescribed at 4.5 per cent, during the parallel run period. 4 Growth rate of gross NPAs and advances were calculated based on the data collected from off-site returns. 5 Slippage ratio is defined as fresh accretion of NPAs during the year as percentage of standard assets at the beginning of the year. 6 Recovery ratio is defined as NPAs recovered during the year as percentage of gross NPAs outstanding at the beginning of the year. 7 Written-off ratio is defined as NPAs written-off during the year as percentage of gross NPAs outstanding at the beginning of the year. 8 Analysis in this section is based on data collected from off-site returns. |
|||||||||||||||||||||||||||||||||||||||||||||||||||||||||||||||||||||||||||||||||||||||||||||||||||||||||||||||||||||||||||||||||||||||||||||||||||||||||||||||||||||||||||||||||||||||||||||||||||||||||||||||||||||||||||||||||||||||||||||||||||||||||||||||||||||||||||||||||||||||||||||||||||||||||||||||||||||||||||||||||||||||||||||||||||||||||||||||||||||||||||||||||||||||||||||||||||||||||||||||||||||||||||||||||||||||||||||||||||||||||||||||||||||||||||||||||||||||||||||||||||||||||||||||||||||||||||||||||||||||||||||||||||||||||||||||||||||||||||||||||||||||||||||||||||||||||||||||||||||||||||||||||||||||||||||||||||||||||||||||||||||||||||||||||||||||||||||||||||||||||||||||||||||||||||||||||||||||||||||||||||||||||||||||||||||||||||||||||||||||||||||||||||||||||||||||||||||||||||||||||||||||||||||||||||||||||||||||||||||||||||||||||||||||||||||||||||||||||||||||||||||||||||||||||||||||||||||||||||||||||||||||||||||||||||||||||||||||||||||||||||||||||||||||||||||||||||||||||||||||


ఈ పేజీని షేర్ చేయండి:


భారతీయ రిజర్వ్ బ్యాంక్ మొబైల్ అప్లికేషన్ను ఇన్స్టాల్ చేయండి మరియు తాజా వార్తలకు త్వరిత యాక్సెస్ పొందండి!
మా యాప్ను ఇన్స్టాల్ చేయడానికి QR కోడ్ను స్కాన్ చేయండి


పేజీ చివరిగా అప్డేట్ చేయబడిన తేదీ:


