 IST,
IST,


Operations and Performance of Commercial Banks
|
The Indian banking sector’s asset quality improved during 2022-23 and 2023-24, with the gross non-performing assets (GNPA) ratio declining to its lowest in a decade. The combined balance sheet of scheduled commercial banks (SCBs) expanded at an accelerated pace, driven by credit to retail and services sectors, with higher net interest income and lower provisioning requirements boosting profitability. 1. Introduction IV.1 During 2022-23, the combined balance sheet of commercial banks expanded in double digits, driven by sustained credit growth. Lower slippages helped improve asset quality across all bank groups, with GNPA to total advances ratio of SCBs dropping to a 10-year low. Higher lending rates and lower provisioning requirements helped to improve the profitability of banks and shored up their capital positions. IV.2 Against this background, this chapter discusses the operations and performance of commercial banks during 2022-23 and H1:2023-24. An analysis of the consolidated balance sheet of SCBs is presented in Section 2, followed by an assessment of their financial performance in Section 3. The financial soundness of banks and the pattern of sectoral deployment of credit are discussed in Sections 4 and 5, respectively. Sections 6 and 7 deal with ownership patterns and corporate governance, respectively. Foreign banks’ operations in India and overseas operation of Indian banks are covered in Section 8, followed by developments in payments systems (Section 9) and consumer protection (Section 10) and financial inclusion (Section 11). Developments related to regional rural banks (RRBs), local area banks (LABs), small finance banks (SFBs) and payments banks (PBs) are examined in Sections 12 to 15. Section 16 concludes the chapter and offers a way forward. 2. Balance Sheet Analysis of SCBs IV.3 At end-March 2023, the Indian commercial banking space comprised 12 public sector banks (PSBs), 21 private sector banks (PVBs), 44 foreign banks (FBs), 12 SFBs, six PBs, 43 RRBs and two LABs. Of these 140 commercial banks, 136 were classified as scheduled while four banks were non-scheduled1. The consolidated balance sheet of SCBs (excluding RRBs) grew by 12.2 per cent in 2022-23, the highest in nine years. The main driver of this growth on the asset side was bank credit, which recorded its fastest pace of expansion in more than a decade (Chart IV.1 a). Deposit growth also picked up, although it trailed credit growth, resulting in higher recourse to borrowings (Chart IV.1b). This was particularly evident in the case of PSBs, for which the deposits to liabilities ratio moderated (Chart IV.1c). 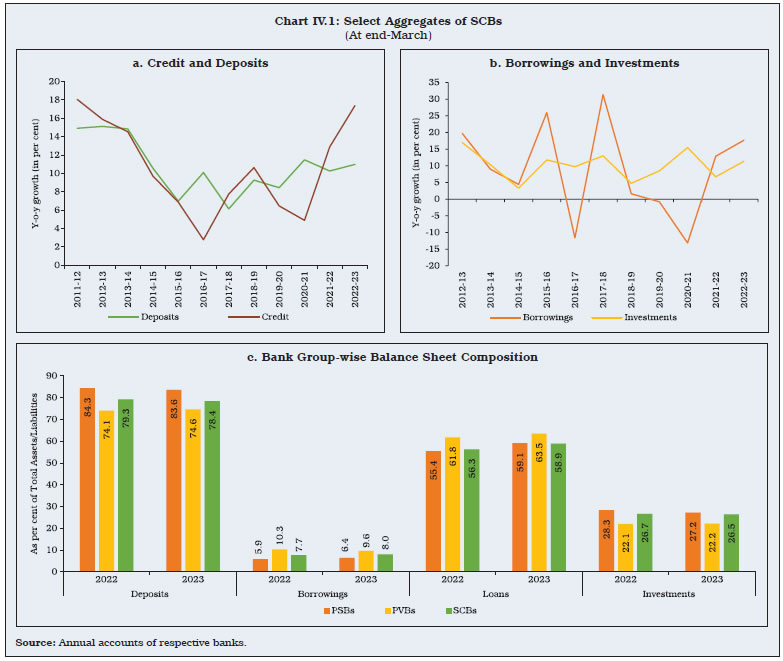 IV.4 The share of PSBs in the consolidated balance sheet of SCBs declined from 58.6 per cent at end-March 2022 to 57.6 per cent at end-March 2023, while PVBs gained share from 34.0 per cent to 34.7 per cent. At end-March 2023, PSBs accounted for 61.4 per cent of total deposits of SCBs and 57.9 per cent of total advances (Table IV.1). 2.1 Liabilities IV.5 The aggregate deposits of SCBs picked up pace during 2022-23, led by term deposits of PVBs, benefitting from higher term deposit rates spurred by policy rate hikes during May 2022 – February 2023 and moderation of surplus liquidity (Chart IV.2). Interest rates on savings bank deposits — which account for around 31.4 per cent of total deposits — remained largely unchanged, which helped banks to post higher net interest margins (NIMs).
2.2 Assets IV.6 Bank credit growth remained buoyant during 2022-23 and 2023-24. The year-on-year (y-o-y) credit growth at end-November 2023 was 16.2 per cent2 (Chart IV.3a). PSBs’ share in incremental credit increased during 2022-23 to reach 46.5 per cent at end-November 2023 (Chart IV.3b). 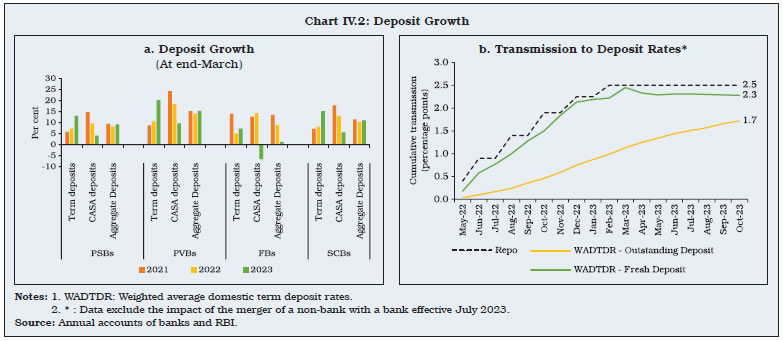 IV.7 At end-March 2023, 81.2 per cent of SCBs’ investments were in government securities (G-secs) (Table IV.2). SLR investments of SCBs rose by 14.2 per cent in 2022-23 as compared with the growth of 9.0 per cent in the previous year, which pulled up the incremental investment-deposit (I-D) ratio (Chart IV.4). The held to maturity (HTM) limit of 23 per cent for SLR eligible securities was extended up to March 31, 2024 and banks were allowed to include securities acquired between September 1, 2020 and March 31, 2024 within the enhanced HTM limit3. 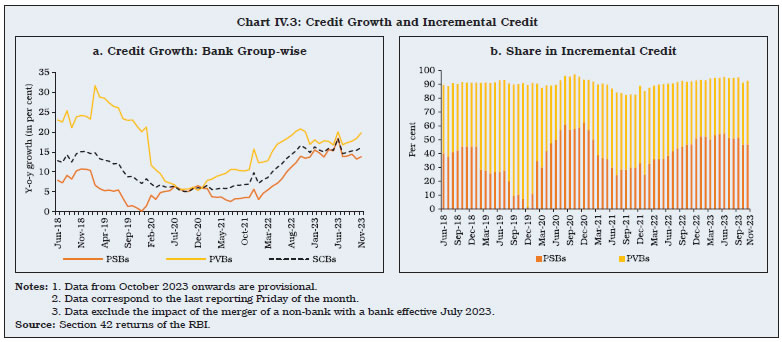 IV.8 The credit to deposit (C-D) ratio of banks increased from 74.9 per cent at end-November 2022 to 77.0 per cent at end-November 2023, on account of robust credit growth (Chart IV.4). 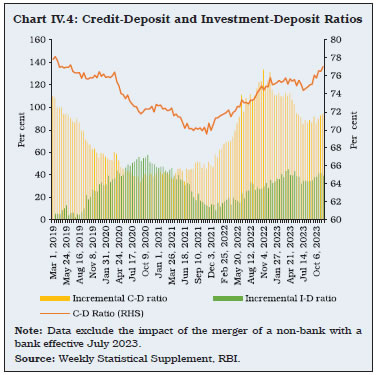 2.3 Maturity Profile of Assets and Liabilities IV.9 Mismatches in the maturity of assets and liabilities are intrinsic to the banking sector as deposits − their primary source of funds − have short- to medium-term maturities, while the repayment schedule of their loans typically stretches across the medium-term. As asset-liability mismatches expose them to interest rate risk and liquidity risk, careful monitoring and management assumes importance. During 2022-23, the maturity mismatch moderated in the short-term bucket4. The gap between assets and liabilities in the maturity bucket of over five years increased as banks took recourse to long-term borrowings (Chart IV.5). IV.10 All bank groups exhibited higher reliance on short-term borrowings relative to medium- to long-term borrowings, except SFBs. PVBs increased the share of their medium-and long-term borrowings during 2022-23. PSBs’ investments are typically in long-term instruments, while private sector counterparts prefer short-term exposures (Table IV.3). 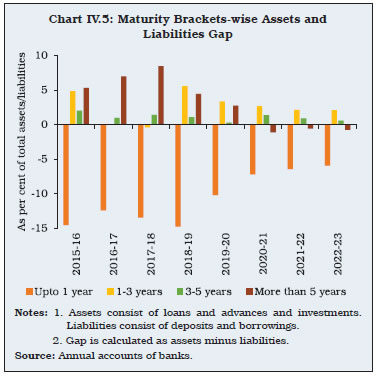 2.4 International Liabilities and Assets IV.11 In 2022-23, international liabilities of Indian banks expanded in double digits on the back of 28.5 per cent y-o-y growth in the foreign currency non-resident (Bank) (FCNR(B)) deposits, reversing the fall of (-) 21.2 per cent in the previous year. With effect from July 07, 2022, the Reserve Bank temporarily withdrew the interest rate ceiling on incremental FCNR (B) deposits until October 31, 2022, which made FCNR(B) deposits relatively attractive. IV.12 Another factor which influenced the growth in international liabilities was a 20.0 per cent y-o-y growth in equities of banks held by non-residents, up from 8.7 per cent in the previous year. Based on the latest BIS guidelines, mark-to-market (MTM) derivatives have also been included in the international liabilities from September 2022, which constituted 3.4 per cent of their liabilities at end-March 2023 (Appendix Table IV.2). IV.13 On the other hand, international assets of banks in India contracted by 13.1 per cent in 2022-23 as compared with a growth of 9.0 per cent a year ago. The fall in assets in 2022-23 was on account of a reduction in overseas loans and holdings of international debt securities as banks deployed resources to fund domestic credit (Appendix Table IV.3). Consequently, the international assets to liabilities ratio of banks in India reduced at end-March 2023, after increasing for three consecutive years (Chart IV.6). IV.14 Banks’ consolidated international claims decelerated for all major economies, except Singapore (Appendix Table IV.4). At end-March 2023, their claims shifted away from banks towards non-financial private sectors (Chart IV.7a). The proportion of longer maturity claims increased, although short-term claims remained the dominant category (Appendix Table IV.5 and Chart IV.7b). 2.5 Off-Balance Sheet Operations IV.15 Contingent liabilities of SCBs grew by 22.4 per cent in 2022-23, led by growth in forward exchange contracts (Chart IV.8a). As a proportion to balance sheet size, contingent liabilities of SCBs increased from 132.8 per cent at end-March 2022 to 144.8 per cent at end-March 2023, with those of PSBs decreasing in 2022-23 to 36.5 per cent from 41.5 per cent in 2021-22 (Appendix Table IV.6). FBs’ contingent liabilities are more than 12 times their balance sheet size and constituted 55.3 per cent of the banking system’s total off-balance sheet (OBS) exposures (Chart IV.8b). 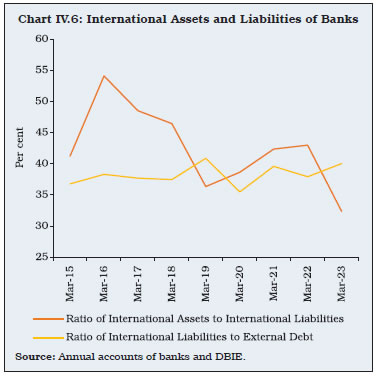 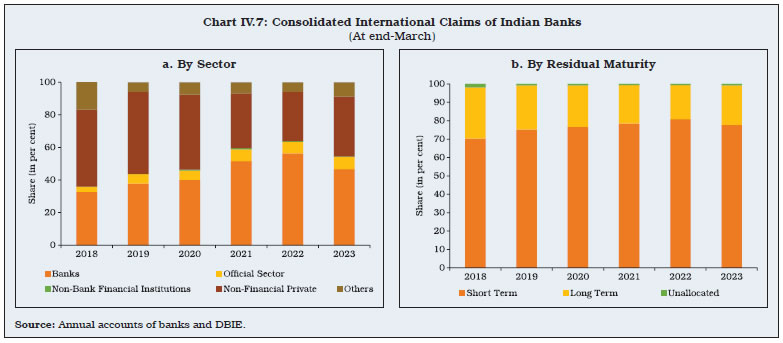 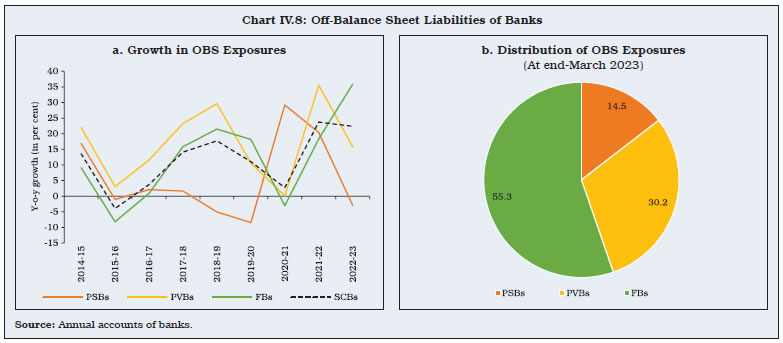 IV.16 The trend of improvement in the profitability of SCBs, which began in 2019-20, continued for the fourth consecutive year in 2022-23, aided by higher income and lower provisions and contingencies. Both return on assets (RoA) and return on equities (RoE) improved in 2022-23. (Chart IV.9). IV.17 Interest expended by SCBs had contracted for two consecutive years (2020-21 and 2021-22) reflecting the accommodative monetary policy stance. With a turn in the interest rate cycle, both interest income and interest outgo rose in 2022-23; as the expansion in interest income exceeded interest outgo, net interest income in 2022-23 was higher than in the previous year (Table IV.4). 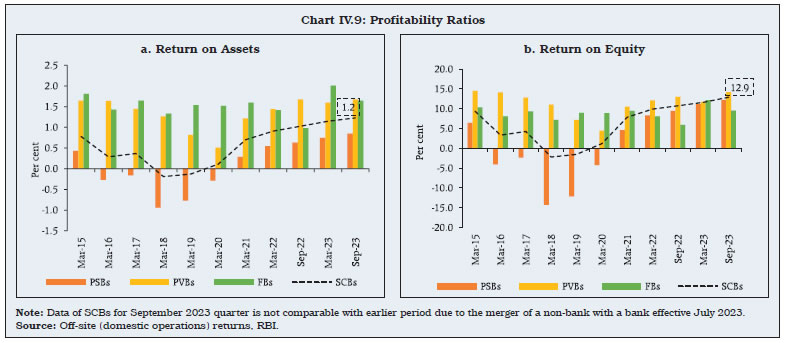 IV.18 Supervisory data indicate that interest income from loans and advances grew by 24.0 per cent during 2022-23 and by 14.6 per cent from investments. On other hand, the interest expended rose by 18.1 per cent5. On balance, the NIM of banks increased by 36 bps to reach 3.8 per cent in 2022-23 (Chart IV.10). IV.19 During 2022-23, risk provisions of SCBs declined on account of lower slippages as also higher write-offs, upgradations and recoveries. This boosted banks’ net profits6, along with support from higher earnings (Chart IV.11a). Moreover, as asset quality improved, the provision coverage ratio (PCR) (without write-off adjusted) rose to 75.3 per cent by end-September 2023 (Chart IV.11b). 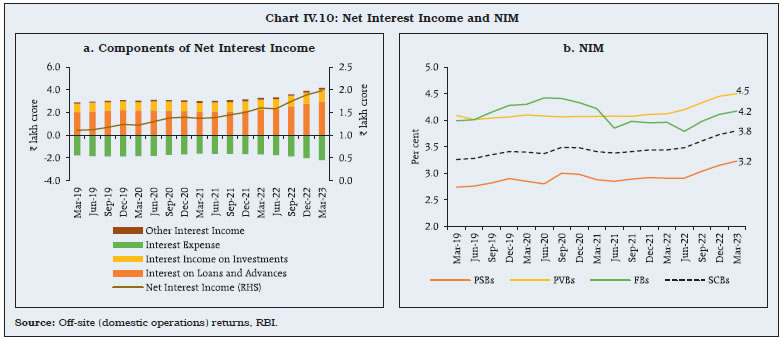 IV.20 The spread between return on funds and cost of funds increased for SCBs. SFBs had wider spreads relative to other bank groups, reflecting relatively higher interest rates on advances (Table IV.5). 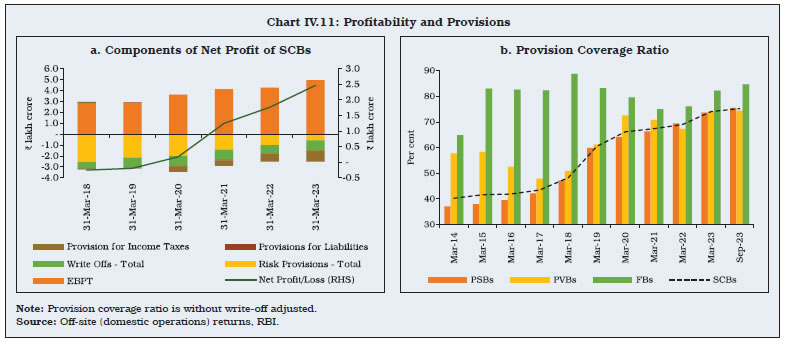 IV.21 During 2022-23, SCBs strengthened their capital buffers, improved asset quality and maintained sufficient liquid assets. At end-March 2023, there was no bank under the prompt corrective action (PCA) framework as compared to one at end-March 2022. 4.1 Capital Adequacy IV.22 The capital to risk-weighted assets ratio (CRAR) as well as Tier I capital ratio of SCBs has been rising gradually over time. Although all bank groups remained well-capitalised, the CRAR of PVBs declined marginally due to a higher increase in their risk-weighted assets (RWAs) vis-à-vis their capital funds (Table IV.6). Supervisory data indicate that the CRAR of SCBs reached 16.8 per cent at end-September 2023. 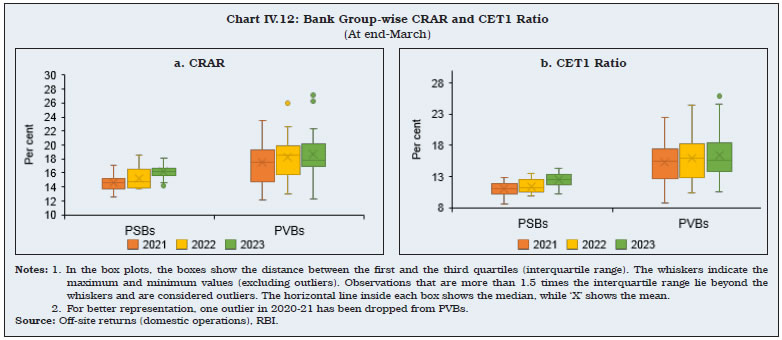 IV.23 At end-March 2023, all bank groups met the regulatory requirement of CRAR and common equity tier 1 (CET1) ratio. Although the divergence in capital positions of banks narrowed for bank groups, PVBs continued to have higher dispersion than PSBs. The first quartiles of PVBs’ CRAR and CET1 ratios were higher than PSBs’ third quartiles, mirroring stronger capital buffers of the former (Chart IV.12 a and b). IV.24 The resources raised by banks through private placements of debt, qualified institutional placements and preferential allotments of equity accelerated for the second consecutive year during 2022-23. Although the number of issues by PSBs declined during 2022-23, the total amount raised increased (Table IV.7). 4.2 Leverage and Liquidity IV.25 The leverage ratio (LR) — Tier 1 capital as a proportion of total exposures — is a non-risk based backstop measure which complements the Basel III risk-based capital framework. Domestic systemically important banks (D-SIBs) in India are required to maintain it at 4 per cent and other banks at 3.5 per cent vis-à-vis the Basel III recommendation of 3 per cent. At end-March 2023, all bank groups met the minimum requirement (Table IV.8). IV.26 The liquidity coverage ratio (LCR) is designed to ensure that banks hold a sufficient reserve of high-quality liquid assets (HQLAs) to enable them to survive a period of significant liquidity stress lasting 30 calendar days. At end-March 2023, all bank groups held significantly higher HQLAs than the stipulated requirement of 100 per cent of 30 days’ net cash outflows (Table IV.8). IV.27 The net stable funding ratio (NSFR) – the ratio of available stable funding to the required stable funding – limits overreliance of banks on short-term wholesale funding, encourages better assessment of funding risk across all on- and off-balance sheet items, and promotes funding stability. In line with international standards, banks in India are required to maintain NSFR at a minimum of 100 per cent. At end-March 2023, all bank groups met this target (Table IV.9). 4.3 Non-Performing Assets IV.28 The improvement in asset quality of banks, measured by their GNPA ratios, that began in 2018-19 continued during 2022-23. The GNPA ratio of SCBs fell to a decadal low of 3.9 per cent at end-March 2023 and further to 3.2 per cent at end-September 2023. During 2022-23, around 45 per cent of reduction in GNPAs of SCBs was contributed by recoveries and upgradations (Table IV.10). IV.29 The slippage ratio — which measures new accretions to NPAs as a share of standard advances at the beginning of the year — moderated during 2022-23 and further in H1:2023-24 (Chart IV.13a). A mix of write-offs, upgradations and recoveries contributed to reduction in NPAs (Chart IV.13b). 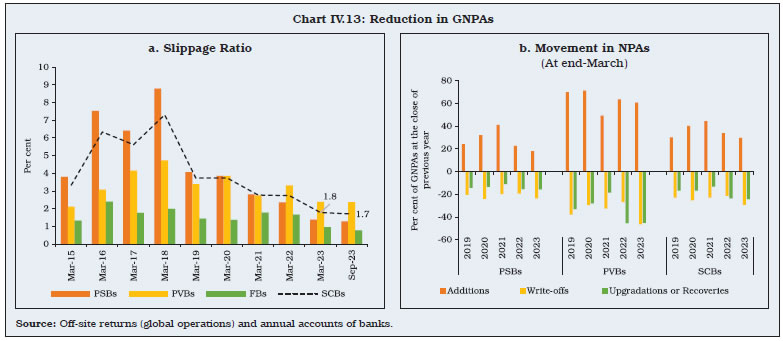 IV.30 The increase in the proportion of standard assets to total advances was sustained for all bank groups during 2022-23. The amount of NPAs decreased for all bank groups, except SFBs (Table IV.11). IV.31 The share of large borrowal accounts (accounts with total exposure of ₹5 crore and above) in total advances declined to 46.4 per cent at end-March 2023 from 47.8 per cent a year ago. Their contribution to total NPAs also fell during the year to 53.9 per cent from 64.0 per cent. The SMA-1 and SMA-2 ratios, which indicate potential stress, declined across bank groups for overall as well as large borrowal accounts (Chart IV.14). IV.32 In retrospect, the pandemic’s impact was less than initially feared for larger and industrial sector firms. Moreover, the impact across firms and sectors was transient (Box IV.1). 
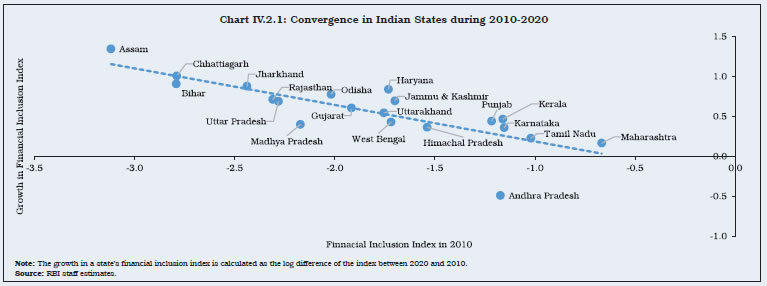
IV.33 Following the Reserve Bank’s resolution frameworks 1.0 and 2.0 announced in response to COVID-19 related disruptions, the number of restructured accounts peaked in 2021-22. With this special dispensation coming to an end, they moderated in 2022-23 (Chart IV.15a). The share of restructured standard advances (RSA) in gross loans and advances decreased from 1.8 per cent at end-March 2022 to 1.2 per cent at end-March 2023, led by PVBs (Chart IV.15b). 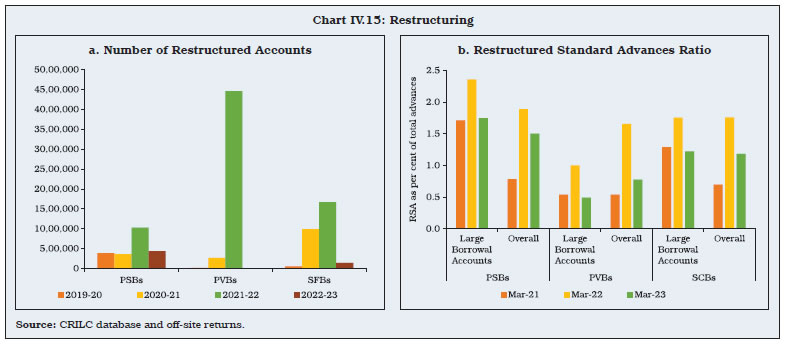 4.4 Recoveries IV.34 Amongst the multiple channels through which banks resolve their stressed assets, debt recovery tribunals (DRTs) witnessed the highest growth rate in the number of referred cases as also the amount involved during 2022-23. After a sharp increase in the previous year, referred cases as well as amount involved contracted for cases under the Securitisation and Reconstruction of Financial Assets and Enforcement of Security Interest (SARFAESI) Act. The Insolvency and Bankruptcy Code (IBC) remained the dominant mode of recovery, with a share of 43.0 per cent in the total amount recovered in 2022-23 and the recovery rate also improved (Table IV.12). IV.35 Apart from recovery through various resolution mechanisms, banks also clean up their balance sheets through sale of NPAs to asset reconstruction companies (ARCs). Sales to ARCs shot up in 2022-23, partly reflecting assets sold to the newly operationalised National Assets Reconstruction Company Ltd (NARCL). During 2022-23, 9.7 per cent of the previous year’s stock of SCBs’ GNPAs was sold to ARCs as compared with only 3.2 per cent in 2021-22 (Chart IV.16a). On the other hand, the acquisition cost of ARCs as a proportion to book values of assets declined from 33 per cent at end-March 2022 to 29.8 per cent at end-March 2023 (Chart IV.16b). 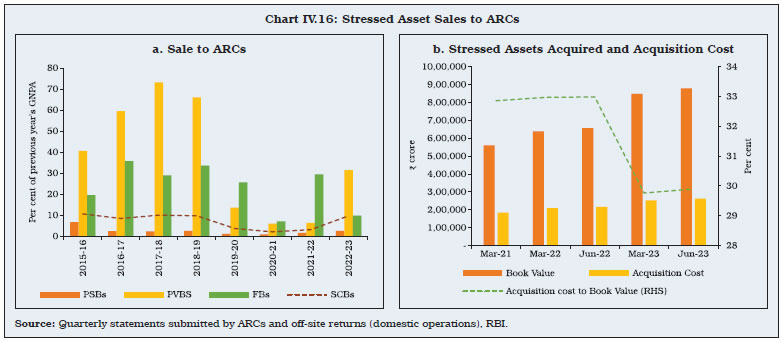 IV.36 The share of SRs subscribed by banks and FIs has steadily declined from 65.4 per cent at end-March 2021 to 60.6 per cent at end-March 2023. The amount of SRs completely redeemed, an indicator of recovery through this mode, increased further during the year (Table IV.13). 4.5 Frauds in the Banking Sector IV.37 Frauds lead to reputational, operational and business risk for banks and undermine customers’ trust in the banking system with financial stability implications. During 2022-23, the total amount of frauds reported by banks declined to a six-year low while the average amount involved in frauds was the lowest in a decade (Appendix Table IV.7). In H1:2023-24, although the number of frauds reported rose over the corresponding period a year ago, the amount involved was only 14.9 per cent of the previous year’s amount (Table IV.14). IV.38 Based on the date of occurrence of frauds, the average amount involved declined during 2022-23, with the number of cases concentrated in card or internet related frauds (Table IV.15). IV.39 The number of fraud cases reported by PVBs accounted for 66.2 per cent of the total (Chart IV.17a). In terms of amount involved, PSBs had a higher share (Chart IV.17b). While the majority of the frauds in PSBs were related to advances, PVBs accounted for a majority of card/internet and cash-related cases (Chart IV.17c). 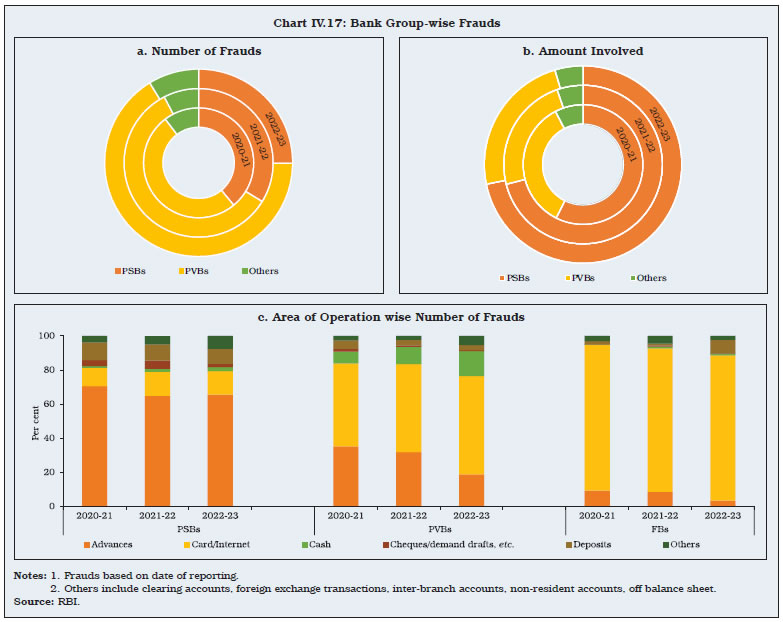 4.6 Enforcement Actions IV.40 The increase in instances of penalties imposed on regulated entities (REs) during 2022-23 was led by co-operative banks. For both PSBs and PVBs, they declined during the year. The average penalty per instance was the highest for PVBs (Table IV.16). 5. Sectoral Bank Credit and NPAs IV.41 The acceleration in gross bank credit during 2022-23 was led by personal loans and credit extended to the services sector. Within personal loans, the growth in credit card receivables, which are a form of unsecured lending, rose sharply. Services sector credit was driven by lending to NBFCs (Table IV.17). IV.42 The GNPA ratio remained the highest for the agricultural sector and the lowest for retail loans as at end-September 2023. The asset quality of the industrial sector improved further, with its GNPA ratio at 4.2 per cent at end-September 2023. The variation of asset quality between bank groups has narrowed over the years (Chart IV. 18). IV.43 The improvement in asset quality during 2022-23 was broad-based across industries, with notable gains in mining and quarrying, construction, engineering and basic metals. The gems and jewellery industry has the highest GNPA ratio due to legacy issues (Chart IV.19). 5.1 Credit to the MSME Sector IV.44 Credit to micro and small enterprises had accelerated during 2020-21 and 2021-22, reflecting benefits under the Emergency Credit Line Guarantee Scheme (ECLGS) launched in May 2020. Although the growth rate decelerated subsequently, it remained higher than the credit growth to large industries (Chart IV.20). Within industry, the reduction in the GNPA ratio of large industries from 22.9 per cent at end-March 2018 to 4.6 per cent at end-June 2023 was noteworthy (Chart IV.21). 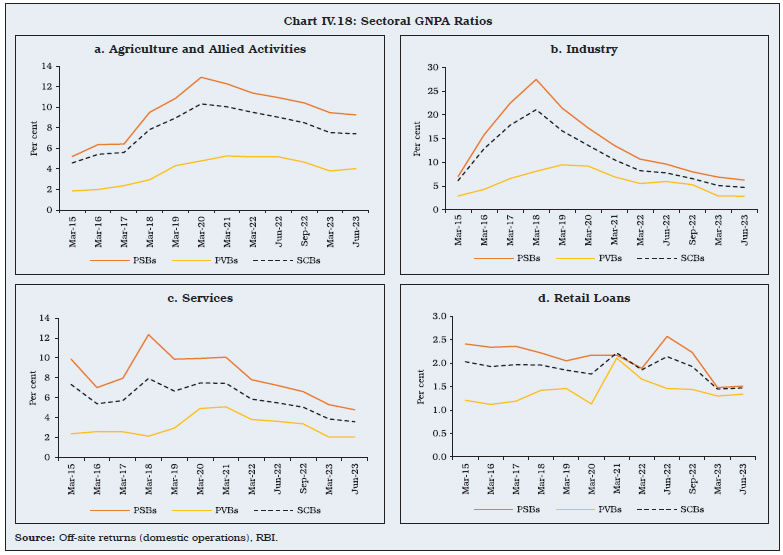 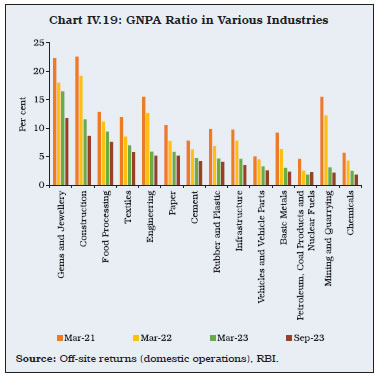 IV.45 Reversing the movements over the previous four consecutive years, PSBs’ credit growth to the MSME sector in 2022-23 exceeded that of PVBs. This led to an increase in the former’s share in total MSME credit from 47.5 per cent in 2021-22 to 48.0 per cent in 2022-23. The average amount of loans extended by PVBs was almost double that of PSBs (Table IV.18). 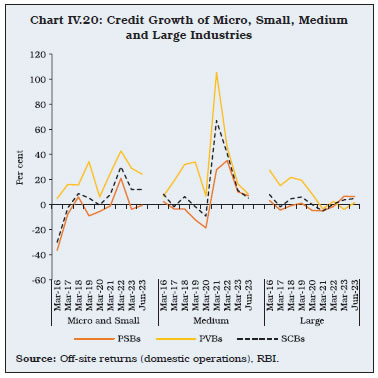 5.2 Priority Sector Credit IV.46 In recent years, PVBs’ overall credit growth was higher than that of PSBs. As a result, PVBs were required to accelerate their priority sector lending to meet regulatory requirements. During 2022-23, total priority sector advances grew by 10.8 per cent, led by PVBs (growth rate of 15.7 per cent). In comparison, the priority sector lending of PSBs grew by 7.1 per cent. 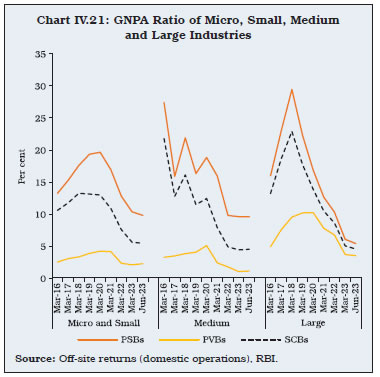 IV.47 All bank groups managed to achieve their overall priority sector lending targets. However, shortfall was found in non-corporate individual farmers sub-category by FBs10, and PVBs fulfilled their target only for micro enterprises (Table IV.19). Growth in the amount outstanding under operative kisan credit cards (KCC) decelerated in 2022-23 to 8.8 per cent. The slowdown was mainly contributed by northern and eastern regions (Appendix Table IV.8). IV.48 Growth in the total trading volume of priority sector lending certificates (PSLCs) decelerated during 2022-23. Except for the general category, the trading volume of PSLCs increased for all segments and was the highest in the small and marginal farmers (SMF) category (Table IV. 20). 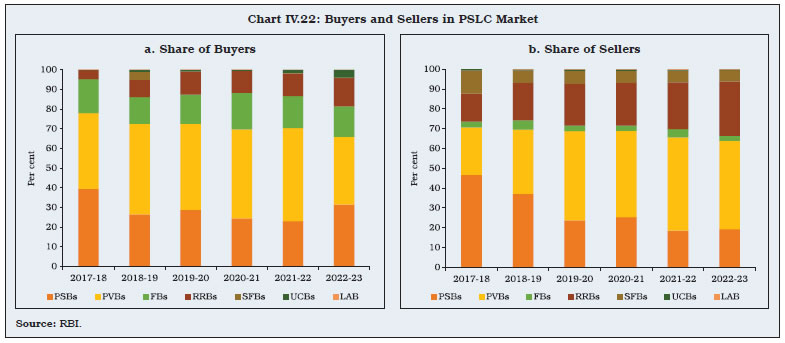 IV.49 In the last four years, PVBs have outpaced PSBs as sellers of PSLCs (Chart IV.22). IV.50 During 2022-23 and H1:2023-24, the weighted average premium (WAP) decreased for all categories of PSLCs, with PSLC-SMF commanding the highest premium (Table IV.21). IV.51 The GNPA ratio related to priority sector lending declined from 7.4 per cent at end-March 2022 to 5.6 per cent by end-March 2023. Nonetheless, the share of the priority sector in total GNPA of SCBs increased from 43.2 per cent at end-March-2022 to 51.2 per cent at end-March 2023 as NPAs in the non-priority sector declined more sharply. NPAs in the priority sector were led by agricultural defaults. IV.52 While PSBs extended 43.7 per cent of their ANBC/CEOBE to the priority sector, this portfolio contributed to 56.2 per cent of their total NPAs. Priority sector comprises of 88.2 per cent of SFBs’ ANBC/CEOBE, but its share in total NPAs has fallen significantly to 43.2 per cent in 2022-23 from 89.9 per cent in the previous year (Table IV.22). 5.3 Credit to Sensitive Sectors IV.53 SCBs’ exposure to sensitive sectors – real estate and capital markets – rose at a faster pace during 2022-23 and accounted for 24.3 per cent of their total loans and advances. Lending to the real estate sector picked up for both PSBs and PVBs (Chart IV.23a). On the other hand, capital market exposure of PSBs decelerated (Chart IV.23b and Appendix Table IV.9). 5.4 Unsecured Lending IV.54 Unsecured loans − characterised by absence or inadequacy of collateral − present a higher credit risk for banks in the event of defaults. The share of unsecured advances in total credit of SCBs has been increasing since end-March 2015, reaching 25.5 per cent by end-March 2023. More than 50 per cent of loans by FBs are unsecured, while the share is lower at 27.3 per cent and 22.6 per cent for PVBs and PSBs, respectively (Chart IV.24). The Reserve Bank’s November 2023 measures to increase risk weights on select categories of consumer credit exposure need to be seen in this evolving milieu. 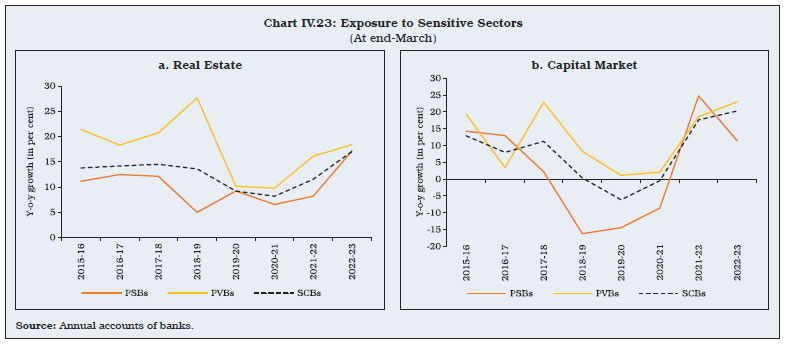 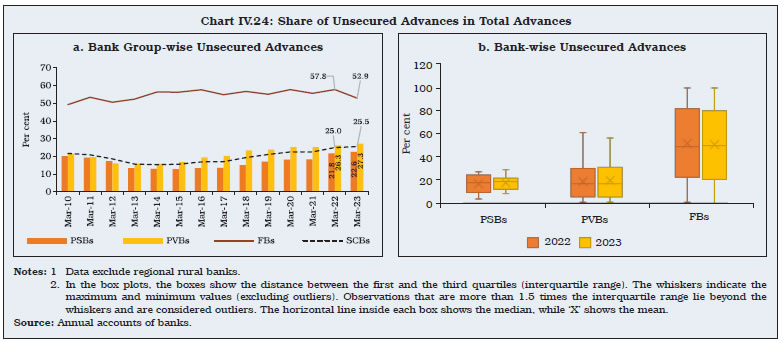 5.5 Borrower Age Profile IV.55 Data sourced from the TransUnion Credit Information Bureau (India) Limited (CIBIL) suggest that 53.1 per cent of retail borrowers were in the 25-45 years age bracket at end-September 2023 (Chart IV.25). 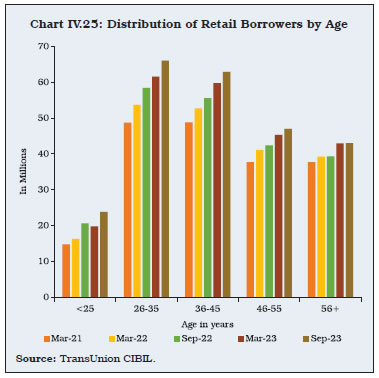 6. Ownership Patterns in Commercial Banks IV.56 The ownership pattern of PVBs underwent a change during 2022-23, with a decline in government ownership particularly in Jammu & Kashmir Bank and an increase in the share of institutional investors such as insurance companies, mutual funds, banks and financial institutions, notably in Karur Vysya Bank and in Yes Bank (Chart IV.26 and Appendix Table IV.10). In the case of PSBs, government ownership remained unchanged at 90.5 per cent of paid-up equity share capital. 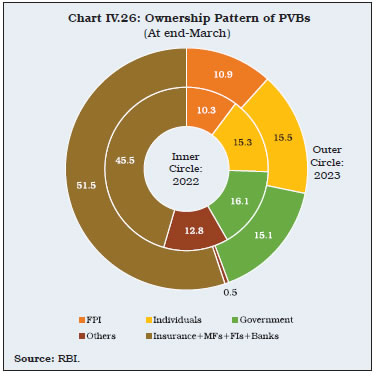 IV.57 As the asset quality of PSBs has improved, the requirement of capital infusion by the government has declined (Chart IV.27). IV.58 In the aftermath of the global financial crisis of 2007-09, regulatory reforms in corporate governance have focused on, inter alia, effective board oversight, rigorous risk management, strong internal controls, and compliance. On April 26, 2021 the Reserve Bank issued instructions aimed at achieving robust and transparent risk management and decision-making in banks, thereby promoting public confidence and upholding the safety and soundness of the financial system11. 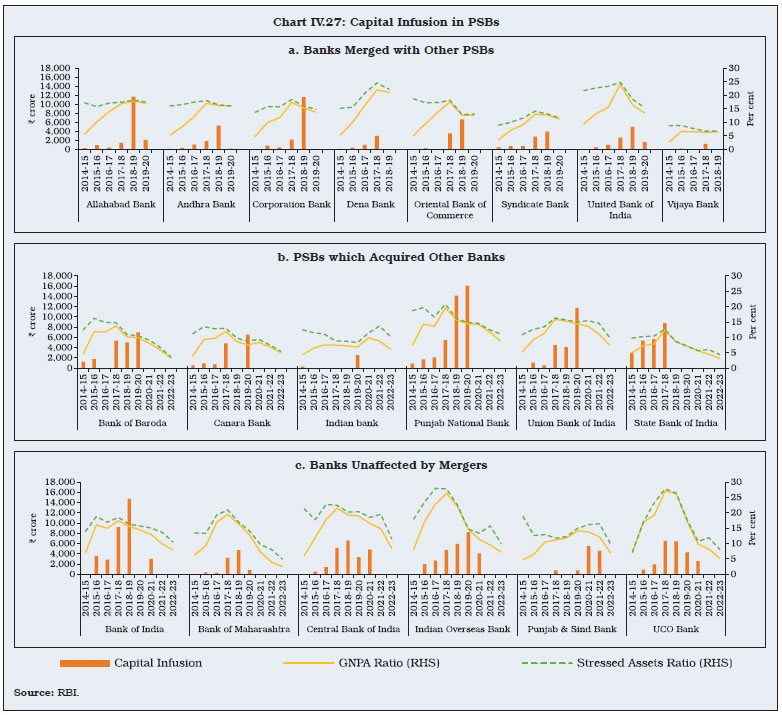 7.1 Composition of Boards IV.59 Apart from providing checks and balances, independent directors often bring unbiased views, diverse experiences, and expertise to the board and contribute to effective risk management. In the case of PVBs and SFBs, the share of independent directors in the Board and its committees (except for Nomination and Remuneration Committee (NRC) in PVBs) improved in 2022-23 (Table IV.23). IV.60 As per the Reserve Bank’s directions, banks are required to constitute a Risk Management Committee of the Board (RMCB), with a majority of non-executive directors (NED). The chair of the Board may be a member of the RMCB only if he/she has the requisite risk management expertise. The proportion of PVBs where the chair is not a member of the RMCB decreased from 39 per cent at end-March 2022 to 38 per cent at end-March 2023. For SFBs, the proportion decreased from 50 per cent to 42 per cent during the same period. 7.2 Executive Compensation IV.61 Linking the variable component of management compensation to annual performance indicators may inadvertently shift focus to short-term gains at the expense of long-term stability. In order to maintain a balance between such myopia and an incentive-based compensation structure, the Reserve Bank’s revised guidelines require that at least 50 per cent of the total compensation should be variable12. The share of variable pay (VP) in total remuneration (TR) for PVBs increased from 31 per cent at end-March 2021 to 39 per cent at end-March 202213. For SFBs, it increased marginally from 25 per cent to 26 per cent during the same period. At end-March 2022, the share of non-cash component in the VP for PVBs and SFBs decreased to 57 per cent and 34 per cent, from 78 per cent and 41 per cent in the previous year, respectively14. IV.62 The disparity in remuneration between top executives and average employees may induce risk-taking behaviour and can be detrimental to the long-term objectives of the institution. In the context of Indian banks, the gap is the widest in the case of SFBs (Table IV.24). 8. Foreign Banks’ Operations in India and Overseas Operations of Indian Banks IV.63 After a steady rising trend from March 2006 to reach 46 at end-March 2020, the number of FBs in India declined to 44 at end-March 2023. The number of FBs’ branches also declined for the second consecutive year during 2022-23, reflecting rationalisation for cost optimisation (Table IV.25). IV.64 Rationalisation of PSBs’ overseas presence by closing non-viable branches and consolidating operations in the same geography has gathered focus since 2018 to improve cost efficiencies and synergies15. Accordingly, PSBs have shutdown 65 overseas bank branches during the last five years (March 2018 to March 2023). During the same period, PVBs have also reduced their overseas bank branches from 20 to 13 (Chart IV.28 and Appendix Table IV.11). 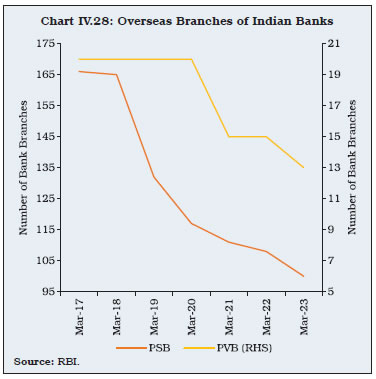 9. Payment Systems and Scheduled Commercial Banks IV.65 In recent years, India has emerged as a world leader in developing and adopting new technologies in the digital payments landscape. This has been evident not only in terms of growth in digital payments but also in availability of a bouquet of safe, secure, innovative and efficient payment systems. India’s Digital Public Infrastructure (DPI) and its unique open model has been a cornerstone of this transformation. The recognition of the importance of DPI as a priority under India’s G20 presidency at the multilateral forum is expected to further aid its development and deployment. IV.66 In order to enhance the ease of transactions, the upper limit for small value digital payments in offline mode was increased from ₹200 to ₹500 in August 2023. Additionally, ‘Har Payment Digital’ mission was launched during the Digital Payments Awareness Week (DPAW), March 2023 to reinforce the Reserve Bank’s commitment to deepen penetration of digitalisation in the country. 9.1 Digital Payments IV.67 Digital modes of payments are increasingly replacing conventional paper-based instruments such as cheques and demand drafts, with the latter now constituting a negligible share in total payments. In October 2023, 99.6 per cent of total payments in terms of volume and 97.1 per cent in terms of value were made via digital modes (Chart IV.29). IV.68 The growth in volume of total payments decelerated to 57.8 per cent (19.2 per cent in terms of value) during 2022-23 from 63.8 per cent (23.1 per cent in terms of value) during 2021-22 as the post-COVID-19 base effect waned (Table IV.26). Amongst the various options available, the Unified Payments Interface (UPI) has the majority share in volume of transactions, while RTGS, which facilitates high-value transactions on real time basis, accounted for the largest share in terms of value. IV.69 The Reserve Bank launched a composite Digital Payments Index in January 2021 to capture the extent of digitalisation of payments across the country. The index is based on five broad parameters, viz., payment enablers; payment performance; consumer centricity; and demand and supply side factors of payment infrastructure. It is computed semi-annually with March 2018 as the base. At end-March 2023, the index stood at 395.6 as compared to 377.5 at end September 2022, driven by enhanced payment infrastructure and performance. 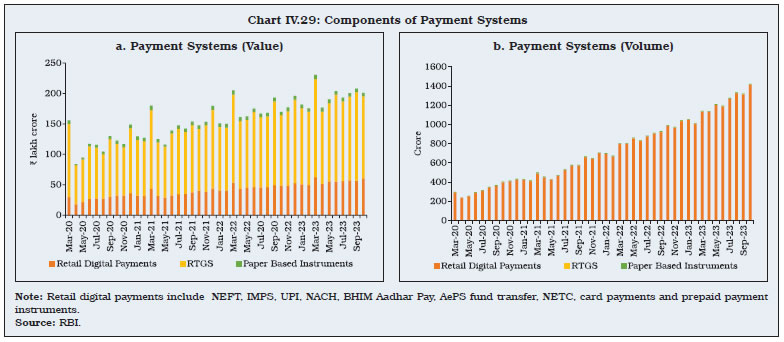 9.2 ATMs IV.70 During 2022-23, the total number of Automated Teller Machines (ATMs) (on-site and off-site) grew by 3.5 per cent, primarily driven by increase in the number of white-label ATMs (WLAs). Amongst the ATMs operated by SCBs at end-March 2023, the share of PSBs and PVBs was 63 per cent and 35 per cent, respectively (Table IV.27 and Appendix Table IV.12). IV.71 At end-March 2023, ATMs of PSBs were more evenly distributed across geographies than other bank groups whose ATMs were skewed towards urban and metropolitan areas. In contrast, a majority (51 per cent) of WLAs were concentrated in rural areas (Table IV.28). IV.72 Consumer education and protection is an integral component of the Reserve Bank’s full-service central banking function. Towards this end, technology is being extensively leveraged to enhance efficiencies in the grievance redressal mechanism. 10.1 Grievance Redressal IV.73 During 2022-23, the number of complaints received under the Reserve Bank - Integrated Ombudsman Scheme (RB-IOS) increased by 68.2 per cent, partly due to simplification of procedures for lodging of complaints. Of the 7,03,544 complaints received against REs, 33.4 per cent were handled by the Office of Reserve Bank of India Ombudsmen (ORBIOs) and the rest were disposed at the Centralised Receipt and Processing Centre (CRPC). The number of complaints against REs dealt at the ORBIOs declined y-o-y by 22.9 per cent in 2022-23 due to structural changes in the Ombudsman framework which led to filtering out of non-maintainable complaints at the level of CRPC and on the Complaint Management Portal. Majority of the complaints received at the ORBIOs during the year pertained to banks (83.8 per cent) (Chart IV.30). IV.74 Under the RB-IOS, effective November 2021, complaint categories were rationalised to make deficiency in service the sole ground for lodging a complaint. Consequently, data on nature of complaints are not strictly comparable across the financial years. During 2022-23, grievances related to loans and advances against banks, NBFCs and other REs accounted for more than one-fourth of the overall complaints received. The share of the top five categories, consisting of complaints received for loans and advances, mobile/ electronic banking, deposit accounts, credit cards and ATM/ debit cards, increased from 54.7 per cent during 2021-22 to 85.8 per cent during 2022-23 (Table IV.29). 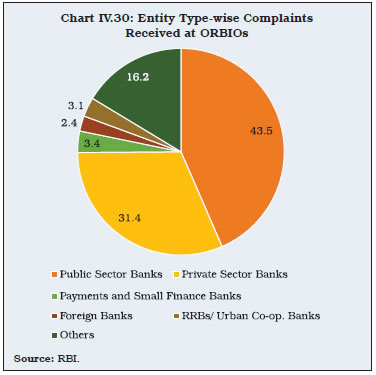 IV.75 The share of complaints from urban, semi-urban and rural areas saw an uptick during the year, partly reflecting intensive public awareness programmes conducted across the country (Chart IV.31a). For both PSBs and PVBs, complaints related to ATM/ debit cards/ credit cards constituted the highest share during 2022-23, followed by mobile/ electronic banking related grievances in case of PSBs and complaints concerning loans and advances in case of PVBs (Chart IV.31b and Appendix Table IV.13). 10.2 Deposit Insurance IV.76 Deposit insurance extended by the Deposit Insurance and Credit Guarantee Corporation (DICGC) is an important financial safety net which helps preserve public confidence, especially of small depositors. The scheme covers all commercial banks, including LABs, PBs, SFBs, RRBs and co-operative banks with an insurance cover limit of ₹5 lakh per deposit account. As on March 31, 2023 depositors of 2,026 banks (139 commercial banks and 1,887 co-operative banks) were insured under the scheme (Table IV.30). 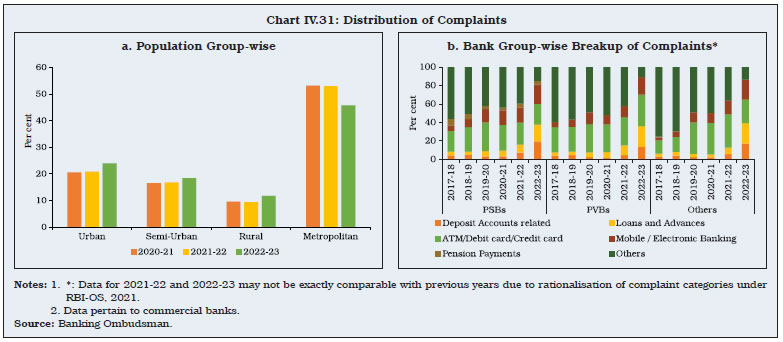 IV.77 Under the extant coverage limit, 98.1 per cent of the total number of accounts were fully insured at end-March 2023. The share of insured deposits in total assessable deposits increased at end-March 2020 as the insurance cover limit per account was raised from ₹1 lakh to ₹5 lakh. The share of insured deposits moderated during 2022-23 due to an increasing share of deposits with outstanding balance of more than ₹5 lakh (Chart IV.32). IV.78 The Deposit Insurance Fund (DIF) is utilised to settle the claims of the insured depositors of banks in the event of imposition of all-inclusive directions (AID)/liquidation/merger/amalgamation16. DIF balance stood at ₹1,69,602 crore at end-March 2023, recording a y-o-y growth of 15.5 per cent. The reserve ratio (RR) increased from 1.80 per cent at end-March 2022 to 2.0 per cent at end-March 202317. The DICGC has the mandate to recover insurance pay-outs under Section 21 of DICGC Act, 1961 and rules framed thereunder. During the year, the DICGC made a total recovery of claims amounting to ₹883 crore from 83 banks, of which ₹233 crore was recovered from six UCBs placed under AID as against ₹399 crore recovered during 2021-22. 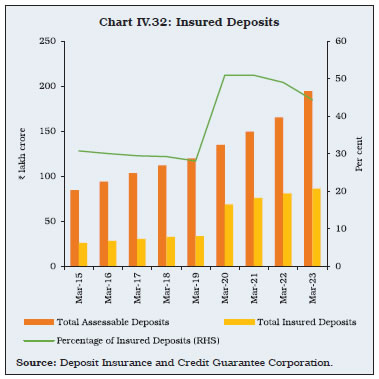 IV.79 Financial inclusion is a catalyst of balanced growth. The Reserve Bank’s recent initiatives have been aimed at ensuring that the benefits of financial inclusion reach every stratum of society. The Reserve Bank continued to conduct Financial Literacy Week (FLW) to deepen financial education and awareness, with stress upon ‘Good Financial Behaviour - Your Saviour’ in 2022-23. IV.80 The consistent progress in financial inclusion in the country is evident in the increase in bank branches per 1,00,000 adults. This was complemented by rapid digitalisation in banking services and an expanding network of business correspondents (BCs). This was in contrast to G20 peers where an increase in digitalisation has not been accompanied by more bank branches (Chart IV.33a). The per capita ATM deployment has more than doubled in the last decade (Chart IV.33b). IV.81 Since the introduction of the Pradhan Mantri Jan Dhan Yojana (PMJDY) in 2014, the number of accounts held by both men and women in the household sector – especially loan accounts – has been steadily increasing. Although there are fewer women-owned loan and deposit accounts in comparison with their male counterparts, the former have been increasing at a much faster pace. Between 2015 and 2023, women-owned deposit and loan accounts registered a compound annual growth rate (CAGR) of 10.3 per cent and 18.1 per cent, respectively, while men-owned deposit and loan accounts grew by 6.9 per cent and 9.2 per cent, respectively (Chart IV.34a and b). IV.82 To extend the benefit of financial services and literacy to more citizens, the Reserve Bank initiated setting up of 75 Digital Banking Units (DBUs) in 75 districts, especially in villages and small towns in April 2022. DBUs are brick-and-mortar outlets equipped with infrastructure to execute banking functions such as opening of accounts, accessing government schemes, and making transactions digitally. By mid-December 2023, there were 96 DBUs in the country with the largest presence in Tamil Nadu (Chart IV.35). 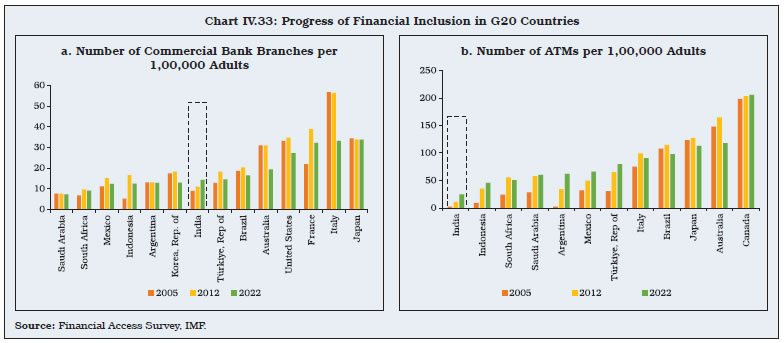 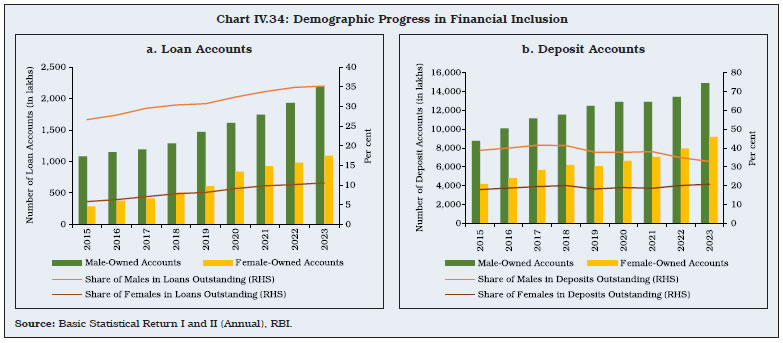 11.1 Financial Inclusion Plans IV.83 Financial Inclusion Plans (FIPs) introduced by the Reserve Bank in 2010 serve as an important yardstick for measuring the progress of banks with respect to financial inclusion. The BC model has been crucial in expanding financial inclusion at the grassroots level. This is evident from the higher share of basic saving bank deposit accounts (BSBDAs) continuing to be channelised through the BCs. Similarly, the value of transactions through the Business Correspondents – Information and Communication Technology (BC-ICT) model grew by 26 per cent during 2022-23, up from 6.5 per cent during 2021-22 (Table IV.31). 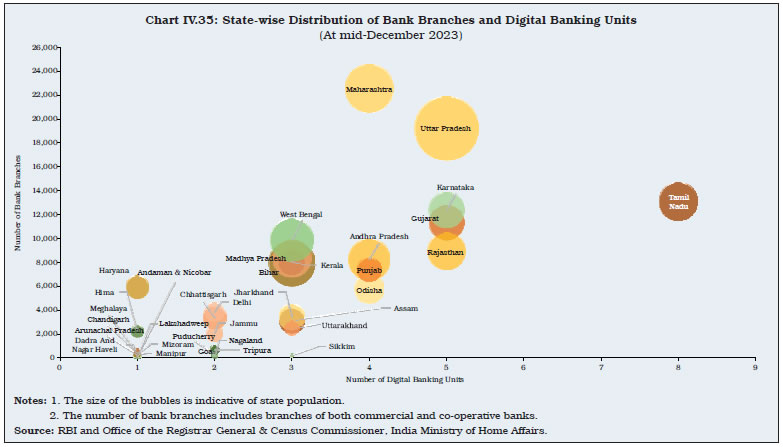 11.2 Financial Inclusion Index IV.84 The Reserve Bank has constructed a multi-dimensional composite Financial Inclusion Index (FI-Index) based on 97 indicators, including availability, ease of access, usage, distribution and efficiency in services, financial literacy, and consumer protection to effectively monitor and quantify the progress of policy initiatives undertaken to promote financial inclusion. On a scale of 0 to 100, the annual FI-Index with three sub-indices, viz., ‘FI-access’, ‘FI-usage’, and ‘FI-quality’, stood at 60.1 in March 2023 vis-à-vis 56.4 in March 2022, with growth witnessed across all sub-indices, especially in usage and quality. 11.3 Pradhan Mantri Jan Dhan Yojana (PMJDY) IV.85 The PMJDY envisages universal access to banking facilities, credit, insurance, pension and financial literacy. At end-August 2023, there were 50.3 crore PMJDY accounts. The decelerating trend in the growth of new PMJDY accounts witnessed since August 2019 was reversed in August 2023. Close to two-thirds of PMJDY accounts were in rural and semi-urban areas, with the majority maintained by PSBs and RRBs. 11.4 New Bank Branches by SCBs IV.86 New bank branches opened by SCBs increased to 5,308 in 2022-23 from 3,254 in 2021-22, primarily due to PVBs expanding their reach in smaller cities (Table IV.32). PSBs’ new branch additions were led by openings in rural areas (Chart IV.36). 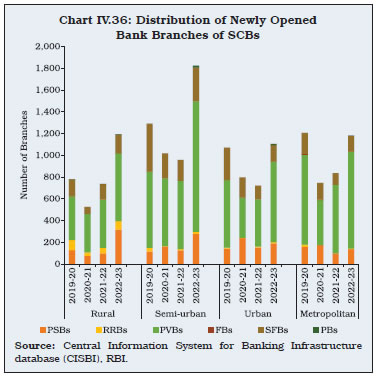 11.5 Microfinance Programme IV.87 Microfinance involves extension of financial services, including small loans and savings accounts, to individuals or groups, often in underserved or economically disadvantaged areas. The Self-Help Group – Bank Linkage Programme (SHG-BLP) provides savings, credit and other facilities to the financially excluded poor. At end-March 2023, 16.2 crore rural households were covered under the SHG-BLP. During 2022-23, close to 43 lakh SHGs availed loans from banks as compared with 34 lakh SHGs in 2021-22, with outstanding loans growing at 25 per cent during the year (Appendix Table IV.14). In terms of savings-linked SHGs, all regions witnessed growth during 2022-23, barring the southern region due to programme saturation as it had the highest share of savings linked SHGs during 2022-23 (31 per cent). This was followed by the eastern region (29.3 per cent) and the western region (14.4 per cent). The NPA ratio of bank loans to SHGs declined to 2.8 per cent at end-March 2023 from 3.8 per cent at end-March 202218. IV.88 Joint Liability Groups (JLGs) are informal credit groups of small borrowers formed for availing bank loans on an individual basis or through group mechanisms against mutual guarantees. It serves as a substitute for collateral for loans to be provided to the target group. During 2022-23, banks extended loans to 70 lakh JLGs as compared with 54.1 lakh JLGs during 2021-22. During 2022-23, the amount of loans disbursed by banks to JLGs increased by 18.3 per cent as against 93.4 per cent a year ago (Appendix Table IV.14). 11.6 Trade Receivables Discounting System (TReDS) IV.89 TReDS, an initiative undertaken by the Reserve Bank in 2014, is an online platform that allows MSME suppliers to discount their invoices and receive payments before their due date by ensuring the conversion of their trade receivables into liquid funds in a short period. During 2022-23, the number of registered MSME sellers increased by nearly 51 per cent, while the number of buyers (corporates/other buyers, including government departments/ public sector undertakings) increased by 35 per cent, pointing towards improving participation on the platform. The number of invoices uploaded and financed on TReDS grew by more than 56 per cent during 2022-23, with the success rate remaining steady at 94 per cent19 (Table IV.33). 11.7 Regional Banking Penetration IV.90 At end-March 2023, the southern region had the highest number of bank branches, followed by the central region. The population per bank branch was the highest for the eastern and central regions (Chart IV.37). IV.91 States with lower financial inclusion records have seen faster progress, narrowing the inter-regional inequalities (Box IV.2). 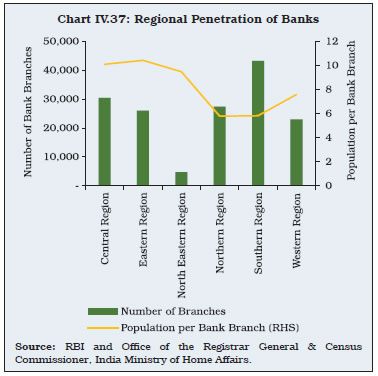
IV.92 At end-March 2023, there were 43 RRBs sponsored by 12 SCBs with 21,995 branches, 30.6 crore deposit accounts and 2.9 crore loan accounts in 26 States and 3 Union Territories (Puducherry, Jammu and Kashmir and Ladakh). These banks offer a wide range of banking and financial products tailored to the unique needs of rural communities. 92 per cent of RRB branches are in rural/semi-urban areas. The southern region has the highest number of RRBs, followed by the eastern region (Appendix Table IV.15). RRBs’ total business size, i.e., deposits plus credit stood at ₹10.2 lakh crore as on 31 March 2023 with a y-o-y growth of 10.1 per cent. 12.1 Balance Sheet Analysis IV.93 The growth in the consolidated balance sheet of RRBs accelerated during 2022-23. With the expansion in loans and advances outpacing deposit growth, the RRBs raised more resources through borrowings, largely from the National Bank for Agriculture and Rural Development (NABARD) and sponsor banks. During 2022-23, the share of NABARD and sponsor banks in their total borrowings was 90.3 per cent (96.0 per cent in the preceding year). IV.94 The total recapitalisation assistance to RRBs sanctioned during 2021-22 and 2022-23 was ₹10,890 crore, which was more than the total capital infusion of ₹8,393 crore by all stakeholders over a period of 45 years20 (1975 to 2021). The recapitalisation included proportionate share capital contributions by state governments (15 per cent) and sponsor banks (35 per cent) which helped shore up the share capital of RRBs. Their reserves also grew due to internal accruals from profits (Table IV.34). IV.95 Amongst all the categories of SCBs, RRBs had the highest share of low-cost CASA deposits, constituting 54.5 per cent of their total deposits at end-March 2023. RRBs’ C-D ratio reached a 15-year high of 67.5 per cent at end-March 2023 from 64.5 per cent a year ago as growth in loans exceeded that of deposits. During 2022-23, RRBs accounted for 2.9 per cent in the total loan amount of all SCBs, while their share in the number of loan accounts was 8 per cent, indicating a greater reach to smaller customers. 12.2 Performance of RRBs IV.96 The number of loss making RRBs steadily declined from 13 in 2020-21 to six in 2022-23. After many years of losses, four RRBs turned profitable during 2022-23. The sector as a whole posted its highest ever net profit during 2022-23. An amount of ₹2,204 crore was deducted from other income towards depreciation in their investment portfolios on account of mark to market (MTM) losses during 2022-23, which was earlier reported under provisions and contingencies. This change in guidelines led to a decline in other income and provisions and contingencies, as well as deceleration in operating profit. IV.97 Reflective of the capital infusion, the CRAR of RRBs has increased significantly in recent years. The number of RRBs with CRARs less than the regulatory minimum of 9 per cent declined from 16 at end-March 2021 to nine at end-March 2023. The improvement in capital buffers, coupled with decline in GNPA ratios, has strengthened the financial position of RRBs (Table IV.35). IV.98 During 2022-23, all RRBs achieved their PSL targets, with the largest shares going to agriculture and MSMEs (Table IV.36 and Appendix IV.16). IV.99 LABs serve specific or local regions by bridging the gap in credit availability and enhancing the institutional credit framework in the rural and semi-urban areas. At end-June 2023, two LABs with 79 bank branches were operational across three states, with the majority of branches in Andhra Pradesh, followed by Telangana and Karnataka. More than half (51.9 per cent) of the LABs operate in semi-urban areas. Both deposits and advances recorded an acceleration in growth in 2022-23 (Table IV.37). 13.1 Financial Performance of LABs IV.100 The profitability indicators of LABs improved during 2022-23 as growth in interest income outpaced that in interest expended. Contraction in provisions and contingencies boosted profits further (Table IV.38). IV.101 SFBs were set up in 2016 to meet the financial needs of the marginalised sections of society. They are differentiated or niche banks with minimum net worth of ₹200 crore, lower than other SCBs. Considering their focus on financial inclusion, SFBs are required to lend at least 75 per cent of their ANBC to priority sectors, as compared with 40 per cent in the case of other SCBs (excluding RRBs). At end-June 2023, twelve SFBs with 6,589 domestic branches across the country were operational. The geographical concentration of SFBs – measured by the Herfindahl-Hirschman Index (HHI) – has been coming down in terms of both number of reporting offices as well as credit and deposits21. This indicates progressive diversification and increasing outreach of SFBs in line with their mandate of serving the marginalised sections (Chart IV.38). 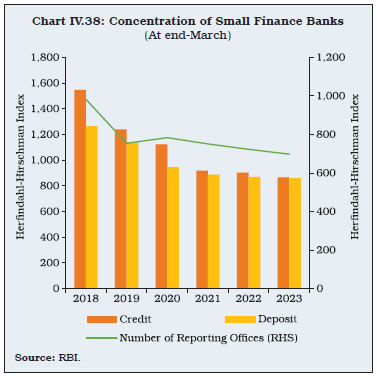 14.1 Balance Sheet IV.102 Consistent with the trend observed since their establishment in 2016, the consolidated balance sheet of SFBs grew at a pace faster than SCBs during 2022-23, notwithstanding some moderation during the year. With deposit growth slowing down during the year, SFBs resorted to higher borrowings to fuel credit growth. On balance, their credit-deposit ratio remained flat at around 92 per cent, higher than that of SCBs (Table IV.39). 14.2 Priority Sector Lending IV.103 The share of priority sector in total lending of SFBs declined further at end-March 2023 to its lowest level since their inception. Within the priority sector, MSMEs and agriculture remained their main focus, although the share of both declined (Table IV.40). SFBs have exceeded their priority sector lending targets for agriculture and allied activities and MSMEs and have also been net sellers of PSLCs. This suggests that they have been developing niches in priority sector lending areas. 14.3 Financial Performance IV.104 During 2022-23, SFBs’ net interest income was buoyed by a sharp increase in interest income relative to interest expended. Their GNPA ratio, which had surged in 2020-21 under the impact of COVID-19, has been moderating since then. In line with the asset quality improvement, the provisions and contingencies contracted during 2022-23 (Table IV.41). IV.105 PBs aim at providing payments and remittance services to migrant labour workforce, low-income households, small businesses, other unorganised sector entities and other users. At end-June 2023, six PBs were operational in the country, with 88 branches, the majority of which were in semi-urban regions. Out of the six operational PBs, five PBs were profitable in 2022-23. 15.1 Balance Sheet IV.106 The consolidated balance sheet of PBs recorded a strong growth, notwithstanding a deceleration from 45.3 per cent in 2021-22 to 30.1 per cent in 2022-23. Their growth still outpaced that of SCBs and SFBs. On the liabilities side, the balance sheet expansion was led by deposits, which constituted 51.9 per cent of liabilities. On the assets side, more than 50 per cent increase in balances with RBI and other banks was dragged down by deceleration in investments (Table IV.42). 15.2 Financial Performance IV.107 PBs turned profitable during 2022-23, the first time since their inception, as growth in interest income exceeded that in interest expenses (Table IV.43). IV.108 In line with operating profits, key profitability indicators of PBs - RoA and RoE - turned positive at end-March 2023. Furthermore, NIM of PBs increased from 2.3 per cent at end-March 2022 to 3.7 per cent at end-March 2023 after declining for three consecutive years. Over the years, the cost to income ratio of PBs has been declining, suggesting improved efficiency in their operations (Table IV.44). IV.109 During 2022-23, banks’ balance sheets grew at a healthy pace, with both deposits and credit growth accelerating. Retail and services sector loans drove credit growth. Banks’ financial conditions improved as they posted higher net interest margins and profits. Lower slippages and higher write-offs by banks improved asset quality across the board. With the increase in deposit rates catching up with that in lending rates, the profitability of banks may moderate going forward, while remaining robust. The share of unsecured advances in total advances has increased. In this context, the Reserve Bank’s targeted macro prudential measures of November 2023 are aimed at ensuring sustained financial stability while supporting growth. IV.110 Technology in the banking system has helped create a more inclusive and efficient financial ecosystem. Indian banks are increasingly leveraging it to enhance customer experience and address last mile issues. With the adoption of new technology, the risks of cyber-attacks, data breaches and operational failures have also increased. Going forward, banks need to better recognise and address these technology and cyber security risks to minimise potential vulnerabilities. The evolving nature of risks faced by the banking system necessitates building resilience through good governance and robust risk management practices. 1 SCBs are classified into scheduled and non-scheduled based on their inclusion or otherwise in the second schedule of the RBI Act, 1934. Two PBs, viz., Jio Payments Bank Ltd. and NSDL Payments Bank Ltd and two LABs viz., Coastal Local Area Bank Ltd. and Krishna Bhima Samruddhi LAB Ltd. are non-scheduled commercial banks. 2 Data exclude the impact of the merger of a non-bank with a bank effective July 2023. 3 Commercial banks were granted initial special dispensation of enhanced HTM limit of 22 per cent of NDTL for SLR eligible securities acquired between September 1, 2020 and March 31, 2021. The limit was further extended to 23 per cent in April 2022 and was made available till March 31, 2024. 4 Short-term is defined as up to 1 year, medium-term is 1-5 years and long-term is defined as more than 5 years. 5 Based on supervisory OSMOS data, which may not match with annual accounts data in Table IV.4. 6 Net profit = Earnings before provisions and taxes (EBPT) – Provisions – write-offs. 7 Firm level data are available in CMIE Prowess database. For matching quarterly CRILC data with annual Prowess data, the annual values were repeated for all quarters in a financial year. 8 Sector is a dummy variable taking value 1 for industry and 0 for services. 9 The Reserve Bank implemented a 6-month asset classification standstill from March 2020 for accounts that were granted moratorium or deferment and were standard as on March 1, 2020. 10 NCF target is applicable only for FBs having more than 20 branches. 11 These instructions were made applicable to all PVBs (including SFBs) and wholly owned subsidiaries of FBs. In respect of State Bank of India and Nationalised Banks, these guidelines were specified to apply only to the extent that they are not inconsistent with provisions of specific statutes applicable to them, or instructions issued under the statutes. 12 The guidelines on compensation of whole-time directors/ chief executive officers/ material risk takers and control function staff issued on November 4, 2019, became effective for the pay cycles beginning from / after April 01, 2020. 13 VP is the actual amount paid by the bank. 14 As per the guidelines, in case the VP is up to 200 per cent of the fixed pay, a minimum of 50 per cent of the VP and in case the VP is above 200 per cent, a minimum of 67 per cent of the VP should be via non-cash instruments. 15 Government of India (2018), “Responsive and Responsible PSBs — Banking Reforms Roadmap for a New India”, January 26, available at https://rbi.org.in/documents/87730/39016390/Final+23.01.18-min.pdf 16 DIF is built through transfer of surplus each year. The surplus consists of excess of income (mainly comprising premium received from insured banks, interest income from investments and cash recovery out of assets of failed banks) over expenditure (payment of claims of depositors and related expenses), net of taxes. 17 Ratio of deposit insurance fund to insured deposits. 18 “Status of Microfinance in India, 2022-23”, available at status-of-microfinance-in-india-2022-23.pdf (nabard.org) 19 Success rate is defined as per cent of invoices uploaded that get financed. 20 In 2021-22, ₹8,168 crore was sanctioned for 22 RRBs and the entire amount was disbursed by end-March 2023. In 2022-23, ₹2,722 crore was sanctioned for 22 RRBs, of which, at end-March 2023, 10 RRBs had received the sponsor banks’ share amounting to ₹651 crore. 21 HHI is calculated by squaring the market share of each entity in the given time period and then summing the resulting numbers. The lower the value of HHI, the lesser is the market concentration. |
||||||||||||||||||||||||||||||||||||||||||||||||||||||||||||||||||||||||||||||||||||||||||||||||||||||||||||||||||||||||||||||||||||||||||||||||||||||||||||||||||||||||||||||||||||||||||||||||||||||||||||||||||||||||||||||||||||||||||||||||||||||||||||||||||||||||||||||||||||||||||||||||||||||||||||||||||||||||||||||||||||||||||||||||||||||||||||||||||||||||||||||||||||||||||||||||||||||||||||||||||||


Share this page:


Install the RBI mobile application and get quick access to the latest news!
Scan the QR code to install our app


Page Last Updated on:


