Table
III.42: Return on Bank Stocks vis-à-vis Other Sectoral Stocks
* | (Per
cent) | Year | | BSE | BSE | Sectoral
Indices | | | Sensex | 500 | | | | | | |
| | | | Bankex | FMCG | IT | PSU | Capital | Consumer |
| | | | | | | | Goods | Durables |
1 | | 2 | 3 | 4 | 5 | 6 | 7 | 8 | 9 |
2002-03 | | -12.1 | -8 | 16.2 | -23.6 | -20.4 | 10.1 | 26.4 | -15.1 |
2003-04 | | 83.4 | 109.4 | 118.6 | 31.3 | 29.2 | 148.1 | 147.3 | 68.4 |
2004-05 | | 16.1 | 21.9 | 28.6 | 11.6 | 59.5 | 8.1 | 39.9 | 50.5 |
2005-06 | | 73.7 | 65.2 | 36.8 | 109.9 | 49.2 | 44.0 | 156.0 | 115.4 |
2006-07 | | 15.9 | 9.7 | 24.3 | -21.4 | 21.6 | -3.2 | 11.1 | 11.1 |
2007-08 | | 19.7 | 24.2 | 18.0 | 31.7 | -27.6 | 25.4 | 54.4 | 8.8 |
2008-09 (up to | December
08, 2008) | -41.4 | -45.9 | -38.0 | -15.5 | -32.7 | -37.6 | -53.4 | -56.1 |
* : Percentage variations
in indices measured on a point-to-point basis.
Source : Bombay
Stock Exchange Limited (BSE). | sector banks witnessed
handsome gains during 2007-08. Among public sector banks, the major gainers during
2007-08 were UCO Bank (72.7 per cent), State Bank of India (61.0 per cent), State
Bank of Travancore (58.8 per cent), Bank of India (50.7 per cent), State Bank
of Bikaner and Jaipur (49.3 per cent) and State Bank of Mysore (45.8 per cent)
(Table III.44). Among the private sector banks, the major
gainers during 2007-08 included Bank of Rajasthan (155.0 per cent), ING Vysya
Bank (94.7 per cent), Indusind Bank (87.6 per cent), Axis Bank (59.4 per cent),
South Indian Bank Ltd. (40.6 per cent) and HDFC Bank (39.0 per cent). However,
share prices of City Union Bank declined by 82.7 per cent during the year.
3.102 The price/earning (P/E) ratio of both public and private sector banks
showed wide variations. At end-March 2008, while the P/E ratio of public sector
banks ranged between 3.4 (Allahabad Bank) and 10.1 (State Bank of India), the
P/E ratio of private sector banks ranged between 6.8 (Federal Bank) and 52.7 (Centurion
Bank of Punjab Ltd., which was later merged with HDFC Bank in May 2008) (Table
III.44).
3.103 Bank stocks continued to constitute a significant
portion of market capitalisation of the Indian equity market with their share
increasing to 7.2 per cent at end-March 2008 from 6.8 per cent at end-March 2007.
The market capitalisation of bank stocks constituted 8.8 per cent of total market
capitalisation on December 03, 2008.The share of turnover of bank stocks in total
turnover also increased from 5.3 per cent during 2006-07 to 6.6 per cent during
2007-08 and further to 11.5 per cent during the current financial year (up to
December 03, 2008) (Table III.45).
Table
III.43: Performance of Bank Stocks - Risk and Return |
Indices | Returns* | Volatility@ |
| 2006-07 | 2007-08 | 2008-09# | 2006-07 | 2007-08 | 2008-09# |
1 | 2 | 3 | 4 | 5 | 6 | 7 |
BSE Bankex | 24.2 | 18.0 | -38.0 | 17.5 | 18.1 | 18.3 |
BSE Sensex | 15.9 | 19.7 | -41.4 | 11.1 | 13.7 | 19.0 |
* : Percentage variations in
indices on a point-to-point basis.
@ : Defined as coefficient of variation.
# : Up to December 08, 2008.
Source : Bloomberg. |
Table
III.44: Share Prices and Price/Earning Ratios of Bank Stocks at BSE
| Bank | End-March | Percentage | P/E
Ratio |
| Closing
Prices(Rs.) | Variation | (End-March) |
|
| (Per
cent) |
|
|
|
| 2006 | 2007 | 2008 | End-March | 2006 | 2007 | 2008 |
|
|
|
| 2008
over end- |
|
|
|
|
|
|
| March
2007 |
|
|
|
1 | 2 | 3 | 4 | 5 | 6 | 7 | 8 |
Public Sector Banks | | | | | | | |
Allahabad Bank | 38.95 | 72.7 | 76.65 | 5.43 | 5.0 | 4.3 | 3.4 |
Andhra Bank | 80.8 | 76.05 | 74.1 | -2.56 | 8.1 | 6.8 | 6.1 |
Bank of Baroda | 230.3 | 215.4 | 283.9 | 31.80 | 10.1 | 6.9 | 6.7 |
Bank of India | 132 | 167.8 | 252.9 | 50.72 | 9.2 | 7.4 | 6.4 |
Bank of Maharashtra | 30.65 | 39.1 | 50.05 | 28.01 | 26.0 | 6.2 | 6.6 |
Canara Bank | 266.9 | 194.7 | 225.2 | 15.67 | 8.2 | 5.2 | 5.1 |
Corporation Bank | 381.7 | 288.9 | 283.05 | -2.02 | 12.3 | 8.0 | 5.4 |
Dena Bank | 36.4 | 35 | 50.85 | 45.29 | 20.3 | 5.0 | 4.0 |
Indian Overseas Bank | 96.95 | 103 | 135.2 | 31.26 | 6.7 | 5.6 | 6.1 |
Oriental Bank of Commerce | 232.85 | 187.55 | 176.65 | -5.81 | 7.4 | 8.1 | 5.3 |
Punjab National Bank | 471.2 | 471.65 | 508.15 | 7.74 | 10.3 | 9.2 | 7.3 |
Syndicate Bank | 89.35 | 63.95 | 75.05 | 17.36 | 8.7 | 4.3 | 4.5 |
Union Bank of India | 121.85 | 103.9 | 141 | 35.71 | 9.1 | 6.2 | 5.1 |
Vijaya Bank | 52.55 | 42.5 | 49.65 | 16.82 | 18.0 | 5.6 | 6.5 |
State Bank of India | 968.05 | 992.9 | 1598.85 | 61.03 | 11.6 | 8.2 | 10.1 |
State Bank of Bikaner and Jaipur | 4,164.35 | 3,348.00 | 4,998.00 | 49.28 | 14.4 | 5.5 | 7.9 |
State Bank of Mysore | 6,326.75 | 5,143.25 | 7,500.00 | 45.82 | 10.5 | 7.4 | 8.5 |
State Bank of Travancore | 4,151.95 | 3,008.35 | 4,775.95 | 58.76 | 8.0 | 4.6 | 6.2 |
UCO Bank | 26.55 | 21.4 | 36.95 | 72.66 | 10.8 | 5.4 | 7.1 |
Other Public Sector Banks | | | | | | | |
IDBI Bank Ltd. | 78.3 | 77.55 | 89.05 | 14.83 | 10.1 | 9.6 | 8.6 |
Private Sector Banks | | | | | | | |
Axis Bank | 356.35 | 490.15 | 781.15 | 59.37 | 20.5 | 20.0 | 22.5 |
Bank of Rajasthan Ltd. | 44.2 | 38.8 | 98.95 | 155.03 | 39.8 | 3.8 | 11.6 |
City Union Bank Ltd. | 112 | 161.45 | 27.9 | -82.72 | 4.8 | 5.4 | 8.9 |
Centurion Bank of Punjab Ltd. | 26.55 | 37.55 | 43.35 | 15.45 | 152.0 | 45.8 | 52.7 |
Dhanalakshmi Bank | 31.1 | 58.55 | 63.05 | 7.69 | 10.5 | 11.7 | 7.1 |
Federal Bank Ltd. | 201.65 | 215.55 | 216.3 | 0.35 | 7.7 | 6.3 | 6.8 |
ING Vysya Bank | 142.8 | 174.35 | 339.4 | 94.67 | 143.6 | 17.7 | 17.9 |
Indusind Bank Ltd. | 46.85 | 41.95 | 78.7 | 87.60 | 36.9 | 18.1 | 33.5 |
Jammu and Kashmir Bank Ltd. | 451.4 | 643.75 | 681.9 | 5.93 | 12.4 | 11.4 | 9.1 |
Karnataka Bank Ltd. | 100.15 | 171.05 | 199.95 | 16.90 | 6.9 | 11.7 | 10.0 |
Karur Vysya Bank Ltd. | 491.5 | 256.95 | 335.85 | 30.71 | 6.5 | 7.9 | 8.6 |
Kotak Mahindra Bank Ltd. | 278 | 479.65 | 628.55 | 31.04 | 72.7 | 28.9 | 21.1 |
South Indian Bank Ltd. | 61.65 | 99 | 139.2 | 40.61 | 8.5 | 6.7 | 7.4 |
HDFC Bank Ltd. | 773.5 | 949.4 | 1319.95 | 39.03 | 27.8 | 26.1 | 28.7 |
ICICI Bank Ltd. | 589.25 | 853.1 | 770.1 | -9.73 | 21.8 | 27.6 | 23.9 |
Yes Bank | 100.4 | 140.7 | 168.75 | 19.94 | 49.0 | 40.5 | 24.0 |
Source : BSE
and Bloomberg. |
Table
III.45: Relative Share of Bank Stocks -
Turnover and Market
Capitalisation | (Per
cent) | Year | Share
of turnover of bank stocks
in total turnover | Share
of capitalisation of
bank stocks in total
market capitalisation* |
1 | 2 | 3 |
2005-06 | 6.8 | 7.1 |
2006-07 | 5.3 | 6.8 |
2007-08 | 6.6 | 7.2 |
2008-09 | | |
(up to December 03, 2008) | 11.5 | 8.8 |
* : As at end-period. |
Note
:Data
for turnover and market capitalisation of banks relate to Bank Nifty Index of
NSE.
Source :National Stock Exchange of India Limited (NSE). |
Shareholding Pattern in Public Sector Banks
3.104 The process of diversification of ownership of public sector banks
made further progress during 2007-08. The number of public sector banks with private
shareholding up to 10 per cent declined from three at end-March 2007 to two at
end-March 2008, while those with more than 10 per cent and up to 20 per cent increased
from one to two (Table III.46 and Appendix
Table III.32).
3.105 The shareholding of foreign financial institutions
(FFIs) in Indian banks increased further during the year. While the FFIs shareholding
in public sector banks at end-March 2008 was broadly same as at end-March 2007,
it increased in the case of old as well as new private sector banks. In the case
of old private sectors banks, FFIs shareholding was more than 20 per cent in nine
banks at end-March 2008 as against four a year ago. In four new private sector
banks, FFI holding was more than 60 per cent as against three banks in the last
year (Table III.47).
Table
III.46: Private Shareholding in Public Sector Banks* |
(As at
end-March) | Category | 2007 | 2008 |
1 | 2 | 3 |
Up to 10 per cent | 3 | 2 |
More than 10 and up to 20 per cent | 1 | 2 |
More than 20 and up to 30 per cent | 3 | 3 |
More than 30 and up to 40 per cent | 3 | 3 |
More than 40 and up to 49 per cent | 11 | 11 |
-: Nil/negligible
*: Including
19 nationalised banks, State Bank of India and IDBI Bank Ltd. | 7.Technological
Developments in Banks
3.106 Technological developments and the
use of information technology (IT) have transformed the functioning of the financial
sector in the country. Banks in India have used IT not only to improve their own
internal processes but also to increase facilities and services to the customer.
Furthermore, the large scale increase in the number of transactions handled by
banks has enhanced the dependence of banking sector on modern technology, including
use of computers. Apart from reducing transactions costs, the use of technology
has also provided new avenues to banks to expand their outreach, especially in
the remote and rural areas.
Table
III.47: Foreign Financial Institutions (Non-resident) Shareholding in Indian Banks
| (As
at end-March) | (No.
of banks) | Category | Public
Sector Banks | New
Private Sector Banks | Old
Private Sector Banks |
| 2007 | 2008 | 2007 | 2008 | 2007 | 2008 |
1 | 2 | 3 | 4 | 5 | 6 | 7 |
Nil | 8 | 8 | - | - | 4 | 2 |
Up to 10 per cent | 5 | 5 | - | - | 9 | 2 |
More than 10 and up to 20 per cent | 13 | 13 | - | - | - | 2 |
More than 20 and up to 30 per cent | 2 | 2 | 1 | 1 | 1 | 4 |
More than 30 and up to 40 per cent | - | - | - | 1 | 1 | 2 |
More than 40 and up to 50 per cent | - | - | 1 | 1 | - | - |
More than 50 and up to 60 per cent | - | - | 3 | 1 | 1 | 2 |
More than 60 and up to 70 per cent | - | - | 2 | 4 | - | - |
More than 70 and up to 80 per cent | - | - | 1 | - | 1 | 1 |
Total | 28 | 28 | 8 | 8 | 17 | 15 |
3.107 The process of computerisation, which marked the starting
point of all technological initiatives, is reaching near completion for most of
the banks. Public sector banks continued to provide adequate resources for computerisation
and development of communication networks. The cumulative amount spent from September
1999 to March 2008 aggregated Rs.15,016 crore (Appendix Table III.33). A major
development during 2007-08 was a significant increase in coverage of the number
of branches providing core banking solution (CBS) from 22,804 at end-March 2007
to 35,464 at end-March 2008. In terms of percentage to total branches, the share
of branches under CBS increased to 67.0 per cent at end-March 2008 from 44.4 per
cent a year ago.At end-March 2008, the number of fully computerised branches was
93.7 per cent as against 85.6 per cent at end-March 2007 (Table
III.48).
Table
III.48: Computerisation in Public Sector Banks |
(As at
end-March) | (Per
cent of total bank branches) | Category | 2007 | 2008 |
1 | 2 | 3 |
Fully Computerised Branches
(i+ii) | 85.6 | 93.7 |
i) | Branches
Under Core Banking Solution | 44.4 | 67.0 |
ii) | Branches
already Fully Computerised # | 41.2 | 26.6 |
Partially Computerised Branches | 13.4 | 6.3 |
# : Other than branches under
Core Banking Solution. | 3.108 The total number of Nodes/PCs
in the computerised branches (fully and partially) increased by 61,437 during
2007-08 representing an increase of 11.1 per cent. Public Sector banks recorded
significant progress in fully computerising their branches. Of the twenty seven
public sector banks, 20 banks have computerised their branches fully, while 5
banks have computerised between 70 to less than 100 per cent of their branches.
Only two banks, viz., Punjab and Sind Bank and UCO Bank are yet to computerise
more than half of their branches (Table III.49).
3.109 During 2007-08, the total number of ATMs installed by the banks grew by
28.4 per cent to 34,789 at end-March 2008. While, the ATMs installed by foreign
banks and new private sector banks were nearly four and three times of their respective
branches, the ATM to branch ratio was much lower for public sector (41.2 per cent)
and old private sector banks (47.2 per cent) (Table III.50).
At individual bank level, the number of ATMs exceeded branches in respect of all
new private sector banks, except Centurion Bank of Punjab Ltd., which was later
merged with HDFC Bank Ltd. In the case of old private sector banks, the ATM to
branch ratio was less than 100 per cent for all banks barring two, viz.,
SBI Commercial and International Bank Ltd. and Karur Vysya Bank Ltd. As most foreign
banks operated with limited branches in urban and metropolitan areas, the number
of ATMs operated by them, in general, far exceeded the number of branches (Appendix
Table III.35).
Table
III.49: Computerisation of Branches -
Public Sector Banks |
(As
at end-March) | | (Number
of banks) | Extent
of Computerisation | 2007 | 2008 |
1 | 2 | 3 |
Nil | - | - |
Up to 10 per cent | - | 1 |
More than 10 and up to 20 per
cent | 1 | - |
More than 20 and up to 30 per
cent | 1 | - |
More than 30 and up to 40 per
cent | 1 | - |
More than 40 and up to 50 per
cent | 1 | 1 |
More than 50 and up to 60 per
cent | - | - |
More than 60 and up to 70 per
cent | 1 | - |
More than 70 and up to 80 per
cent | 1 | 1 |
More than 80 and up to 90 per
cent | 4 | 3 |
More than 90 and less than
100 per cent | 2 | 1 |
Fully Computerised | 15 | 20 |
Total* | 27 | 27 |
*: Excludes IDBI
Bank Ltd. |
Table
III.50:Branches and ATMs of Scheduled Commercial Banks |
(As
at end-March 2008) | Bank
Group | Number
of Bank/Branches | Number
of ATMs | Off-site | ATMs |
| | Rural | Semi- | Urban | Metro- | Total | On-site | Off-site | Total | ATMs
as | as
per- | | | | urban | | politan | | | | | percentage | centage
of | | | | | | | | | | | of
total | Branches |
| | | | | | | | | | ATMs | |
1 | | 2 | 3 | 4 | 5 | 6 | 7 | 8 | 9 | 10 | 11 |
i) | Nationalised
Banks | 13,198 | 8,140 | 8,440 | 7,997 | 37,775 | 8,320 | 5,035 | 13,355 | 37.7 | 35.4 |
ii) | State
Bank Group | 5,328 | 4,545 | 2,820 | 2,421 | 15,105 | 4,582 | 3,851 | 8,433 | 45.7 | 55.8 |
iii) | Old
Private Sector
Banks | 808 | 1,498 | 1,270 | 874 | 4,450 | 1,436 | 664 | 2,100 | 31.6 | 47.2 |
iv) | New
Private Sector Banks | 223 | 870 | 1147 | 1285 | 3,525 | 3,879 | 5,988 | 9,867 | 60.7 | 279.9 |
v) | Foreign
Banks | 0 | 2 | 48 | 224 | 274 | 269 | 765 | 1,034 | 74.0 | 377.4 |
Total (i to v)
| 19,557 | 15,055 | 13,725 | 12,801 | 61,129 | 18,486 | 16,303 | 34,789 | 46.9 | 56.9 |
3.110 Of all the ATMs installed in the country at end-March 2008,
new private sector banks had the largest share in off-site ATMs, while nationalised
banks had the largest share in on-site ATMs (Chart III.21).
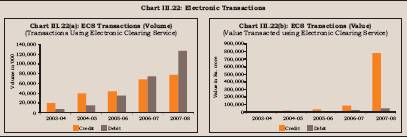
3.111
The use of electronic payments, both retail and card-based, increased in recent
years, reflecting the increased adoption of technology. The electronic payment
systems such as electronic clearing service (ECS) – both debit and credit,
national electronic funds transfer system (NEFT), card based payment (credit and
debit) are becoming increasingly popular as indicated by the increase in transactions
through retail electronic payment methods. Both the variants of ECS, i.e.,
ECS (credit) and ECS (debit) for direct credit such as salary and pension payments
and the other for direct debit such as collection of bills, insurance premia
and equated monthly installment payments of loans are being increasingly preferred.
ECS is now available at all bank branches at 70 centers. The volume of electronic
transactions increased by 41.4 per cent in 2007-08 as compared with 32.9 per cent
in the previous year.Transactions in terms of value increased by almost three
and half times during 2007-08 mainly on account of large increase in transactions
through ECS-credit (Table III.51).
Table
III.51: Transactions through Retail Electronic Payment Methods
| Type | Volume
of transactions | Growth
in volume | Value
of transactions | Growth
in value |
|
|
| (000's) |
| (per
cent) |
| (Rs.
crore) |
| (per
cent) |
|
| 2005-06 | 2006-07 | 2007-08 | 2006-07 | 2007-08 | 2005-06 | 2006-07 | 2007-08 | 2006-07 | 2007-08 |
1 |
| 2 | 3 | 4 | 5 | 6 | 7 | 8 | 9 | 10 | 11 |
1. | ECS-Credit | 44,216 | 69,019 | 78,365 | 56.1 | 13.5 | 32,324 | 83,273 | 7,82,222 | 157.6 | 839.3 |
2. | ECS-Debit | 35,958 | 75,202 | 127,120 | 109.1 | 69.0 | 12,986 | 25,441 | 48,937 | 95.9 | 92.3 |
3. | EFT/
NEFT | 3,067 | 4,776 | 13,315 | 55.7 | 178.8 | 61,288 | 77,446 | 1,40,326 | 26.4 | 81.2 |
4. | Credit
Cards | 156,086 | 169,536 | 228,203 | 8.6 | 34.6 | 33,886 | 41,361 | 57,984 | 22.1 | 40.2 |
5. | Debit
Cards | 45,686 | 60,177 | 88,306 | 31.7 | 46.7 | 5,897 | 8,172 | 12,521 | 38.6 | 53.2 |
Total | 285,013 | 378,710 | 535,309 | 32.9 | 41.4 | 1,46,381 | 2,35,693 | 10,41,990 | 61.0 | 342.1 |
3.112 The use of ECS (credit) and ECS (debit), in particular, increased
sharply during 2007-08 [Chart III.22(a) and III.22(b)]. While
the ECS (credit) volumes increased by 13.5 per cent in 2007-08, value increased
by more than eight times. The substantial increase was due to the use of ECS for
refund of initial public offering (IPOs). The volumes under ECS (Debit), which
is mostly used for payment of utility bills and regular premia, increased
by 69.0 per cent in 2007-08 and by 92.3 per cent in value.
3.113 The
large value payment systems include the real time gross settlement (RTGS), Government
securities clearing and forex clearing. The RTGS has been working smoothly since
its operationalisation in March 2004. As at end-September 2008, 107 participants
(99 banks, 8 primary dealers, the Reserve Bank and the Deposit Insurance and Credit
Guarantee Corporation) were members of the RTGS system. The reach and utilisation
of the RTGS is consistently increasing. The bank/branch network coverage increased
to 51,095 branches at more than 10,000 centres leading to increased usage of this
mode of funds transfer (Chart III.23). The daily average volume
of transactions is 38,000 for about Rs.1,15,600 crore of which 30,900 transactions
for about Rs.69,123 crore pertain to customer transactions as at end-September
2008.
8.Regional Spread of Banking
3.114 The role of financial and banking services in the equitable growth
process is widely recognised. In this context, the availability of information
on regional spread of banking services is a pre-requisite for appropriate policy
formulation. It has been the endeavour of the Reserve Bank to enrich information
on the progress of banking services and operations across country. 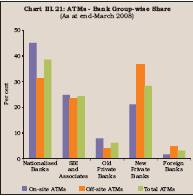
Accordingly,
the Basic Statistical Return (BSR) system, which provides comprehensive information
on the banking operations across country, has been suitably modified recently
to take into account the changed requirements (Box III.3). Box
III.3: Basic Statistical Returns (BSR) System The Basic Statistical
Returns System (BSR) was introduced in December 1972 adapting the then existing
system of Uniform Balance Book (UBB). The UBB system of reporting, designed to
provide a detailed and up-to-date picture of the sectoral and regional flow of
bank credit, was introduced in December 1968 in the context of the setting up
of the National Credit Council with twin objectives of ensuring a steady flow
of information while minimising the reporting load on branches. The UBB proforma
collected account-wise information on credit limits sanctioned and advances outstanding
according to the type of account, type of borrower, occupation, purpose, security
and rate of interest charged on a monthly basis from all the bank offices. After
nationalisation of major Indian banks, the need was felt for comprehensive information
with a minimum time lag for policy purposes.The Reserve Bank of India constituted
a ‘Committee on Banking Statistics’ in April 1972 to look into various
aspects of statistical reporting by banks and make appropriate suggestions. The
overall pattern of the statistical reporting system envisaged by the committee,
was designated as Basic Statistical Returns (BSR) and was designed to provide
a steady flow of information without undue strain on banks. The Reserve Bank accepted
the recommendations of the committee and introduced BSR returns, as also constituted
a ‘Committee of Direction on Banking Statistics’ (CDBS) in the Reserve
Bank to have overall charge of the Basic Statistical Returns. The BSR system has
been improved from time to time, in view of the changes in banking environment
and in data requirements.
Currently, the BSR system has seven returns
encompassing data on deposits, credit, investment and employment in scheduled
commercial banks (SCBs), collected both on census and sample survey basis. Annual
BSR-1 return submitted by all the branches of SCBs (in two parts, viz.,
BSR 1A and 1B) collects comprehensive information on credit. BSR-1A seeks account
level data for credit accounts with credit limit above a cut-off level. The cut-off
limit is revised periodically. Currently the limit is Rs.2 lakh (since March 2000).It
collects information on various attributes of the account, like type of account,
organisation, occupation and interest rate, among others, besides information
on the district and population group of the place of utilisation of credit. Information
on place of utilisation of credit is useful for analysing the migration of credit
across different districts/States. The BSR-1B return collects branch level credit
data according to broad occupation groups. BSR-2 return, collected annually from
all offices of SCBs, pertains to deposits and employment. Data on deposits are
collected according to type of deposits, and those on term deposits by size, interest
rates and maturity (both original and residual). Employment data are obtained
category-wise. Gender-wise statistics on deposits, credit and employment are included
in BSR-1 and 2 returns. A Handbook of instructions relating to BSR-1 and 2 returns
has been prepared for use by the branches and is revised periodically. The results
of BSR-1 and 2 surveys are published annually. BSR-3 is a monthly return on advances
against security of selected sensitive commodities.BSR-4 is a sample survey on
ownership of deposits and includes data by type of deposits. The survey is conducted
on an annual basis to obtain estimates on ownership pattern of deposits according
to different economic sectors.Annual BSR-5 return relates to investment profile
of SCBs (excluding regional rural banks) by type of investment (dated securities
and others) as also investment in State-level securities. BSR-6 is quinquennial
sample survey of debits to deposit and credit accounts and provides data on turnover
rates for deposit/credit accounts of SCBs. The results of BSR-4 and 5 surveys
are released in the ‘Reserve Bank of India Bulletin’.The reference
date for BSR-1, 2, 4 and 5 returns is March 31 and for BSR-3, last Friday of the
month. BSR-6 survey covers April-March year data. BSR-7 is a quarterly return
as on March 31 and on last Friday of June, September and December, on aggregate
deposits and gross bank credit and submitted for all the branches of SCBs by the
bank’s head offices. Detailed tabulations covering geographical and spatial
distribution of deposits and credit, by different characteristics, viz.,
State/District/Centre, population group and bank group, based on this return are
published as a quarterly publication titled ‘Quarterly Statistics on Deposits
and Credit of Scheduled Commercial Banks’. A Master Office File on bank
offices serves as a repository of location and other details of all branches/offices
of banks. The BSR data based publications are accessible through the Reserve Bank’s
website, including user-friendly ‘Data Base on Indian Economy’ facility.
Major revisions in BSR-1 Return
The BSR-1 system has been
revised with effect from March 2008 to take into consideration the changes in
the banking/economic environment as well as to meet the emerging data requirements.The
occupation classification has been modified in line with updations in National
Industrial Classification (NIC)-2004 and proposed International Standard Industrial
classification (ISIC) rev. 4 (draft), 2007. The definition and concept of Small
Enterprises (SE), comprising small and micro enterprises engaged in manufacturing
and services, have been introduced in place of Small Scale Industries (SSI). The
kisan credit cards, general credit cards and other credit cards have been included
as the type of accounts along with the existing personal credit cards. The organisation
codes of the borrowers have been restructured. Financial and non-financial organisations
have been separately defined under public, private and co-operative sectors. Separate
codes have been included for self-help groups (SHGs)/micro-finance institutions
(MFIs).Loans to non-banking financial companies (NBFCs) have been classified based
upon on-lending to agriculture and allied activities, small and micro enterprises,
housing sector, educational purposes and other general purposes. A new characteristic
‘category of borrowers’, based on the size of the borrowing unit,
has been introduced in place of ‘nature of borrowal account’. A new
parameter ‘security pledged/guarantee status for loans’ has been introduced
to capture the secured/unsecured loans. Information on ‘fixed/floating rate
of interest on loans’ has also been included. The occupation/activity codes
in BSR-1B return have been modified in line with changes in BSR-1A return. 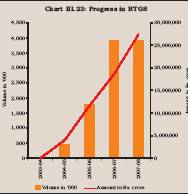
3.115
The total number of branches of SCBs (including RRBs and LABs) increased from
72,752 at end-June 2007 to 76,518 at end-June 2008, registering a growth of 5.2
per cent during the year. These comprised 31,127 rural branches, 17,858 semi-urban
branches and 27,533 urban and metropolitan branches. The share of rural branches
declined further to 40.7 per cent at end-June 2008 from 42.1 per cent at end-June
2007, while the shares of all other population groups increased. Nearly half (49.6
per cent) of the total branches of all bank groups are operated by nationalised
banks (including IDBI Bank Ltd.), followed by SBI and associates (19.9 per cent)
and RRBs (19.3 per cent). The share of branches operated by new private sector
banks increased to 4.9 per cent at end-June 2008 from 3.9 per cent at end-June
2007. While the share of branches operated by old private sector banks declined
marginally during 2007-08 to 5.9 per cent at end-June 2008, the number of their
branches increased across all population groups, reversing the trend observed
in the previous year. Foreign bank branches were mostly concentrated in the urban
and metropolitan areas with negligible presence in rural and semi-urban areas
(Chart III.24 and Appendix
Table III.36). 
3.116
The top hundred centres arranged according to the size of deposits accounted for
69.7 per cent of total deposits, while the top hundred centres arranged according
to the size of bank credit accounted for 77.8 per cent of total bank credit at
end-March 2008. The shares of top hundred centres in total deposits and total
bank credit have increased in recent years and the increase has been relatively
sharper in the case of deposits (Table III.52).
Table
III.52: Share of Top Hundred Centres in | Aggregate
Deposits and Gross Bank Credit | (Per
cent) | End-March | Deposits | Credit |
| Offices | Amount | Offices | Amount |
1 | 2 | 3 | 4 | 5 |
2001 | 22.3 | 58.9 | 21.9 | 75.3 |
2002 | 22.5 | 59.1 | 22.1 | 77.0 |
2003 | 22.7 | 61.0 | 22.4 | 75.9 |
2004 | 23.1 | 63.6 | 22.9 | 75.5 |
2005 | 23.8 | 65.3 | 23.7 | 75.9 |
2006 | 24.2 | 67.0 | 24.0 | 76.5 |
2007 | 24.9 | 68.9 | 24.8 | 77.4 |
2008 | 25.7 | 69.7 | 25.6 | 77.8 |
Source : Basic
Statistical Return-7. | 3.117 The Southern region continued
to account for the largest percentage of existing bank branches during 2007-08,
followed by the Central, Northern, Eastern, and the Western regions (Chart
III.25). The share of North-Eastern region remained low at 2.7 per cent at
end-June 2008. During July 2007 to June 2008, most of the new branches were opened
in the Southern (1,147 or 29.9 per cent of incremental branches) and Central (854
or 22.3 per cent) regions. As the total number of bank branches expanded by 5.2
per cent during the 2007-08, the average population served by a single bank branch
declined to about 15,000 at end-March 2008 from about 16,000 at end-March 2007.
The decline was observed across all regions, barring Northern and Eastern regions
where it remained unchanged (Appendix
Table III.37).
3.118 An important factor in the geographical expansion
of banking services is the population size of residential settlements. Many small
residential settlements spread across country may not be able to sustain the business
operations of more than one bank branch in a financially viable manner. These
residential settlements/centres are often served by a single bank branch, i.e.,
single office banked centres (Box III.4). Thus, single office
banked centres have played an important role in the expansion of banking services
to a wider population, particularly in the remote areas. The advancement in technology
is, however, likely to change the typology of bank branch network in the country.
3.119 The all-India credit-deposit ratio (CDR) declined marginally to 74.2
per cent at the end-March 2008 from 75.0 per cent a year ago, reflecting some
deceleration in the overall credit growth. The CDR (as per sanction) as well as
investment plus credit to deposit ratio of the Southern region remained
higher than the all-India level.The CDR (as per sanction) for the Western region
was higher than all-India level, but investment plus credit to deposit
ratio was a shade below than the all-India level. Both the ratios for other regions
were below the all-India level (Chart III.26). As at end-March
2008, the CDR (as per sanction) was higher than all-India level in Rajasthan,
Chandigarh, Maharashtra, Andhra Pradesh, Karnataka and Tamil Nadu.The investment
plus credit-deposit ratio at end-March 2008 in these States (except Maharashtra)
and in Orissa, Gujarat, Dadra and Nagar Haveli, was higher than the all-India
level (Appendix Table III.38). 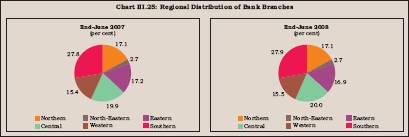
Box
III.4: Single Office Banked Centres As per the Basic Statistical
Return (BSR) system, a centre is defined as a revenue unit classified and delineated
by the respective State government, i.e., a revenue village/city/ town/municipality/municipal
corporation, etc. In general, a district consists of several centres.Accordingly,
if a centre has one or more offices of scheduled commercial banks is termed as
‘banked centre’. The banked centres are grouped into four population
groups based on the population of the centre as per decennial census data. The
total number of centres, served by scheduled commercial banks as on March 31,
2008 was 34,426.
An interesting attribute of any banked centre is the
number of bank offices located in it. As at end-March 2008, out of the 34,426
banked centres served by SCBs, 28,529 had only one bank office (‘single
office centres’), while 37 centres had 100 or more bank offices
(Table 1).
Table
1:Single Office Centres | (End-March) |
Item | 2003 | 2004 | 2005 | 2006 | 2007 | 2008 |
1 | 2 | 3 | 4 | 5 | 6 | 7 |
Total number of | | | | | | |
banked centres | 35,257 | 35,036 | 34,816 | 34,511 | 34,399 | 34,426 |
Number of single | | | | | | |
office centres | 29,980 | 29,696 | 29,390 | 29,054 | 28,812 | 28,529 |
Share of single office | | | | | |
centres in total banked | | | | | |
centres (per cent) | 85.0 | 84.8 | 84.4 | 84.2 | 83.8 | 82.9 |
Source: Basic
Statistical Return (BSR)-7 | The number of single office centres
and share of single office centres in total banked centres has shown a decline
over the years. As on March 31, 2008 single office centres accounted for 38.3
per cent of bank offices, but accounted for 8.1 per cent of deposits and 7.0 per
cent of credit outstanding. Classification of banked centres according to population
sizeindicated that 91.5 per cent of single office centres belonged to the rural
population group. In rural areas, 84.9 per cent of the banked centres were single
office centres and collectively such centres accounted for 74.2 per cent of deposits
and 79.6 per cent of credit outstanding in rural areas. The 28,529 single-office
centres are spread across all 35 States/UTs. Among the States/UTs, the highest
number (4,283) of such centres was in Uttar Pradesh at end-March 2008.In Bihar,
Andhra Pradesh, West Bengal and Maharashtra, single office centres were in the
range of 2,027-2,309, while Karnataka, Tamil Nadu and Rajasthan each had more
than of 1,500 such centres.Delhi and Chandigarh had 61 and 12 single-office centres,
respectively, out of 69 and 14 banked centres, respectively.At end-March 2008,
615 districts out of the 621 districts in the country had ‘single-office
centres’. The 28,529 single-office centres showed a large variability, both
in terms of their outstanding deposits and outstanding credit as on March 31,
2008 (Tables 2). While some of the recently opened branches
are having low amount of business, others are functioning at highly specialised
centres or for special purposes. Typical examples are project sites, food credit
disbursing branches, etc.
Table
2: Distribution of Single Office Centres by | Deposit/Credit
Size | (Number
of branches) | Deposit/Credit
size class | Rural | Semi- | Total |
|
| urban |
|
Deposits | | | |
Less than Rs.2 crore | 1,483 | 45 | 1,528 |
Rs.2 crore to Rs.4 crore | 6,322 | 203 | 6,525 |
Rs.4 crore to Rs.5 crore | 3,143 | 139 | 3,282 |
Rs.5 crore to Rs.7.5 crore | 5,594 | 373 | 5,967 |
Rs.7.5 crore to Rs.10 crore | 3,237 | 333 | 3,570 |
Rs.10 crore to Rs.12.5 crore | 1,891 | 292 | 2,183 |
Rs.12.5 crore to Rs.15 crore | 1,176 | 208 | 1,384 |
Rs.15 crore to Rs.20 crore | 1,388 | 285 | 1,673 |
Above Rs.20 crore | 1,865 | 552 | 2,417 |
Total | 26,099 | 2,430 | 28,529 |
Credit | | | |
Less than Rs.2 crore | 5,875 | 237 | 6,112 |
Rs.2 crore to Rs.4 crore | 8,071 | 447 | 8,518 |
Rs.4 crore to Rs.5 crore | 2,632 | 197 | 2,829 |
Rs.5 crore to Rs.7.5 crore | 4,310 | 376 | 4,686 |
Rs.7.5 crore to Rs.10 crore | 2,169 | 338 | 2,507 |
Rs.10 crore to Rs.12.5 crore | 1,268 | 266 | 1,534 |
Rs.12.5 crore to Rs.15 crore | 678 | 186 | 864 |
Rs.15 crore to Rs.20 crore | 608 | 202 | 810 |
Above Rs.20 crore | 488 | 181 | 669 |
Total | 26,099 | 2,430 | 28,529 |
Source:
Basic Statistical Return (BSR)-7 | Foreign
Banks’ Operations in India
3.120 At end-June 2008, 30 foreign
banks were operating in India with 279 branches (Table III.53).These
banks originated from 21 countries.In addition, 41 foreign banks operated in India
through representative offices. During the period from July 2007 to June 2008,
approvals were given to 3 existing foreign banks to open 18 branches and to 11
foreign banks to open representative offices in India. Besides, an approval was
also given to one new foreign bank viz., JSC VTB Bank to open its maiden
branch in India.
3.121 Five foreign banks viz., Deutsche Bank
AG, Standard Chartered Bank, Barclays Bank PLC, Citibank N.A. and JSC VTB Bank
together set up 7 branches during July 2007 to June 2008.Besides, seven foreign
banks, viz., Woori Bank, First Rand Bank Ltd., Royal Bank of Canada,
Skandinaviska Enskilda Banken AG, Bayerische Landesbank AG, Westpac Banking Corporation
and HSH Nordbank AG opened seven representative offices in India during the same
period.
Indian Banks’ Operations Abroad
3.122
Indian banks continued to expand their presence overseas. Seventeen Indian banks
(12 from public sector and 5 from private sector) operated a network of 203 offices
(131branches, 22 subsidiaries, 7 joint venture banks and 43 representative offices)
abroad at end-June 2008.During the period between July 1, 2007 to June 30, 2008,
Indian banks opened 8 branches, 3 subsidiaries and 6 representative offices abroad.
Bank of Baroda continued to have largest overseas presence, followed by State
Bank of India and Bank of India (Table III.54). 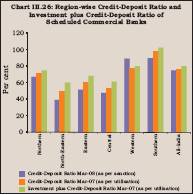
9.Customer Service and Financial Inclusion
3.123 In recent years, the Reserve Bank has placed special emphasis on improving
the customer service and expanding the banking outreach to wider sections of the
society. Accordingly, it initiated several measures, including enhancing customer
protection and disclosure, code of ethics and grievance redressal, among others.
During 2007-08, the Reserve Bank further fine-tuned its guidelines for improving
customer service and expanding financial inclusion.
Table
III.53: List of Foreign Bank Branches
Operating in India - Country-wise |
(As at
end-June 2008) | Sr.
No | Name
of
Bank | Country
of
Incorporation | No.
of Branches
in India | 1 | 2 | 3 | 4 |
1 | ABN
-AMRO Bank N.V. | Netherlands
| 28 |
2 | Abu
Dhabi Commercial Bank Ltd. | UAE | 2 |
3 | AB
Bank Ltd. | Bangladesh | 1 |
4 | American
Express Banking Corporation | USA
| 1 |
5 | Antwerp
Diamond Bank N.V. | Belgium
| 1 |
6 | Bank
Internasional Indonesia | Indonesia
| 1 |
7 | Bank
of America | USA | 5 |
8 | Bank
of Bahrain & Kuwait BSC | Bahrain
| 2 |
9 | Bank
of Nova Scotia | Canada
| 5 |
10 | The
Bank of Tokyo- Mitsubishi UFJ Ltd. | Japan
| 3 |
11 | BNP
Paribas | France | 8 |
12 | Bank
of Ceylon | Sri Lanka | 1 |
13 | Barclays
Bank PLC. | United Kingdom
| 5 |
14 | Calyon
Bank | France | 5 |
15 | Citibank
N.A. | USA | 40 |
16 | Chinatrust
Commercial Bank | Taiwan
| 1 |
17 | Deutsche
Bank | Germany | 11 |
18 | DBS
Bank Ltd. | Singapore | 2 |
19 | HSBC
Ltd | Hong Kong | 47 |
20 | J.P.
Morgan Chase Bank N.A. | USA
| 1 |
21 | JSC
VTB Bank | Russia | 1 |
22 | Krung
Thai Bank Public Co. Ltd. | Thailand
| 1 |
23 | Mizuho
Corporate Bank Ltd. | Japan
| 2 |
24 | Mashreq
Bank PSC. | UAE | 2 |
25 | Oman
International Bank SAOG | Sultanate
of Oman | 2 |
26 | Shinhan
Bank | South Korea | 2 |
27 | Standard
Chartered Bank | United
Kingdom | 92 |
28 | Sonali
Bank Ltd. | Bangladesh | 2 |
29 | Societe
Generale | France | 2 |
30 | State
Bank of Mauritius | Mauritius
| 3 |
| Total | | 279 |
Note : The
JSC VTB Bank began its operation in India on April 25, 2008 and
American
Express Banking Corporation was issued banking licence dated February 27, 2008. |
Table
III.54: Overseas Operations of Indian Banks |
(Actually
Operational) | Name
of the Bank | Branch | Subsidiary | Representative | Joint
Venture |
| Total |
|
|
|
|
|
|
| Office | Bank |
|
|
|
|
|
| 2006-07 | 2007-08 | 2006-07 | 2007-08 | 2006-07 | 2007-08 | 2006-07 | 2007-08 | 2006-07 | 2007-08 |
| 1 |
| 2 | 3 | 4 | 5 | 6 | 7 | 8 | 9 | 10 | 11 |
I. | Public
Sector Banks | 116 | 121 | 19 | 19 | 26 | 28 | 7 | 7 | 168 | 175 |
| 1 | Allahabad
Bank | 1 | 1 | - | - | 1 | 1 | - | - | 2 | 2 |
| 2 | Andhra
Bank | - | - | - | - | 1 | 1 | - | - | 1 | 1 |
| 3 | Bank
of Baroda | 43 | 45 | 8 | 8 | 4 | 4 | 1 | 1 | 56 | 58 |
| 4 | Bank
of India | 22 | 23 | 2 | 3 | 3 | 4 | 1 | 1 | 28 | 31 |
| 5 | Canara
Bank | 2 | 2 | 1 | - | 1 | 1 | - | - | 4 | 3 |
| 6 | Indian
Bank | 3 | 3 | - | - | - | - | - | - | 3 | 3 |
| 7 | Indian
Overseas Bank | 6 | 6 | 1 | 1 | 2 | 3 | - | - | 9 | 10 |
| 8 | Punjab
National Bank | 1 | 2 | 1 | 1 | 4 | 3 | 1 | 1 | 7 | 7 |
| 9 | State
Bank of India | 33 | 33 | 6 | 6 | 7 | 7 | 4 | 4 | 50 | 50 |
| 10 | Syndicate
Bank | 1 | 1 | - | - | - | - | - | - | 1 | 1 |
| 11 | UCO
Bank | 4 | 4 | - | - | 2 | 2 | - | - | 6 | 6 |
| 12 | Union
Bank | 0 | 1 | - | - | 1 | 2 | - | - | 1 | 3 |
II. | New
Private Sector Banks | 9 | 10 | 3 | 3 | 13 | 15 | - | - | 25 | 28 |
| 13 | Axis
Bank | 3 | 3 | - | - | 1 | 2 | - | - | 4 | 5 |
| 14 | Centurion
Bank of Punjab Ltd. | - | - | - | - | 1 | - | - | - | 1 | - |
| 15 | HDFC
Bank Ltd. | - | - | - | - | 1 | 2 | - | - | 1 | 2 |
| 16 | ICICI
Bank Ltd. | 6 | 7 | 3 | 3 | 8 | 8 | - | - | 17 | 18 |
| 17 | IndusInd
Bank Ltd. | - | - | - | - | 2 | 2 | - | - | 2 | 2 |
| 18 | Federal
Bank Ltd. | - | - | - | - | - | 1 | - | - | - | 1 |
| Total | 125 | 131 | 22 | 22 | 39 | 43 | 7 | 7 | 193 | 203 |
-: Nil | | | | | | | | | | | |
Note:Data
for 2006-07 relate to end-August 2007 while that for 2007-08 relate to end-June
2008. | 3.124 The Reserve Bank has institutionalised the
offices of Banking Ombudsman (BO) at 15 centres across the country. BO offices
receive the complaints relating to grievances against commercial banks, regional
rural banks and scheduled primary co-operative banks. Complainants have the facility
to send the complaints by email, online or by post. The complaints are tracked
by BO offices by means of a complaint tracking software. During 2007-08, 47,887
complaints were received by 15 BO offices as against 38,638 complaints received
during 2006-07. All the complaints were collated and categorised into ten broad
heads, viz., deposit accounts, remittances, credit cards, loans/advances
(general and housing loan), charges without prior notice, pension, failure on
commitments made, direct selling agents (DSAs), notes and coins and others. The
maximum complaints were received in respect of credit cards across all bank groups,
barring nationalised and old private sector banks. This was followed by complaints
relating to failure on commitments made, deposit accounts, remittances and loans
and advances (general). A significant number of complaints also related to pension
(especially for public sector banks) and direct selling agents (especially for
new private sector banks). The number of complaints per office was low for all
bank groups barring foreign banks group (Table III.55 and
Appendix Table
III.39).
3.125 Region-wise, the maximum complaints during 2007-08
were received at New Delhi, thereby surpassing Mumbai as the centre with the largest
number of complaints. The number of complaints received in Chennai, Guwahati,
Bhubaneswar, Kolkata and Ahmedabad also increased sharply during 2007-08 (Table
III.56).
Table
III.55: Bank-Group-wise Complaints received at Banking Ombudsman Offices - 2007-08@ |
Nature
of complaint | Scheduled | Public | Nationalised | State | Private | Old | New | Foreign |
| Commercial | Sector | Banks | Bank | Sector | Private | Private | Banks |
| Banks@ | Banks |
| Group | Banks | Sector | Sector |
|
| (3+6+9) | (4+5) |
|
| (7+8) | Banks | Banks |
|
1 | 2 | 3 | 4 | 5 | 6 | 7 | 8 | 9 |
Total Complaints Received
(1 to 10) | 45,772 | 25,694 | 12,163 | 13,531 | 13,950 | 929 | 13,021 | 6,128 |
1) | Deposit
Accounts | 5,500 | 2,866 | 1,685 | 1,181 | 2,113 | 140 | 1,973 | 521 |
2) | | Remittances | 5,077 | 3,422 | 1,713 | 1,719 | 1,330 | 97 | 1,233 | 315 |
3) | | Credit
Cards | 10,107 | 3,936 | 697 | 3,239 | 3,084 | 49 | 3,035 | 3,087 |
4) | | Loans/Advances
(a+b) | 5,773 | 3,740 | 2,147 | 1,593 | 1,550 | 154 | 1,396 | 483 |
| | a)
General | 5,042 | 3,348 | 1,929 | 1,419 | 1,290 | 131 | 1,159 | 404 |
| | b)
Housing Loans | 731 | 392 | 218 | 174 | 260 | 23 | 237 | 79 |
5) | | Charges
without Prior Notice | 3,700 | 1,659 | 815 | 844 | 1,618 | 111 | 1,507 | 423 |
6) | | Pension | 1,573 | 1,519 | 599 | 920 | 45 | 3 | 42 | 9 |
7) | | Failure
on Commitments Made | 6,222 | 3,521 | 1,805 | 1,716 | 2,145 | 193 | 1,952 | 556 |
8) | | Direct
Selling Agents | 3,044 | 1,902 | 979 | 923 | 801 | 37 | 764 | 341 |
9) | | Notes
and Coins | 133 | 91 | 47 | 44 | 30 | 5 | 25 | 12 |
10) | Others | 4,643 | 3,028 | 1,676 | 1,352 | 1,234 | 140 | 1,094 | 381 |
| | Memo
: | | | | | | | | |
| | Complaints
per Branch* | 0.7 | 0.5 | 0.3 | 0.9 | 1.7 | 0.2 | 3.7 | 22.1 |
@:Excluding RRBs and scheduled
primary co-operative banks.
*:As per number of branches excluding administrative
offices as at end-March 2008. | 3.126 In terms of the
Banking Ombudsman Scheme 2006 (as amended up to May 2007), bank customers and
banks can appeal to the Appellate Authority against the decisions given by Banking
Ombudsman. During 2007-08, 186 such appeals were received which include 17 appeals
against awards and 169 appeals against decisions of BO. The Reserve Bank has evaluated
the progress for improvement of customer services by various bank groups in some
centres (Box III.5)
Table
III.56: Region-wise Complaints received
at Banking Ombudsman
Offices | Sr.no. | Office | No.
of complaints received |
|
| 2006-07 | 2007-08 |
1 | 2 | 3 | 4 |
1 | Ahmedabad | 2,107 | 2,855 |
2 | Bangalore
| 2,406 | 2,975 |
3 | Bhopal
| 2,731 | 3,405 |
4 | Bhubaneswar
| 689 | 998 |
5 | Chandigarh
| 2,006 | 2,331 |
6 | Chennai | 2,387 | 4,545 |
7 | Guwahati | 170 | 282 |
8 | Hyderabad
| 2,767 | 2,843 |
9 | Jaipur | 2,976 | 3,369 |
10 | Kanpur
| 4,321 | 5,340 |
11 | Kolkata | 2,011 | 2,815 |
12 | Mumbai | 5,525 | 6,070 |
13 | New
Delhi | 5,481 | 6,742 |
14 | Patna
| 1,481 | 1,480 |
15 | Thiruvananthapuram | 1,580 | 1,840 |
| Total | 38,638 | 47,890 |
3.127 Financial Inclusion is delivery of banking services at an
affordable cost to the vast sections of disadvantaged and low-income groups who
tend to be excluded from the formal banking channel. The Reserve Bank has made
concerted efforts, particularly in recent years, to promote financial inclusion.
In November 2005, banks were advised to make available a basic ‘no-frills’
account with low or nil minimum balances as well as charges. In order to ensure
that persons belonging to low income group, both in urban and rural areas, do
not encounter difficulties in opening bank accounts, the know your customer (KYC)
procedure for opening accounts were simplified for those accounts with balances
not exceeding Rs. 50,000 and credits thereto not exceeding Rs. 1,00,000 in a year.
The simplified procedure allows introduction by a customer on whom full KYC drill
has been followed. Significant progress has been made in opening of ‘no-frills’
accounts by banks. Between end-March 2007 and end-March 2008, more than 9 million
new ‘no-frills’ bank accounts were opened by SCBs. Public sectors
banks accounted for bulk of these new ‘no-frills’ accounts due to
their vast branch network in rural and semi-urban areas (Table
III.57).
Box III.5: Customer Satisfaction Survey In
view of the importance given by the Reserve Bank on customer services of banks
and the recent initiatives in this respect, the Local Board (Southern Region)
desired that a survey should be conducted to evaluate the satisfaction level of
customer on various services rendered by the banks. Accordingly, Department of
Statistics and Information Management (DSIM), Chennai Regional Office conducted
a Customer Satisfaction Survey at four major districts of Tamilnadu, viz.,
Chennai, Coimbatore, Madurai and Tiruchirapalli, covering 2,800 customers from
149 bank branches selected using systematic sampling method (Table
1). Care was taken to adequately cover different types of customers across
different population groups. A detailed questionnaire used for the survey covered
various aspects such as: (a) demographic details of the respondents; (b) common
factors influencing satisfaction level such as branch infrastructure, working
hours, number of employees, etc.; and (c) specific banking services influencing
satisfaction level such as: (i) basic services like deposit and withdrawal; (ii)
loan facilities; (iii) payment and other similar services, etc. To measure
the satisfaction level, respondents were asked to rate their satisfaction level
with various services on a five-point scale from ‘Highly Dissatisfied’
to ‘Highly Satisfied’.
Branch-wise analysis showed
that only 68.5 per cent bank branches were under Core Banking Solution (CBS) and
the remaining were either under total branch automation or partial computerisation.
The overall average staff strength per branch is 15 and about 80 per cent of selected
branches’ staff strength was below the overall average. In all, nine bank
branches had received ISO 9000 certification, of which two branches were from
rural centre.
Table
1: Sample of the Survey | District | Rural | Semi- | Urban | Metro- | Total |
| | Urban | | Politian | |
1 | 2 | 3 | 4 | 5 | 6 |
Number
of Branches | | | | |
Chennai | - | - | - | 28 | 28 |
Coimbatore | 17 | 27 | 18 | - | 62 |
Madurai | 12 | 7 | 9 | - | 28 |
Tiruchirapalli | 13 | 9 | 9 | - | 31 |
Total | 42 | 43 | 36 | 28 | 149 |
Number
of Respondents | | | | |
Chennai | - | - | - | 597 | 597 |
Coimbatore | 280 | 425 | 382 | - | 1,087 |
Madurai | 249 | 141 | 180 | - | 570 |
Tiruchirapalli | 199 | 161 | 186 | - | 546 |
Total | 728 | 727 | 748 | 597 | 2,800 |
Analysis of the survey showed that courtesy and friendliness extended
by bank staffs in rural centres were rated better compared to semi-urban, urban
and metro centres. It was observed that bank staff knowledge on various banking
services and willingness to help customers was comparatively low in semi-urban
centres. Most of the respondents (87.5 per cent) were satisfied with the way bank’s
staff treat them and agreed that there was no discrimination based on caste, gender,
status, etc. Complaint handling and redressal mechanism were rated better
for private sector banks compared to other bank groups. Around 40 per cent respondents
were dissatisfied with services charges levied by banks.This factor showed the
least average satisfaction score. Respondents were, in general, satisfied with
bank’s responses to their telephonic queries and confidentiality and privacy
of their bank accounts maintained by the banks.
Survey showed that infrastructure
facility had the third lowest average rating among the common factors and around
40 per cent of the rural respondents were dissatisfied with infrastructure facilities.
Furthermore, nationalised banks were rated low on infrastructure facilities. In
general, respondents were satisfied with the overall operating of savings bank
accounts, while most of the respondents from public sector banks were satisfied
with the minimum balance requirement, around 25 per cent of respondents from private
sector banks and foreign banks were dissatisfied. The analysis indicated that
compared to public sector and foreign banks, private sector banks provide quick
and fast services to savings bank account holders. With regard to cheque collection,
most of the banks have introduced the drop box facility for depositing cheques
to avoid any time delay to their customers. Analysis showed that more than 75
per cent of urban and metropolitan respondents were satisfied with the drop box
facility. However, satisfaction was comparatively low in rural and semi-urban
centres. Few respondents were dissatisfied with commission/charges and processing
time taken for issuing a demand draft.
More than 75 per cent of the respondents
were satisfied with the credit card facility, but for interest rates. Around 44
per cent of the respondents, mostly from private sector and foreign banks, were
dissatisfied with interest rate applicable to credit cards. The Survey showed
that more than 85 per cent of the respondents were satisfied with ATM facility,
of which 35 per cent were highly satisfied. There were, however, many suggestions
from rural customers regarding the extension of ATM facility to them.
Regarding the loan facilities offered by the banks, respondents of SBI and associates
and private sector banks showed higher satisfaction level compared to nationalised
and foreign banks. It was observed that the proportion of respondents highly satisfied
with loan facilities from SBI and associates and private sector banks were 31
per cent and 43.9 per cent, respectively. In general, respondents had no complaints
against the procedural formalities followed in sanctioning and disbursement of
loans. Furthermore, 75.5 per cent of the respondents were satisfied with settlement
and recovery procedures followed by the banks.
Even though 88.1 per cent
of respondents had indicated that overall they were satisfied/highly satisfied
with banking services, in specific areas, respondents had expressed their dissatisfaction.
Furthermore, it was observed that respondents who took neutral stance (neither
satisfied nor dissatisfied) for all factors can be converted to a satisfied group
with some efforts. In general, the satisfaction level of rural customers was high,
which may be due to their lower expectations and awareness. Despite the fact that
advancements in IT and communication have enabled banks to offer better customer
services, such advancements have not reached all segments of customers, as there
are still some bank branches yet to be fully computerised. 10. Regional
Rural Banks
3.128 The regional rural banks (RRBs) were established
to combine the local feel and familiarity enjoyed by the co-operatives with the
degree of business organisation as well as the ability to mobilise deposits characteristic
of commercial banks. After the commencement of consolidation and amalgamation
process of RRBs initiated by the Government in September 2005, in terms of Section
23A of the Regional Rural Banks Act, 1976, the number of RRBs declined to 91 as
on March 31, 2008, (196 at end-March 2005) operating in 25 States across 586 districts
with a network of 14,790 branches. Consequent upon the amalgamation of 151 RRBs,
46 new amalgamated RRBs were formed besides 45 stand-alone RRBs. With further
amalgamation, and formation of a new RRB in the Union Territory of Puducherry,
the total number of RRBs, all over India, declined to 88 as on August 31, 2008
(including 45 amalgamated and 43 stand-alone).
Table
III.57: Number of No-frills Accounts
Opened by SCBs |
Bank Group | End-March | End-March | End-March |
| 2006 | 2007 | 2008 |
1 | 2 | 3 | 4 |
Public Sector Banks | 332,878 | 5,865,419 | 13,909,935 |
Private Sector Banks | 156,388 | 860,997 | 1,845,869 |
Foreign Banks | 231 | 5,919 | 33,115 |
Total | 489,497 | 6,732,335 | 15,788,919 |
Note : Data
are provisional. |
3.129 A number of policy initiatives
were taken by the Reserve Bank and NABARD to facilitate diversification of their
business operation into new areas (refer Chapter II). In order to facilitate RRBs
in becoming an important arm for financial inclusion in rural areas, the Government
reviewed the performance of RRBs on February 7, 2008. RRBs have been encouraged
to enhance their deposit base and increase credit-deposit ratio from the level
of 56 per cent at end-March 2006 by exploiting the emerging potential under both
priority and non-priority sector. Accordingly, the CD ratio of RRBs improved to
60.3 per cent at end-March 2008.
Recapitalisation of RRBs
3.130 It was announced in the Union Budget 2007-08 that the RRBs with negative
net worth would be recapitalised in a phased manner. The performance review of
all RRBs undertaken in July 2007 revealed that out of 96 RRBs (46 amalgamated
and 50 stand-alone), 29 (11 amalgamated and 18 stand-alone) had negative net worth
amounting to Rs.1,857 crore including the share capital as onMarch 31, 2007.After
July 2007, two RRBs with negative net worth were merged with two other RRBs of
the same State and sponsored by same banks, thus, resulting in formation of two
new entities with no negative net worth.As a result, the number of RRBs having
negative net worth declined to 27.The amount required for recapitalisation was
at Rs.1,796 crore.Of this, Rs.269 crore (15 per cent share), Rs.629 crore (35
per cent share) and Rs.898 crore (50 per cent share) was to be contributed by
the State Governments, sponsor banks, and by Government of India, respectively.
Five State Governments contributed their share in 10 RRBs in 2007-08, of which
7 RRBs got full share from all the three shareholders and 3 RRBs received contribution
partially by March 31, 2008. The rest of the RRBs are expected to get the recapitalisation
fund in 2008-09.
Financial Performance of RRBs
3.131 The
consolidated balance sheet of RRBs showed an increase of 16.8 per cent during
2007-08 as compared with 18.0 per cent in 2006-07 (Table III.58).On
the assets side, net advances of RRBs increased by 21.7 per cent during the period,
a more or less same growth as in the previous year.Among the major items on the
liabilities side, both deposits and borrowings increased by 19.2 percent each
during the year. Reflecting a relatively higher growth in advances, credit-deposit
ratio of RRBs increased to 60.3 percent at end-March 2008 from 58.3 per cent a
year ago.
Table
III.58: Regional Rural Banks: Consolidated Balance Sheet |
(Amount
in Rs. crore) | Item |
| March
31 | March
31 | Percentage
Variation |
|
| 2007 | 2008P | 2006-07 | 2007-08 |
|
|
|
| over | over |
|
|
|
| 2005-06 | 2006-07 |
1 |
| 2 | 3 | 4 | 5 |
Liabilities | | 1,05,768 | 1,23,541 | 18.0 | 16.8 |
Share Capital | | 196 | 196 | – | – |
Reserves | | 4,902 | 5,687 | 14.8 | 16.1 |
Share Capital Deposits | | 2,188 | 2,833 | 0.4 | 29.5 |
Deposits | | 83,144 | 99,095 | 16.6 | 19.2 |
Current | | 4,785 | 5689 | 21.0 | 18.9 |
Savings | | 46,112 | 53,370 | 20.6 | 15.7 |
Term | | 32,247 | 40,036 | 10.7 | 24.2 |
Borrowings | | 9,776 | 11,649 | 33.8 | 19.2 |
NABARD | | 7,567 | 8,350 | 20.1 | 10.4 |
Sponsor Bank | | 2030 | 3,250 | 116.8 | 60.1 |
Others | | 179 | 49 | 316.3 | -72.6 |
Other Liabilities | | 5,562 | 4,081 | 27.4 | -26.6 |
| | | | | |
Assets | | 1,05,768 | 1,23,541 | 18.0 | 16.8 |
Cash in Hand | | 1,216 | 1,412 | 17.7 | 16.1 |
Balances with RBI | | 4,886 | 7,164 | 38.8 | 46.6 |
Other Bank Balances | | 19,314 | 23,493 | 18.8 | 21.6 |
Other Investments | | 26,352 | 25,073 | 5.6 | -4.8 |
Loans and Advances (net) | 47,326 | 57,601 | 22.7 | 21.7 |
Fixed Assets | | 196 | 214 | 10.1 | 9.2 |
Other Assets# | | 6,478 | 8,584 | 24.2 | 32.5 |
Memorandum Items: | | | | | |
a. Credit-Deposit Ratio | | 58.3 | 60.3 | | |
b. Investment-Deposit Ratio | 54.9 | 45.2 | | |
c. (Credit+Investment)- | | | | | |
Deposit Ratio | | 104.3 | 106.4 | | |
| | | | | |
P: Provisional.
-: Nil/Negligible
#: includes accumulated loss.
Source : NABARD |
3.132 During 2007-08, 90 RRBs extended new loans (issued) to the
extent of Rs.38,464 crore to 9.3 million borrowers as against Rs.33,043 crore
during 2006-07 to 8.9 million borrowers. Of this, the share of priority sector
loans issued was 82.1 per cent. In terms of number of borrowers’ coverage,
the share of priority sector was 86.0 per cent to total loans issued during 2007-08.
As at end-March 2008, the outstanding advances of RRBs were Rs.59,751 crore and
the share of priority sector was 83.1 per cent (Table III.59).
The share of agricultural loans declined marginally to 55.4 per cent at end-March
2008 from 56.6 per cent a year ago.
Table
III.59: Purpose-wise Outstanding
Advances by RRBs |
(Amount in
Rs. crore) | Purpose/End-March | 2006 | 2007 | 2008P |
1 | 2 | 3 | 4 |
I. | Agriculture
(i to iii) | 21,509 | 27,452 | 33,112 |
| Per
cent to total loans outstanding | 54.2 | 56.6 | 55.4 |
| i.
Short-term loans (crop loans) | 13,877 | 18,707 | 22,644 |
| ii.
Term loans (for agriculture | | | |
| and
allied activities) | 7,632 | 8,745 | 10,468 |
| iii.
Indirect Advances | - | - | - |
II. | Non-agriculture
(iv to vii) | 18,204 | 21,041 | 26,639 |
| Per
cent to total loans outstanding | 45.8 | 43.4 | 44.6 |
| i.
Rural Artisans, etc. | 748 | 736 | 671 |
| ii.
Other Industries | 757 | 880 | 1276 |
| iii.
Retail Trade, etc. | 3,452 | 3,677 | 5,016 |
| iv.
Other purposes | 13,246 | 15,748 | 19,676 |
Total (I+II) | 39,712 | 48,493 | 59,751 |
Memo item: | | | |
a) | Priority
Sector | 32,177 | 39,852 | 49,650 |
b) | Non-priority
Sector | 7,535 | 8,641 | 10,101 |
c) | Share
of Priority Sector | 81.0 | 82.2 | 83.1 |
| (per
cent to Total) | | | |
P : Provisional. - : Nil/Negligible.
Source : NABARD. | 3.133
Aggregate income of RRBs during 2007-08 grew by 20.0 per cent on account of higher
interest as well as non-interest income. Growth in expenditure during the year
was relatively subdued on account of lower increase in interest expenditure and
wage bill. As a result, profitability of RRBs improved significantly during 2007-08.
Out of 90 RRBs, 82 RRBs earned a combined profit of Rs. 1,429 crore, whereas 8
RRBs incurred a combined loss of Rs. 55 crore in 2007-08. Thus, RRBs, as a group,
earned net profits of Rs. 1,374 crore during 2007-08 as compared with Rs. 625
crore in the previous year. The improvement in the financial performance of RRBs
is also reflected in the decline in NPAs ratios (both gross and net) during 2007-08.
While gross NPAs to total assets ratio declined to 5.9 per cent at end-March 2008
from 6.6 per cent a year ago, the net NPAs to assets ratio declined to 3.0 per
cent from 3.5 per cent a year ago (Table III.60).
3.134 The productivity of RRBs, both in terms of per branch and per employee,
showed further improvement during 2007-08 (Table III.61).
Most of the other financial ratios also showed improvement during the year.
11. Local Area Banks
3.135 There were four local
area banks (LABs) in the country at end-March 2008. During 2007-08, aggregate
assets of LABs increased by 32.2 per cent and deposits and gross advances by 32.4
per cent and 35.5 per cent, respectively. More or less similar growth rate was
observed across all LABs barring Krishna Bhima Samruddhi Local Area Bank
Ltd. that showed a significantly higher growth (Table III.62).
3.136 During 2007-08, the income of the LABs showed a large increase on account
of both interest and non-interest income. Growth rate in expenditure was also
significant as interest expenditure grew sharply. On the whole, the rise in income
was more than the rise in expenditure, resulting in higher operating and net profit
during 2007-08. The ratio of net profit to total assets was higher at 1.5 per
cent as compared with 1.2 per cent in the previous year even as the net interest
margin remained at the previous year’s level (Table III.63).
Table
III.60: Financial Performance of Regional Rural Banks |
(Amount
in Rs. crore) | Particulars | 2006-07 | 2007-08(P) | Variation |
| Loss | Profit | Total | Loss | Profit | Total | Col.
(7) over |
| Making | Making | RRBs | Making | Making | RRBs | Col.
(4) |
| [15] | [81] | [96] | [8] | [82] | [90] | Amount | Per
cent | 1 | 2 | 3 | 4 | 5 | 6 | 7 | 8 | 9 |
A. | Income
(i+ii) | 997 | 6,666 | 7,663 | 316 | 8,879 | 9,195 | 1,532 | 20.0 |
| i) | Interest
income | 932 | 6,191 | 7,123 | 286 | 8,106 | 8,392 | 1,269 | 17.8 |
| ii) | Other
income | 65 | 475 | 540 | 30 | 773 | 803 | 263 | 48.7 |
B. | Expenditure
(i+ii+iii) | 1,298 | 5,740 | 7,038 | 365 | 7,401 | 7,766 | 728 | 10.3 |
| i) | Interest
expended | 589 | 3,127 | 3,716 | 191 | 3,873 | 4,064 | 348 | 9.4 |
| ii) | Provisions
and contingencies | 192 | 425 | 617 | 50 | 675 | 725 | 108 | 17.5 |
| iii) | Operating
expenses | 464 | 2,241 | 2,705 | 130 | 2,847 | 2,977 | 272 | 10.1 |
| | of
which : Wage Bill | 391 | 1,660 | 2,051 | 113 | 2,102 | 2,215 | 164 | 8.0 |
C. | Profit | | | | | | | | |
| i) | Operating
Profit/Loss | -56 | 1,298 | 1242 | -5 | 2,159 | 2,154 | 912 | 73.4 |
| ii) | Net
Profit/Loss | -301 | 926 | 625 | -55 | 1429 | 1374 | 749 | 119.8 |
D. | Total
Assets | 16,148 | 89,620 | 1,05,768 | 4,440 | 1,19,101 | 1,23,541 | 17,773 | 16.8 |
E. | Financial
Ratios @ | | | | | | | | |
| i) | Operating
Profit | -0.35 | 1.45 | 1.17 | -0.11 | 1.81 | 1.74 | - | - |
| ii) | Net
Profit | -1.86 | 1.03 | 0.59 | -1.24 | 1.2 | 1.11 | - | - |
| iii) | Income | 6.17 | 7.44 | 7.25 | 7.12 | 7.46 | 7.44 | - | - |
| | a)
Interest income | 5.77 | 6.91 | 6.73 | 6.44 | 6.81 | 6.79 | - | - |
| | b)
Other Income | 0.4 | 0.53 | 0.51 | 0.68 | 0.65 | 0.65 | - | - |
| iv) | Expenditure | 8.04 | 6.4 | 6.65 | 8.22 | 6.21 | 6.29 | - | - |
| | a)
Interest expended | 3.65 | 3.49 | 3.51 | 4.3 | 3.25 | 3.29 | - | - |
| | b)
Operating expenses | 2.87 | 2.5 | 2.56 | 2.93 | 2.39 | 2.41 | - | - |
| | of
which: Wage Bill | 2.42 | 1.85 | 1.94 | 2.55 | 1.76 | 1.79 | - | - |
| v) | Provisions
and contingencies | 1.19 | 0.47 | 0.58 | 1.13 | 0.57 | 0.59 | - | - |
| vi) | Gross
NPAs | | | 6.55 | | | 5.88 | - | - |
| vii) | Net
NPAs | | | 3.46 | | | 3.02 | - | - |
P : Provisional.
@: Ratios to total assets.
*: Before tax. Note: Figures in
brackets represent number of RRBs. Financial
performance analysis relates
to 90 RRBs (excluding the new RRB).
Source: NABARD. |
Table
III.61: Business and Financial Indicators of RRBs |
Indicator | 2001-02 | 2002-03 | 2003-04 | 2004-05 | 2005-06 | 2006-07 | 2007-08
(p) | 1 | 2 | 3 | 4 | 5 | 6 | 7 | 8 |
No.of RRBs | 196 | 196 | 196 | 196 | 133
# | 96 # | 91# |
Net profit (Rs crore)* | 608 | 519 | 769 | 748 | 617 | 625 | 1374 |
Per Branch Productivity1 (Rs. crore) | 4.4 | 5.0 | 5.7 | 6.6 | 7.7 | 9.1 | 10.7 |
Per Employee Productivity2 (Rs. crore) | 0.9 | 1.0 | 1.2 | 1.4 | 1.6 | 1.9 | 2.3 |
Accumulated loss as percentage to assets | 4.7 | 4.4 | 3.9 | 3.5 | 2.9 | 2.5 | 2.1 |
Salary as percentage to Assets | 2.2 | 2.3 | 2.6 | 2.0 | 2.3 | 2.2 | 1.8 |
Financial Return3 (per cent) | 10.6 | 9.6 | 8.9 | 8.2 | 7.7 | 7.7 | 7.9 |
Financial Cost4 (per cent) | 6.8 | 6.1 | 5.4 | 4.6 | 4.1 | 4.0 | 4.2 |
Financial margin5 (per cent) | 3.8 | 3.5 | 3.5 | 3.6 | 3.6 | 3.7 | 3.6 |
Risk, operational and other cost (per cent) | 2.6 | 2.6 | 2.2 | 2.3 | 2.8 | 3.0 | 3.1 |
Net margin6 (per cent) | 1.2 | 0.9 | 1.3 | 1.3 | 0.8 | 0.7 | 0.6 |
* : Before
Tax
# : Reduction in number of RRBs was due to amalgamation, which began in
September 2005. Financial performance analysis relates to 90 RRBs (excluding the
new RRB).
Note : 1. Average level of business (in terms of
total deposits and gross advances) per branch during the reporting year.
2.
Average level of business (in terms of total deposits and gross advances) per
employee of RRBs during the year.
3. Percentage of total income from both
advances and investments against average working funds during the year.
4.
Percentage of total interest expended for deposits, borrowingsetc. against
average working funds during the year.
5. Difference between the financial
return and financial cost.
6. Difference between the financial margin and
risk, operational and other costs, plus miscellaneous income.
7. Data for
2007-08 are provisional.
Source : NABARD. |
Table
III.62: Profile of Local Area Banks |
(Amount in
Rs. crore) | Bank |
| Assets | Deposits | Gross
Advances |
| 2007 | 2008 | 2007 | 2008 | 2007 | 2008 |
1 | 2 | 3 | 4 | 5 | 6 | 7 |
Capital Local Area Bank Ltd. | 362 | 466 | 301 | 393 | 186 | 243 |
Coastal Local Area Bank Ltd. | 63 | 76 | 45 | 56 | 32 | 43 |
Krishna Bhima Samruddhi Local Area Bank
Ltd. | 49 | 81 | 27 | 43 | 30 | 52 |
Subhadra Local Area Bank Ltd. | 23 | 31 | 15 | 22 | 14 | 17 |
Total | 497 | 654 | 388 | 514 | 262 | 355 |
Source: Based
on off-site returns. |
Table
III.63: Financial Performance of Local Area Banks |
(As at end-March)
| (Rs.
crore) | Particulars | 2006-07 | 2007-08 | Variation
of Col.(3) over Col. (2) | | | | Absolute | Percentage |
1 | 2 | 3 | 4 | 5 |
A. | Income
(i+ii) | 46.3 | 68.2 | 21.8 | 47.1 |
| i) | | Interest
income | 37.4 | 54.9 | 17.5 | 46.7 |
| ii) | | Other
income | 8.9 | 13.3 | 4.4 | 49.0 |
B. | Expenditure
(i+ii+iii) | 40.5 | 58.3 | 17.8 | 43.9 |
| i) | | Interest
expended | 18.3 | 29.9 | 11.6 | 63.0 |
| ii) | | Provisions
and contingencies | 4.3 | 6.1 | 1.8 | 41.0 |
| iii) | | Operating
expenses | 17.8 | 22.3 | 4.5 | 25.1 |
| | | of
which : Wage Bill | 7.0 | 9.9 | 2.9 | 40.5 |
C. | Profit | | | | |
| i) | | Operating
Profit/Loss | 10.2 | 15.6 | 5.4 | 53.1 |
| ii) | | Net
Profit/Loss | 5.9 | 9.5 | 3.6 | 62.1 |
D. | Spread
(Net Interest Income) | 19.1 | 25.0 | 5.6 | 31.0 |
E. | Total
Assets | 496.4 | 653.5 | 157.1 | 31.7 |
F. | Financial
Ratios@ | | | | |
| i) | | Operating
Profit | 2.1 | 2.4 | | |
| ii) | | Net
Profit | 1.2 | 1.5 | | |
| iii) | | Income | 9.3 | 10.4 | | |
| iv) | | Interest
income | 7.5 | 8.4 | | |
| v) | | Other
Income | 1.8 | 2.0 | | |
| vi) | | Expenditure | 8.2 | 8.9 | | |
| vii) | | Interest
expended | 3.7 | 4.6 | | |
| viii) | | Operating
expenses | 3.6 | 3.4 | | |
| ix) | | Wage
Bill | 1.4 | 1.5 | | |
| x) | | Provisions
and Contingencies | 0.9 | 0.9 | | |
| xi) | | Spread
(Net Interest Income) | 3.8 | 3.8 | | |
Note:@ Ratios
to Total Assets.
Source:Based on Off-site returns. |
|
 IST,
IST,


