removing the floor rate of 25 per cent on SLR, removal of the erstwhile statutory minimum CRR maintenance requirement of 3 per cent, amendment to the State Bank of India (SBI) Act, 1955 to enable the State Bank of India to access funds from the capital market and also discharge its functions more efficiently and approval of the Cabinet Committee on Economic Affairs (CCEA) for the conversion of recapitalisation bonds (recap bonds) issued to nationalised banks into tradable securities that would also qualify for statutory liquidity ratio (SLR) status. Some bank stocks also attracted buying interest in anticipation of a takeover or merger. However, selling pressure was noticed intermittently in banking sector stocks due mainly to rise in interest rates and domestic inflation rate and lower than expected corporate results of some major banks.
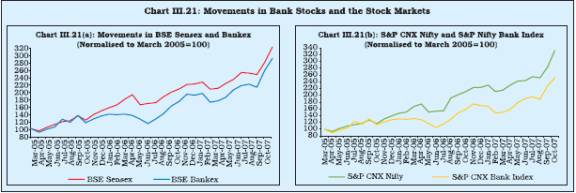
3.97 The banking stocks as represented by the Bankex (comprising 18 banking scrips) significantly outperformed the BSE Sensex, the broad-based index BSE 500 and other major sectoral indices. Banking stocks continued to outperform the BSE Sensex and most of the sectoral indices during the current financial year so far (up to November 14, 2007) (Table III.39). Apart from favourable macroeconomic fundamentals, bank stocks were driven by some sector-specific developments such as the satisfactory financial performance by public sector and private sector banks and the Parliament passing the State Bank of India (Subsidiary Bank Laws) Amendment Bill, 2006 paving the way for subsidiary banks of SBI to list on stock exchanges.
3.98 Although banking stocks outperformed the market, they also showed significantly higher volatility during 2006-07. However, during 2007-
08 (up to November 14, 2007), bank stocks exhibited only marginally higher volatility than the market volatility (Table III.40).
Table III.39: Return on Bank Stocks vis-à-vis Other Sectoral Stocks * |
(Per cent) |
Year |
BSE Sensex |
BSE
500 |
Sectoral Indices |
|
|
|
Bankex |
FMCG |
IT |
PSU |
Capital |
Consumer |
|
|
|
|
|
|
|
Goods |
Durables |
1 |
2 |
3 |
4 |
5 |
6 |
7 |
8 |
9 |
2002-03 |
-12.1 |
-8.0 |
16.2 |
-23.5 |
-20.4 |
10.1 |
26.4 |
15.1 |
2002-03 |
-12.1 |
-8 |
16.2 |
-23.5 |
-20.4 |
10.1 |
26.4 |
15.1 |
2003-04 |
83.4 |
109.4 |
118.6 |
31.3 |
29.2 |
1.811 |
147.3 |
68.4 |
2004-05 |
16.1 |
21.9 |
28.6 |
11.6 |
59.5 |
8.1 |
39.9 |
50.5 |
2005-06 |
73.7 |
65.2 |
36.8 |
109.9 |
49.2 |
44.0 |
156.0 |
115.4 |
2006-07 |
15.9 |
9.7 |
24.3 |
-21.4 |
21.6 |
-3.2 |
11.1 |
11.1 |
2007-08 (up to November 14, 2007) |
52.5 |
59.4 |
71.6 |
20.8 |
-12.6 |
77.7 |
129.9 |
44.1 |
* : Percentage variations in indices measured on a point-to-point basis.
Source : Bombay Stock Exchange Limited (BSE). |
Table III.40: Performance of Bank Stocks – Risk and Return |
Indices |
Returns* |
Volatility@ |
|
2005-06 |
2006-07 |
2007-08 # |
2005-06 |
2006-07 |
2007-08 # |
1 |
2 |
3 |
4 |
5 |
6 |
7 |
BSE Bankex |
36.8 |
24.3 |
72.7 |
11.8 |
17.5 |
13.8 |
BSE Sensex |
73.7 |
15.9 |
52.5 |
16.7 |
11.1 |
12.0 |
* : Percentage variations in indices on a point-to-point basis.
@ : Defined as coefficient of variation.
# : Up to November 14, 2007.
Source : Bloomberg. |
3.99 At an individual bank level, the stocks of public sector banks witnessed a mixed trend during 2006-07. Among the public sector banks, the major gainers during 2006-07 were State Bank of Mysore (53.5 per cent), State Bank of Travancore (32.5 per cent), Bank of India (28.7 per cent), State Bank of Bikaner and Jaipur (25.7 per cent), State Bank of India (22.9 per cent) and Indian Overseas Bank (12.2 per cent). The major losers among the public sector banks during 2006-07 were IDBI Ltd. (-23.5 per cent), UCO Bank (-23.3 per cent), Vijaya Bank (-22.00 per cent), Oriental Bank of Commerce (-18.5 per cent), Andhra Bank (-15.7 per cent) and Corporation Bank (-14.5 per cent) (Table III.41).
3.100 Among the private sector banks, the major gainers during 2006-07 included Kotak Mahindra Bank Ltd. (79.9 per cent), Yes Bank (51.4 per cent), Axis Bank5 (44.6 per cent), Centurian Bank of Punjab Ltd. (43.6 per cent), ICICI Bank Ltd. (40.5 per cent) and HDFC Bank Ltd. (38.4 per cent). However, share prices of Bank of Rajasthan Ltd., IndusInd Bank Ltd. and United Western Bank declined during the year.
3.101 The price/earning ratio of both public and private sector banks ranged widely. At end-March 2007, while the P/E ratio of public sector banks ranged between 4.3 (Allahabad Bank) and 11.5 (State Bank of India), the P/E ratio of private sector banks ranged between 3.8 (Bank of Rajasthan Ltd.) and 110.7 (Kotak Mahindra Bank Ltd.) (Table III.41).
3.102 Bank stocks continued to constitute a significant portion of market capitalisation of the Indian equity market even though there was some decline in their share at end-March 2007 in comparison with end-March 2006. However, the share of market capitalisation of bank stocks in total market capitalisation recovered somewhat during 2007-08 (up to October 2007). The share of turnover of bank stocks in total turnover, however, declined during 2006-07. During the current financial year (up to October 2007), the share of bank stocks in total turnover increased significantly (Table III.42).
Shareholding Pattern in Public Sector Banks
3.103 The process of diversification of ownership of public sector banks continued during 2006-07. The number of public sector banks with private shareholding up to 10 per cent declined from four at end-March 2006 to three at end-March 2007, while those with more than 10 per cent and up to 20 per cent increased from nil to one (Table III.43 and Appendix Table III.32).
3.104 Along with their increased exposure to the Indian capital market, foreign financial institutions (FFIs) also consolidated their holding in Indian banks. At end-March 2007, FFIs held the majority shareholding in six new private sector banks (as against one last year) and two old private sector banks (nil last year). FFIs shareholding in other private sector banks also increased during the year. FFIs shareholding in public sector banks also increased. FFIs shareholding was more than 10 per cent and up to 20 per cent in 13 public sector banks (as against 10 last year) and up to 10 per cent in five public sector banks (as against two last year) (Table III.44).
Table III.41: Share Prices and Price/
Earning Ratios of Bank Stocks at BSE |
Bank |
Average Daily Closing |
Percentage
Variation |
P/E Ratio |
|
Price (Rs.) |
in Prices |
( End-March) |
|
2005-06 |
2006-07 |
|
2006 |
2007 |
1 |
2 |
3 |
4 |
5 |
6 |
Public Sector Banks |
|
|
|
|
|
Allahabad Bank |
85.44 |
80.11 |
-6.24 |
5.0 |
4.3 |
Andhra Bank |
96.29 |
81.19 |
-15.68 |
8.1 |
6.9 |
Bank of Baroda |
226.15 |
237.63 |
5.08 |
10.1 |
7.6 |
Bank of India |
117.00 |
150.61 |
28.73 |
9.2 |
7.3 |
Bank of Maharashtra |
33.35 |
32.19 |
-3.48 |
26.0 |
6.2 |
Canara Bank |
225.17 |
242.09 |
7.51 |
8.2 |
5.6 |
Corporation Bank |
370.63 |
316.81 |
-14.52 |
12.3 |
7.7 |
Dena Bank |
32.87 |
32.24 |
-1.92 |
20.3 |
5.0 |
Indian Overseas Bank |
89.85 |
100.81 |
12.20 |
6.7 |
5.6 |
Oriental Bank of Commerce |
260.46 |
212.28 |
-18.50 |
7.4 |
5.7 |
Punjab National Bank |
420.43 |
455.11 |
8.25 |
10.3 |
9.7 |
Syndicate Bank |
75.66 |
73.42 |
-2.96 |
8.7 |
4.7 |
Union Bank of India |
118.47 |
113.76 |
-3.98 |
9.1 |
6.2 |
Vijaya Bank |
60.48 |
47.18 |
-21.99 |
18.0 |
6.3 |
State Bank of India |
811.67 |
997.31 |
22.87 |
11.6 |
11.5 |
State Bank of Bikaner and Jaipur |
2,757.41 |
3,465.41 |
25.68 |
14.4 |
5.5 |
State Bank of Mysore |
3,513.28 |
5,391.86 |
53.47 |
10.5 |
7.4 |
State Bank of Travancore |
2,697.68 |
3,575.63 |
32.54 |
8.0 |
4.6 |
UCO Bank |
27.96 |
21.45 |
-23.28 |
10.8 |
5.4 |
Other Public Sector Banks |
|
|
|
|
|
IDBI Ltd. |
98.28 |
75.18 |
-23.50 |
10.1 |
8.9 |
Private Sector Banks |
|
|
|
|
|
Axis Bank |
273.09 |
394.79 |
44.56 |
20.5 |
21.0 |
Bank of Rajasthan Ltd. |
52.07 |
37.94 |
-27.14 |
39.8 |
3.8 |
City Union Bank Ltd. |
97.83 |
128.98 |
31.84 |
4.8 |
5.7 |
Centurion Bank of Punjab Ltd. |
19.08 |
27.39 |
43.55 |
152.0 |
48.5 |
Dhanalakshmi Bank |
31.81 |
38.14 |
19.90 |
10.5 |
11.6 |
Federal Bank Ltd. |
175.56 |
205.36 |
16.97 |
7.7 |
6.3 |
ING Vysya Bank |
158.37 |
144.76 |
-8.59 |
143.6 |
17.9 |
Indusind Bank Ltd. |
61.38 |
45.13 |
-26.47 |
36.9 |
19.7 |
Jammu and Kashmir Bank Ltd. |
442.28 |
494.24 |
11.75 |
12.4 |
11.4 |
Karnataka Bank Ltd. |
102.68 |
121.61 |
18.44 |
6.9 |
11.7 |
Karur Vysya Bank Ltd. |
174.89 |
228.93 |
30.90 |
6.5 |
8.7 |
Kotak Mahindra Bank Ltd. |
192.96 |
347.18 |
79.92 |
72.7 |
110.7 |
South Indian Bank Ltd. |
65.72 |
73.99 |
12.58 |
8.5 |
6.7 |
United Western Bank # |
37.46 |
28.89 |
-22.88 |
-2.4 |
_ |
Bank of Punjab Ltd. * |
34.42 |
_ |
_ |
_ |
_ |
HDFC Bank Ltd. |
658.46 |
911.35 |
38.41 |
27.8 |
26.6 |
ICICI Bank Ltd. |
506.31 |
711.37 |
40.50 |
21.8 |
28.8 |
Yes Bank |
72.10 |
109.13 |
51.36 |
49.0 |
41.8 |
#: United Western Bank Ltd. was merged with IDBI Ltd. on September 30, 2006.
* : Bank of Punjab Ltd. Merged with Centurion Bank Ltd.
– : Not Available.
Note: Averages are calculated using daily closing prices. |
Table III.42: Relative Share of Bank Stocks – |
Turnover and Market Capitalisation |
(Per cent) |
Year |
Share of
turnover of |
Share of
capitalisation |
|
bank stocks
in total |
of bank
stocks in |
|
turnover |
total market
capitalisation* |
1 |
2 |
3 |
2005-06 |
6.8 |
7.1 |
2006-07 |
5.3 |
6.8 |
2007-08 |
|
|
(April-October) |
6.6 |
7.9 |
* : As at end-period.
Note : Data for turnover and market capitalisation
of banks relate to Bank Nifty Index of NSE.
Source : National Stock Exchange of India Limited (NSE). |
7. Technological Developments in Banks
3.105 Technological developments have vastly altered the banking landscape in India with significant improvement in processes and procedures leading to higher productivity, rapid product development through alternative delivery channels, and reduction in the transaction cost. In particular, the technology is being leveraged increasingly to expand the banking outreach, especially in the rural areas (Box III.3).
3.106 The process of computerisation, which was the starting point of all technological initiatives, is reaching near completion for most of the banks. Public sector banks continued to
Table III.43: Private Shareholding in |
Public Sector Banks* |
(As at end-March) |
Category |
2006 |
2007 |
1 |
2 |
3 |
Up to 10 per cent |
4 |
3 |
More than 10 and up to 20 per cent |
– |
1 |
More than 20 and up to 30 per cent |
3 |
3 |
More than 30 and up to 40 per cent |
3 |
3 |
More than 40 and up to 49 per cent |
11 |
11 |
– : Nil/negligible
* : Including 19 nationalised banks,
State Bank of India and IDBI Ltd. |
expend large amounts on computerisation and development of communication networks. The cumulative amount spent during September 1999 to March 2007 aggregated Rs.12,826 crore (Appendix Table III.33).
3.107 The proportion of branches providing ‘core banking solutions’ (CBS) increased rapidly to 44.4 per cent at end-March 2007 from 28.9 per cent at end-March 2006. Seven subsidiary banks of State Bank of India have fully implemented the core banking solutions. Additionally, eight more public sector banks, viz., Andhra Bank, Bank of Baroda, Bank of India, Bank of Maharashtra, Corporation Bank, Punjab National Bank, Vijaya Bank and State Bank of India achieved full computerisation, albeit the Each hand held model can be used to service 500 to 1000 accounts by a BC; the device when seen in the context of its servicing capabilities and range is very cost effective. Such models have already been adopted by some private sector and public sector banks. In the Annual Policy for the year 2007-08, banks were urged to scale up IT initiatives for financial inclusion speedily while ensuring that solutions are highly secure, amenable to audit, and follow widely accepted open standards to ensure eventual inter-operability among the different systems. implementation of core banking is still under progress (Table III.45 and Appendix Table III.34).
Table III.44: Foreign Financial Institutions (Non-resident)
Shareholding in Indian Banks |
(As at end-March) |
(No. of banks) |
Category |
Public
Sector Banks |
New Private
Sector Banks |
Old Private
Sector Banks |
|
2006 |
2007 |
2006 |
2007 |
2006 |
2007 |
|
|
|
|
|
|
|
1 |
2 |
3 |
4 |
5 |
6 |
7 |
|
|
|
|
|
|
|
Nil |
14 |
8 |
3 |
– |
11 |
4 |
Up to 10 per cent |
2 |
5 |
– |
– |
4 |
9 |
More than 10 and up to 20 per cent |
10 |
13 |
2 |
– |
1 |
– |
More than 20 and up to 30 per cent |
2 |
2 |
1 |
1 |
1 |
1 |
More than 30 and up to 40 per cent |
– |
– |
– |
– |
– |
1 |
More than 40 and up to 50 per cent |
– |
– |
1 |
1 |
1 |
– |
More than 50 and up to 60 per cent |
– |
– |
– |
3 |
– |
1 |
More than 60 and up to 70 per cent |
– |
– |
– |
2 |
– |
– |
More than 70 and up to 80 per cent |
– |
– |
1 |
1 |
– |
1 |
Total |
28 |
28 |
8 |
8 |
18 |
17 |
– : Nil/Negligible. |
Box III.3: Technology Based Solutions for Rural Credit Delivery
The Reserve Bank has been encouraging banks to use technology-based solutions for increased financial inclusion. Credit delivery in rural areas has often been expensive for banks with large number of small loan accounts to be serviced. Information Technology (IT) enabled methods are being looked into as the best alternative for rural credit delivery that can increase outreach and reduce cost of delivery.
Permission to banks to appoint business correspondents (BCs) has opened possibilities of outreach which were not available earlier. The use of appropriate technology by the BCs has the potential of reducing operational costs and building up a powerful management information system (MIS) in addition to creating rural employment. The use of technology combined with an effective use of BCs has the potential of creating a banking outpost in every village, which can enhance the rural credit delivery.
Several models have emerged in the last couple of years to enable technology driven rural outreach by banks. Nearly all of them converge on the following essential components; i) a customer with a multi application smart card which can be a contact card or a contact-less card, ii) business correspondent with a simputer/hand held terminal/mobile phone enabling banking services, iii) a central processor unit, iv) the bank, and v) a centralised card management for each of the above systems.
The technology application model is premised on providing financial services in the rural areas through the BC model using low cost and simple IT based solutions. A central system which could be a shared infrastructure providing for economies of scale and consequential cost benefits, and a field system which enables access to the central computer by the BCs are essential components of the model. Hand held computer devices which connect to remote servers using fixed line connectivity and mobile technology are being extensively used. Finger print method for uniquely identifying customers for extending financial services is being widely accepted. It has been observed that bio-metric identification for KYC purposes is emerging as the most popular method. Transactions in the accounts such as cash deposits and withdrawals can be carried out by customers without having to go to the bank branch. The customers are issued hard copy of transaction details facilitated by a tiny printer.
An IT enabled model for banking outreach is basically implemented as under:
• Information regarding potential customer is collected by business facilitators and passed on to the bank in a prescribed format or the BC enrolls the customer account for the bank.
• Banks carry out KYC scrutiny and arrange for opening a savings bank account for the customer, after relevant information is captured, such as his photograph, fingerprints and signature (optional). This information is encrypted in the smart card.
• While handing over the card to the customer, the BC activates the card for the customer by fingerprint identification. At the time of activation, the balance available in the bank account is recorded on the smart card.
• A customer can withdraw and deposit money using his smart card at the terminal of the BC. Every time a transaction is made, a print out is provided to the customer. Transactions cannot be undertaken unless a biometric verification of the cardholder is done.
• Banking transactions are freed from branch timings and can be done whenever the BC is available with a capture device.
• If a BC does not have requisite money to pay the customer, a print out will be given to him stating that no cash is available at the customer’s end. This information will be passed on to the bank through the central processor to facilitate immediate replenishment of cash. Incidentally, this also acts as a check to prevent business correspondents from denying service to customers.
´ The terminal with the BC is operated with a rechargeable battery and not dependant on steady supply of electricity.
• An added facility that can be enabled is that the customer can use the smart card as a debit card at merchant establishments.
• A central processor unit integrates village level terminals and identified merchant establishments with the bank.
• The technology seamlessly integrates into core banking solutions of the banks concerned and supports various types of deposits and loan accounts.
3.108 Of the twenty seven public sector banks, 15 banks have computerised their branches fully, while six banks have computerised between 70 to 90 per cent of their branches. Only four banks, viz., Punjab and Sind Bank, UCO Bank, Union Bank of India and United Bank of India have yet to fully computerise more than half of their branches (Table III.46).
3.109 The total number of ATMs installed by the banks were 27,088 at end-March 2007 as compared with 20,267 at end-March 2006. ATMs installed by foreign banks and new private sector
Table III.45: Computerisation in |
Public Sector Banks |
(As at end-March) |
(Per cent) |
Category |
2006 |
2007 |
1 |
2 |
3 |
Fully Computerised Branches (i+ii) |
77.5 |
85.6 |
i) |
Branches Under Core Banking
Solution |
28.9 |
44.4 |
ii) |
Branches already Fully Computerised # |
48.5 |
41.2 |
Partially Computerised Branches |
18.2 |
13.4 |
# : Other than branches under Core Banking Solution. |
banks were more than three times of their branches, while the ATM to branch ratio was much lower for public sector (32.9 per cent) and old private sector banks (34.9 per cent) (Table III.47). ATMs in the case of two public sector banks (Corporation Bank and IDBI Ltd.) were more than their branches. At individual bank level, the number of ATMs exceeded branches in respect of all new private sector banks except Yes Bank Ltd. In the case of old private sector banks, the ATM to branch ratio was less than 100 per cent for all, except SBI Commercial and International Bank Ltd. Most foreign banks operated with limited branches in urban and metropolitan areas. The number of ATMs, in general, operated by them far exceeded the number of branches with the ATMs of Citibank more than 10 times the number of their branches (Appendix Table III.35).
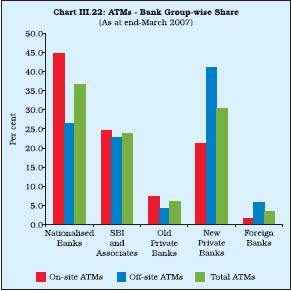
3.110 Of all the ATMs installed in the country at end-March 2007, new private sector banks had the largest share in off-site ATMs, while nationalised banks had the largest share in on-site ATMs (Chart III.22).
Table III.46: Computerisation of Branches – |
Public Sector Banks |
(As at end-March) |
(Number of banks) |
Extent of Computerisation |
2006 |
2007 |
1 |
2 |
3 |
Nil |
– |
– |
Up to 10 per cent |
1 |
– |
More than 10 and up to 20 per cent |
– |
1 |
More than 20 and up to 30 per cent |
2 |
1 |
More than 30 and up to 40 per cent |
2 |
1 |
More than 40 and up to 50 per cent |
– |
1 |
More than 50 and up to 60 per cent |
3 |
– |
More than 60 and up to 70 per cent |
2 |
1 |
More than 70 and up to 80 per cent |
2 |
1 |
More than 80 and up to 90 per cent |
– |
4 |
More than 90 and less than 100 per cent |
5 |
2 |
Fully Computerised |
10 |
15 |
Total* |
27 |
27 |
* : Excludes IDBI. |
3.111 Reflecting the increased application of technology, the use of electronic payments, both retail and card-based, has increased in recent years. The volume of electronic transactions increased by 32.9 per cent during 2006-07 as compared with 24.5 per cent in the previous year. In terms of value, the growth was as high as 61.0 per cent as compared with 34.6 per cent in the last year (Table III.48).
Table III.47: Branches and ATMs of Scheduled Commercial Banks |
(As at end-March 2007) |
Bank Group |
Number of Bank/Branches |
Number of ATMs |
Off-site ATMs
as percent- |
ATMs as
percent- |
|
Rural |
Semi- urban |
Urban politan |
Metro- |
Total |
On-site |
Off-site |
Total |
age of
total ATMs |
age of
Branches |
1 |
2 |
3 |
4 |
5 |
6 |
7 |
8 |
9 |
10 |
11 |
i) |
Nationalised Banks |
12,986 |
7,573 |
7,612 |
7,465 |
35,636 |
6,634 |
3,254 |
9,888 |
27.4 |
27.7 |
ii) |
State Bank Group |
5,126 |
4,155 |
2,556 |
2,193 |
14,030 |
3,655 |
2,786 |
6,441 |
43.3 |
45.9 |
iii) |
Old Private Sector Banks |
855 |
1,510 |
1,294 |
947 |
4,606 |
1,104 |
503 |
1,607 |
31.3 |
34.9 |
iv) |
New Private Sector Banks |
130 |
554 |
824 |
989 |
2,497 |
3,154 |
5,038 |
8,192 |
61.5 |
328.1 |
v) |
Foreign Banks |
– |
2 |
44 |
227 |
273 |
249 |
711 |
960 |
74.1 |
351.6 |
Total (i to v) |
19,097 |
13,794 |
12,330 |
11,821 |
57,042 |
12,796 |
12,292 |
27,088 |
42.3 |
47.5 |
Table III.48: Transactions through Retail Electronic Payment Methods |
Type |
Volume of transactions |
Growth in volume |
Value of transactions |
Growth in value |
|
(000’s) |
(per cent) |
(Rs. crore) |
(per cent) |
|
2004-05 |
2005-06 |
2006-07 |
2005-06 |
2006-07 |
2004-05 |
2005-06 |
2006-07 |
2005-06 |
2006-07 |
1 |
2 |
3 |
4 |
5 |
6 |
7 |
8 |
9 |
10 |
11 |
1. |
ECS-Credit |
40,051 |
44,216 |
69,019 |
10.4 |
56.1 |
20,180 |
32,324 |
83,273 |
60.2 |
157.6 |
2. |
ECS-Debit |
15,300 |
35,958 |
75,202 |
135.0 |
109.1 |
2,921 |
12,986 |
25,441 |
344.6 |
95.9 |
3. |
EFT/ NEFT |
2,549 |
3,067 |
4,776 |
20.3 |
55.7 |
54,601 |
61,288 |
77,446 |
12.2 |
26.4 |
4. |
Credit Cards |
1,29,472 |
15,6086 |
16,9536 |
20.6 |
8.6 |
25,686 |
33,886 |
41,361 |
31.9 |
22.1 |
5. |
Debit Cards |
41,532 |
45686 |
60,177 |
10.0 |
31.7 |
5,361 |
5,897 |
8,172 |
10.0 |
38.6 |
Total |
2,28,904 |
2,85,013 |
3,78,710 |
24.5 |
32.9 |
1,08,749 |
1,46,381 |
2,35,693 |
34.6 |
61.0 |
3.112 The use of ECS (credit) and ECS (debit), in particular, increased sharply during 2006-07 (Chart III.23).
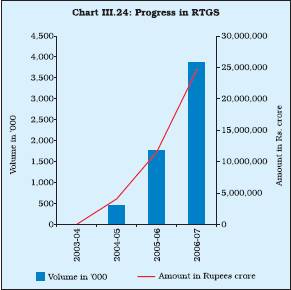
3.113 The large value payment systems include the real time gross settlement (RTGS), Government securities clearing and forex clearing. The RTGS system has been in operation for more than three years and has been working smoothly since its operationalisation in March 2004. At present, 100 participants (92 banks, seven primary dealers and the Reserve Bank) are members of the RTGS system. The reach and utilisation of the RTGS is on the increase which could be attributed to the bank/branch network coverage under the system. (Chart III.24). At present, 32,768 branches provide the RTGS facility.
8. Regional Spread of Banking
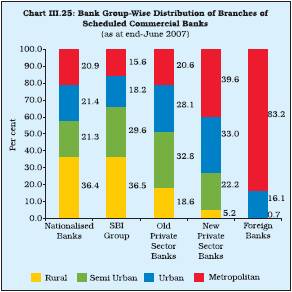
3.114 The total number of branches of SCBs (including RRBs) increased from 69,801 at end-June 2006 to 71,781 at end-June 2007. These comprised 30,633 rural branches, 16,310 semi-urban branches and 24,838 urban and metropolitan branches. The share of rural branches declined further to 42.7 per cent during 2006-07 from 43.7 per cent in the previous year,

while the shares of all other population groups increased. Nearly half of the total branches of all bank groups are operated by nationalised banks, followed by RRBs (20.2 per cent) and SBI group (19.6 per cent). The share of branches operated by new private sector banks increased to 3.8 per cent at end-June 2007 from 2.9 per cent at end-June 2006. The number of branches of old private sector banks across all population groups declined. Foreign bank branches were mostly concentrated in the urban and metropolitan areas with negligible presence in rural and semi-urban areas (Chart III.25 and Appendix Table III.36).
3.115 The top hundred centres arranged according to the size of deposits accounted for 68.9 per cent of total deposits, while the top hundred centres arranged according to the size of bank credit accounted for 77.4 per cent of total bank credit at end-March 2007. The shares of top hundred centres in total deposits and total bank credit have increased in recent years (Table III.49).
3.116 The Southern region continued to account for the largest percentage of existing bank branches, followed by the Central, Eastern, Northern and Western regions (Chart III.26). The share of North-Eastern region remained low at 2.7 per cent at end-June 2007. During July 2006 to June 2007, most of the new branches were opened in the Southern (666 or 28.2 per cent) and Northern (446 or 18.9 per cent) regions. The average population served by a single bank branch
in various regions remained more or less at the previous year’s level (Appendix Table III.37).
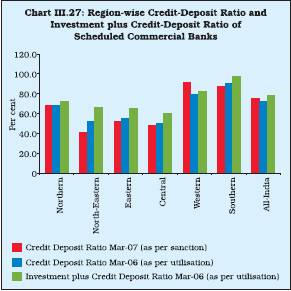
3.117 The all-India credit-deposit ratio (as per sanctions) increased sharply to 75.0 per cent at end-March 2007 from 72.4 per cent at end-March 2006. The credit-deposit ratio (CDR) as well as investment plus credit-deposit ratio of the Southern and Western regions remained higher than the all-India level (Chart III.27). While the CDR in most of the States increased in line with the all-India trend, the CDR in some of the States, viz., Meghalaya, Bihar, Orissa, Andaman and Nicobar Islands, Maharashtra, Dadra and Nagar Haveli, Lakshadweep and Puducherrry witnessed
Table III.49: Share of Top Hundred Centres in |
Aggregate Deposits and Gross Bank Credit |
(Per cent) |
As at end-March |
Deposits |
Credit |
|
Offices |
Amount |
Offices |
Amount |
1 |
2 |
3 |
4 |
5 |
2000 |
21.9 |
59.0 |
21.5 |
74.7 |
2001 |
22.3 |
58.9 |
21.9 |
75.3 |
2002 |
22.5 |
59.1 |
22.1 |
77.0 |
2003 |
22.7 |
61.0 |
22.4 |
75.9 |
2004 |
23.1 |
63.6 |
22.9 |
75.5 |
2005 |
23.8 |
65.3 |
23.7 |
75.9 |
2006 |
24.2 |
67.0 |
24.0 |
76.5 |
2007 |
24.9 |
68.9 |
24.8 |
77.4 |
Source : Basic Statistical Return-7. |

a moderate to sharp decline (Appendix Table III.38). The CDR, as per sanctions, at end-March 2007 in six States/Union Territories, viz., Rajasthan, Maharashtra, Andhra Pradesh, Karnataka, Tamil Nadu and Chandigarh was higher than the all-India level.
3.118 The credit-deposit ratio (CDR) has been widely used as an indicator of credit absorption in a particular geographical area. The region/ State-wise CDR exhibited wide variations in recent years (Box III.4). In order to ensure adequate flow of credit as also to reduce the wide disparity in the CDR between different states/regions, banks were advised by the Reserve Bank to attain a CDR of 60 per cent in rural and semi-urban branches separately. The Task Forces for Rajasthan, Uttar
Pradesh, Bihar, West Bengal, Kerala and the Union Territory of Puducherry were set up in the early 1990s to define measures for improving the CDR in States where it was declining. A Committee (Chairperson: Smt. Usha Thorat) was also constituted by the Reserve Bank to improve CDR and the provisions of financial services in the North-Eastern region and prepare an appropriate State-specific monitorable action plan for the region for achieving greater financial inclusion. Further, an Expert Group (Chairman: Shri Y S P Thorat) was constituted to suggest measures for improving CDR in States where it is less than 60 per cent.
Foreign Banks’ Operations in India
3.119 At end-October 2007, 29 foreign banks were operating in India with 273 branches (Table III.50). These banks originated from 19 countries. In addition, 34 foreign banks operated in India through representative offices. During the period from July 2006 to June 2007, approvals were given to seven existing foreign banks to open 20 branches in India and to seven foreign banks to open representative offices in India.
3.120 Six foreign banks, viz., ABN Amro Bank, Barclays Bank, Hong Kong and Shanghai Banking Corporation, Shinhan Bank, Deutsche Bank AG and Standard Chartered Bank together set up 13 branches during July 2006 to October 2007. Besides, four foreign banks, viz., Banco Bilbao Vizcaya Argentaria (BBVA), Banca di Roma, Depfa Bank PLC., and National Australia Bank Ltd. opened four representative offices in Mumbai during the same period. Consequent to the global acquisition of Banca Nationale Del Lavoro (BNL) by BNP Paribas, BNL closed its sub-offices in New
Box III.4: Region/State-wise Trends in Credit-Deposit Ratio
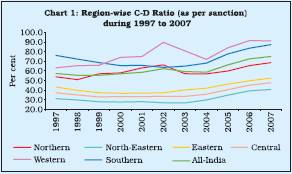
Region-wise analysis of CDR (as per sanction) revealed that during 1997-2007, it was lowest in the north-eastern region, followed by the central and eastern regions. The western and southern regions, on the other hand, had consistently high CDR above the all-India level. The CDR in the northern region fluctuated in a narrow range around the all-India level. The CDR exhibited a near secular decline during 1997-2003 in the north-eastern region from 31.2 per cent in March 1997 to 26.8 in March 2003. Similar trend was also observed both in central and eastern regions (Chart 1).
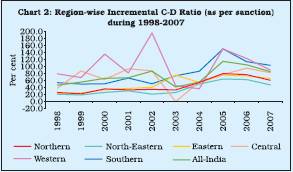
Region-wise analysis of incremental CDR (as per sanction) reveals that during 1998-2007 while the ratio was lowest in the north eastern region, it was highest in the western region during most of the years. The incremental CDR for the northeastern, central and eastern regions depicted an increasing trend up to 2005, but declined marginally thereafter (Chart 2).
The gap between CDR as per sanctions (CDRs) and CDR as per utilisation (CDRu), indicates net migration of credit in a geographical area (positive difference indicates outward flow of credit, while negative difference reflects inward flow). The credit migration needs to be viewed in the context that the corporate offices of major borrowers as also bank branches dealing with large borrowers are located at select major financial centers, while the industrial units and projects
where borrowed funds are utilised may be located elsewhere. CDR gap (i.e., CDRs - CDRu) during 1999-2006 indicated that the western region was a net provider of funds to other regions, in terms of credit utilisation, with the gap CDR moving up from 0.9 percentage points in March 1999 to 13.1 percentage points in March 2006. This was entirely on account of Maharashtra (CDRs higher than CDRu). During 2002 and 2003, the CDR gap in the north-eastern region was -26.0 percentage points and -20.7 percentage points, respectively. The position of northern region, which experienced flight of credit as per the utilisation up to 2003, saw a reversal from 2004 with net inflow of funds thereafter. Accordingly, CDRu was in excess of CDRs by 3.2 percentage points in March 2006, mainly accounted for by Himachal Pradesh and Haryana (Chart 3).
State-wise analysis of CDR, as per sanction, also reveals wide variations. Among the States in the northern region, Himachal Pradesh recorded the lowest CDR, which was less than 25 per cent up to 2003, though it improved subsequently to 41.5 per cent in March 2007. Chandigarh and Delhi, on the other hand, had very high CDRs. In Chandigarh, the ratio was in excess of 100 per cent during 2002-2004. Arunachal Pradesh and Nagaland recorded the lowest CDR among the States in the north-eastern region. The CDR in Manipur and Tripura in March 2007 was lower than that in March 1997 despite some rise in recent years. The CDR in Assam, which was 35.2 per cent in March 1997, declined to 28.6 per cent in March 2003, but improved to 43.3 per cent in March 2007. Among the States in the eastern region, Sikkim witnessed the lowest CDR. The CDR in West Bengal, which remained below 50 per cent up to 2004, improved to 62.6 per cent in March 2007. In the central region, Uttarakhand had the lowest CDR. The CDR in Chattisgarh improved in recent years and was at 53.0 per cent in March 2007. In the western region, Goa recorded the lowest CDR. Maharashtra has registered the highest CDR in the region, followed distantly by Gujarat. Tamil Nadu had the highest CDR among the States in southern region, followed by Andhra Pradesh and Karnataka, while Kerala had the lowest CDR (below 50 per cent up to March 2004, and 63.6 per cent in March 2007).
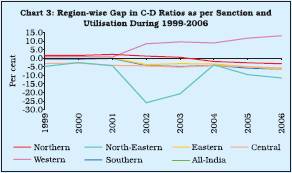
Table III.50: List of Foreign Banks
Operating in India – Country-wise |
|
|
(As at end-
October, 2007) |
|
Sr. No. |
Name of Bank |
Country of
Incorporation |
No. of branches
in India |
1 |
2 |
3 |
4 |
1. |
ABN-AMRO Bank N.V. |
Netherlands |
28 |
2. |
Abu Dhabi Commercial Bank Ltd. |
UAE |
2 |
3. |
Arab Bangladesh Bank Ltd. |
Bangladesh |
1 |
4. |
American Express Bank Ltd. |
USA |
7 |
5. |
Antwerp Diamond Bank N.V. |
Belgium |
1 |
6. |
Bank International Indonesia |
Indonesia |
1 |
7. |
Bank of America |
USA |
5 |
8. |
Bank of Bahrain & Kuwait BSC |
Bahrain |
2 |
9. |
Bank of Nova Scotia |
Canada |
5 |
10. |
Bank of Tokyo-Mitsubishi UFJ Ltd. |
Japan |
3 |
11. |
BNP Paribas |
France |
8 |
12. |
Bank of Ceylon |
Sri Lanka |
1 |
13. |
Barclays Bank Plc |
UK |
4 |
14. |
Calyon Bank |
France |
5 |
15. |
Citibank N.A. |
USA |
39 |
16. |
Chinatrust Commercial Bank |
Taiwan |
1 |
17. |
Deutsche Bank |
Germany |
11 |
18. |
DBS Bank Ltd. |
Singapore |
2 |
19. |
HSBC |
Hongkong |
47 |
20. |
J.P. Morgan Chase Bank N.A. |
USA |
1 |
21. |
Krung Thai Bank Public Co. Ltd. |
Thailand |
1 |
22. |
Mizuho Corporate Bank Ltd. |
Japan |
2 |
23. |
Mahreqbank PSC |
UAE |
2 |
24. |
Oman International Bank SAOG |
Sultanate of Omen |
2 |
25. |
Shinhan Bank |
South Korea |
2 |
26. |
Standard Chartered Bank |
UK |
83 |
27. |
Sonali Bank |
Bangladesh |
2 |
28. |
Societe Generale |
France |
2 |
29. |
State Bank of Mauritius |
Mauritius |
3 |
|
Total |
273 |
Delhi and Chennai and representative office in Mumbai in March 2007.
Indian Banks’ Operations Abroad
3.121 Indian banks continued to rapidly expand their presence overseas. During 2006-07, nine public sector banks and two new private sector bank opened ten branches, two subsidiaries, six representative offices and one joint venture unit mainly in the Asian and Middle East countries.
3.122 Sixteen Indian banks (11 from public sector and five from private sector operated a network of 192 offices (125 branches, 39 representative offices, seven joint ventures and 21 subsidiaries) abroad at end-October 2007 (Table III.51). Bank of Baroda had the largest overseas presence (43 branches, eight subsidiaries, four representative offices and one joint venture bank in 20 countries), followed by State Bank of India (33 branches, six subsidiaries, seven representative offices and four joint venture banks in 29 countries) and Bank of India (22 branches, two subsidiaries, three representative offices and one joint venture bank in 14 countries).
3.123 No new overseas banking unit (OBU) was opened during July 2006 to October 2007. Seven OBUs of six banks, viz., State Bank of India, Bank of Baroda, Union Bank of India, Punjab National Bank, ICICI Bank and Canara Bank continued to operate from three Special Economic Zones (SEZs), viz., SEEPZ (Mumbai), NOIDA and Kochi.
Table III.51: Overseas Operations of Indian Banks |
(Actually Operational) |
|
Name of the Bank |
Branch |
Subsidiary |
Representative Office |
Joint Venture Bank |
Total |
|
|
2005-06 |
2006-07 |
2005-06 |
2006-07 |
2005-06 |
2006-07 |
2005-06 |
2006-07 |
2005-06 |
2006-07 |
|
1 |
2 |
3 |
4 |
5 |
6 |
7 |
8 |
9 |
10 |
11 |
I. |
Public Sector Banks |
106 |
116 |
15 |
19 |
24 |
26 |
6 |
7 |
151 |
168 |
|
1. Allahabad Bank |
– |
1 |
– |
– |
1 |
1 |
– |
– |
1 |
2 |
|
2. Andhra Bank |
– |
– |
– |
– |
1 |
1 |
– |
– |
1 |
1 |
|
3. Bank of Baroda |
40 |
43 |
7 |
8 |
3 |
4 |
1 |
1 |
51 |
56 |
|
4. Bank of India |
20 |
22 |
1 |
2 |
4 |
3 |
1 |
1 |
26 |
28 |
|
5. Bharat Overseas Bank |
1 |
– |
– |
– |
– |
– |
– |
– |
1 |
– |
|
6. Canara Bank |
1 |
2 |
1 |
1 |
1 |
1 |
– |
– |
3 |
4 |
|
7. Indian Bank |
3 |
3 |
– |
– |
– |
– |
– |
– |
3 |
3 |
|
8. Indian Overseas Bank |
5 |
6 |
1 |
1 |
2 |
2 |
– |
– |
8 |
9 |
|
9. Punjab National Bank |
1 |
1 |
– |
1 |
4 |
4 |
1 |
1 |
6 |
7 |
|
10.State Bank of India |
30 |
33 |
5 |
6 |
7 |
7 |
3 |
4 |
45 |
50 |
|
11.Syndicate Bank |
1 |
1 |
– |
– |
– |
– |
– |
– |
1 |
1 |
|
12.UCO Bank |
4 |
4 |
– |
– |
1 |
2 |
– |
– |
5 |
6 |
|
13.Union Bank |
N.A. |
– |
N.A. |
– |
N.A. |
1 |
N.A. |
– |
N.A. |
1 |
II. |
New Private Sector Banks |
6 |
9 |
4 |
3 |
10 |
13 |
1 |
– |
21 |
25 |
|
14.Axix Bank |
1 |
3 |
– |
– |
– |
1 |
– |
– |
1 |
4 |
|
15.Centurian Bank of Punjab Ltd. |
– |
– |
1 |
– |
– |
1 |
1 |
– |
2 |
1 |
|
16.HDFC Bank Ltd. |
– |
– |
– |
– |
1 |
1 |
– |
– |
1 |
1 |
|
17.ICICI Bank Ltd. |
5 |
6 |
3 |
3 |
7 |
8 |
– |
– |
15 |
17 |
|
18.IndusInd Bank Ltd. |
– |
– |
– |
– |
2 |
2 |
– |
– |
2 |
2 |
|
Total |
112 |
125 |
19 |
22 |
34 |
39 |
7 |
7 |
172 |
193 |
– : Nil/Negligible. N.A. : Not Available.
Note : Data for 2005-06 relate to end-September 2006
while that for 2006-07 relate to end-August 2007. |
9. Customer Service and Financial Inclusion
3.124 The Reserve Bank has taken several measures in recent years aimed at providing customer service at reasonable cost. These measures include enhancing customer protection and disclosures, code of ethics and grievance redressal, among others. Simultaneously, the Reserve Bank has also made concerted efforts to expand the banking outreach to the wider sections of the population. During 2006-07, the Reserve Bank further fine-tuned its guidelines towards financial inclusion.
3.125 Complaints received against commercial banks located in the jurisdiction of various Banking Ombudsman offices for the period July 1, 2006 to June 30, 2007 have been collated and categorised into ten broad heads, viz., deposit accounts, remittances, credit cards, loans/advances (general and housing loan), charges without prior notice, pension, failure on commitments made, direct selling agents (DSAs), notes and coins and others. While maximum number of complaints in respect of public sector banks and old private sector banks related to deposit accounts during 2006-07, the largest number of complaints in the case of new private sector banks and foreign banks related to credit cards. This was followed by complaints relating to loans and advances (general) and charges without prior notice. A significant number of complaints also related to pension (especially for public sector banks) and direct selling agents (especially for new private sector banks) (Table III.52 and Appendix Table III.39).
3.126 Region-wise, the highest number of complaints at Banking Ombudsman offices were received in Mumbai (5,525), which was closely followed by New Delhi (5,481) and Kanpur (4,321). Guwahati (170) and Bhubaneswar (689)
Table III.52: Bank-Group-wise Complaints received at Banking Ombudsman Offices |
Nature of complaint |
Scheduled |
Public |
Nationalised |
State |
Private |
Old |
New |
Foreign |
|
Commercial |
Sector |
Banks |
Bank |
Sector |
Private |
Private |
Banks |
|
Banks |
Banks |
|
Group |
Banks |
Sector |
Sector |
|
|
(3+6+9) |
(4+5) |
|
|
(7+8) |
Banks |
Banks |
|
|
|
|
|
|
|
|
|
|
1 |
2 |
3 |
4 |
5 |
6 |
7 |
8 |
9 |
Total No. of Complaints Received (1 to 10) |
34,499 |
21,660 |
10,543 |
11,117 |
9,036 |
825 |
8,211 |
3,803 |
1) |
Deposit Account |
5,578 |
3,664 |
2,126 |
1,538 |
1,591 |
182 |
1,409 |
323 |
2) |
Remittances |
3,919 |
2,918 |
1,408 |
1,510 |
813 |
94 |
719 |
188 |
3) |
Credit Cards |
7,669 |
3,265 |
611 |
2,654 |
2,217 |
54 |
2,163 |
2,187 |
4) |
Loans/Advances (a+b) |
|
|
|
|
|
|
|
|
|
a) General |
4,169 |
2,842 |
1,621 |
1,221 |
1,046 |
159 |
887 |
281 |
|
b) Housing Loans |
649 |
366 |
205 |
161 |
233 |
13 |
220 |
50 |
5) |
Charges without Prior Notice |
2,527 |
1,434 |
662 |
772 |
915 |
47 |
868 |
178 |
6) |
Pension |
1,056 |
1,039 |
523 |
516 |
14 |
6 |
8 |
3 |
7) |
Failure on Commitments Made |
1,402 |
1,006 |
567 |
439 |
314 |
41 |
273 |
82 |
8) |
Direct Selling Agents |
1,026 |
628 |
330 |
298 |
357 |
40 |
317 |
41 |
9) |
Notes and Coins |
126 |
104 |
69 |
35 |
20 |
2 |
18 |
2 |
10) |
Others |
6,378 |
4,394 |
2,421 |
1,973 |
1,516 |
187 |
1,329 |
468 |
offices received the least number of complaints. Complaints received by all other offices ranged between 1,000 and 3,000 (Table III.53).
3.127 The Reserve Bank has made concerted efforts since 2004 to promote financial inclusion. Accordingly, to expand the outreach of banking services to vast sections of the population, banks, in November 2005, were advised to make available
Table III.53: Region-wise Complaints |
received at Banking Ombudsman |
Offices during 2006-07 |
Sr. No. |
Office |
No. of complaints received |
1 |
2 |
3 |
1. |
Ahmedabad |
2,107 |
2. |
Bangalore |
2,406 |
3. |
Bhopal |
2,731 |
4. |
Bhubaneswar |
689 |
5. |
Chandigarh |
2,006 |
6. |
Chennai |
2,387 |
7. |
Guwahati |
170 |
8. |
Hyderabad |
2,767 |
9. |
Jaipur |
2,976 |
10. |
Kanpur |
4,321 |
11. |
Kolkata |
2,011 |
12. |
Mumbai |
5,525 |
13. |
New Delhi |
5,481 |
14. |
Patna |
1,481 |
15. |
Thiruvananthapuram |
1,580 |
|
Total |
38,638 |
a basic ‘no-frills’ account with low or nil balances as well as charges. Following this, several banks have introduced ‘no-frills’ accounts. Between end-March 2006 and end-March 2007, about 6 million new ‘no-frills’ bank accounts were opened. Public sectors banks accounted for bulk of these new ‘no-frills’ accounts due to their vast branch network in rural and semi-urban areas. Financial inclusion is being viewed by these banks as a huge business opportunity in rural and semi-urban areas in an environment of intense competition.
10. Regional Rural Banks
3.128 Regional rural banks (RRBs) were conceived as institutions that combine the local feel and familiarity of co-operatives and the business organisation ability of the commercial banks. In a multi-agency approach for agricultural and rural credit in India, RRBs have a special place. Being local level institutions, RRBs are ideally suited for achieving financial inclusion. RRBs, together with commercial and co-operative banks, have a critical role in the multi-agency approach to delivery of agriculture and rural credit. Accordingly, RRBs formed an important plank of the package of policies announced by the Government of India in June 2004 for doubling the flow of credit by banks to the agricultural sector in three years. To improve the strength and functioning of RRBs and thereby enable them to meet their primary objectives, the Government
undertook the task of restructuring the RRBs. A number of policy initiatives were taken by the Reserve Bank and NABARD to facilitate diversification of their business operation into new areas. To give new directions to RRBs for becoming an important arm for financial inclusion in rural areas, the Government reviewed the performance of RRBs on January 25, 2007. Accordingly, RRBs have been encouraged to enhance their deposit base and increase the credit-deposit ratio from the level of 56 per cent by exploiting the emerging potential under both priority and non-priority sector (see Chapter II). For strengthening the RRBs and making them financially stronger and competitive, the Government further considered recapitalisation of RRBs having negative net worth.
Amalgamation of RRBs
3.129 The Advisory Committee on Flow of Credit to Agriculture and Related Activities (Chairman: Prof. V.S. Vyas) in June 2004 recommended restructuring of RRBs in order to improve the operational viability of RRBs and take advantage of the economies of scale. Following this, an Internal Working Group on RRBs was set up by the Reserve Bank to examine various alternatives available within the existing legal framework for strengthening the RRBs. In order to reposition RRBs as an effective instrument of credit delivery in the Indian financial system, the Government of India, after consultation with NABARD, the concerned State Governments and the sponsor banks initiated State-level sponsor bank-wise amalgamation of RRBs in September 2005 to overcome the deficiencies prevailing in RRBs and making them viable and profitable units. Consequent upon the amalgamation of 147 RRBs into 46 new RRBs, sponsored by 19 banks in 17 States, effected by the Government of India since September 12, 2005, the total number of RRBs declined from 196 to 95 as on August 31, 2007.
3.130 Total districts covered by the 45 amalgamated RRBs were 357 as on March 31, 2007. Each of the RRBs covered districts ranging from 2 to 25. The number of branches of amalgamated RRBs as on March 31, 2007 was 10,563. The branch network of these amalgamated RRBs was quite large, varying from 50 to 677 branches.
3.131 The structural consolidation of RRBs has resulted in the formation of new RRBs, which are financially stronger and bigger in size in terms of business volume and outreach which will enable them to take advantages of the economies of scale and reduce their operational costs. With the advantage of local feel and familiarity, RRBs are in a better position to achieve the objectives of rural development and financial inclusion.
3.132 It was announced in the Union Budget 2007-08 that, among other things, the RRBs, which have a negative net worth, would be recapitalised in a phased manner. Modalities for recapitalisation are being worked out in consultation with select sponsor banks and the National Bank for Agriculture and Rural Development (NABARD).
3.133 The Government of India issued a notification on May 17, 2007 specifying ‘regional rural bank’ as ‘bank’ for the purpose of the Securitisation and Reconstruction of Financial Assets and Enforcement of Security Interest (SARFAESI) Act, 2002.
3.134 With a view to making RRBs important vehicles of credit delivery in rural and backward areas, the Reserve Bank has been taking measures from time to time for strengthening them and improving their performance. Considering the critical role of sponsor banks in positioning the RRBs as partners in the development of the rural sector and in order to encourage synergies between the parent bank and RRBs, the Reserve Bank advised all sponsor banks to take steps on issues pertaining to human resources (HR), information technology (IT) and operations of the RRBs sponsored by them.
Measures to Improve Operational Efficiency
3.135 With a view to improving the performance of RRBs and giving more powers and flexibility to their boards in decision making, the Reserve Bank had constituted the Task Force on Empowering the RRB Boards for Operational Efficiency (Chairman: Dr. K.G. Karmakar) in September 2006. The Task Force was constituted to deliberate and suggest areas where more autonomy could be given to the boards, particularly in matters of investments, business development and staffing, viz., determination of staff strength, fresh recruitment and promotions, among others. In its report submitted on January 31, 2007, the Task Force, made several recommendations relating to operational flexibility of RRBs (Box III.5). While some of the recommendations of the Task Force have been implemented, others are under examination.
Box III.5: The Task Force on Empowering the RRB Boards for Operational Efficiency
The Task Force on Empowering the RRB Boards for Operational Efficiency (Chairman: Dr. K.G. Karmakar) in its report of January 2007 made several recommendations. Some of the key recommendations are as follows:
• The number of directors on the boards of RRBs be raised up to 15 on a selective basis in the case of large sized RRBs created after amalgamation.
• Selection of chairman of RRBs be made on merit from amongst a panel of qualifying officers.
• Minimum tenure of board members be stipulated as 2 years, subject to a maximum of 5 years for the chairman.
• The term of nominee directors should not exceed two terms of two years each.
• Non-official directors on the Boards of RRBs need be oriented towards the functions of RRBs and their responsibilities as nominee directors.
• RRBs should be subjected to the same level of safeguards and regulatory norms regarding capital adequacy as applicable to commercial banks after the process of amalgamation is over.
• RRBs must have the following Committees: (i) Risk Management Committee; (ii) Management Committee; (iii) Investment, Human Resources (HR) and Information Technology (IT) Committees; and (iv) Audit Committee.
• Chairmen of RRBs should also be appointed as members of the Empowered Committee (EC) constituted by the Reserve Bank.
• Matters relating to categorisation of branches, staffing norms and promotion policies and other HR matters may be studied in depth by a Committee/Task Force, set up for the purpose by the Reserve Bank/Government of India.
• RRBs need to take up computerisation of major areas of operations, management information system (MIS) in branches, controlling offices and head office in the next 3 years by adopting an Action Plan.
• RRBs may be allowed to deal in NRE/FCNR(B)/FCRA, certificates of deposits, among others, in consortium with sponsor bank and be given the freedom to place their money in term deposits with any bank.
• RRBs may join in consortium finance with public sector banks/ DFIs.
• Securitisation and Reconstruction of Financial Assets and Enforcement of Security Interest Act, 2002 may be extended to RRBs.
• Provisions under section 80(P) of the Income Tax Act may be continued for a further period of 5 years or till the restructuring process is completed, whichever is earlier.
Financial Performance of RRBs
3.136 The role and financial performance of RRBs have been evolving in response to policy initiatives as well as the changing business environment. The consolidated balance sheet of RRBs expanded by 18.0 per cent during 2006-07 as compared with 15.1 per cent in 2005-06 (Table III.54). On the asset side, net advances of RRBs increased by 22.9 per cent during the period. Among the major items on the liabilities side, borrowings increased by 33.8 per cent and total deposits by 16.6 per cent during the year.
Table III.54: Regional Rural Banks: Consolidated Balance Sheet |
(Amount in Rs. crore) |
Item |
March 31, |
March 31, |
Percentage |
Item |
March 31, |
March 31, |
Percentage |
|
2006 |
2007P |
Variation |
|
2006 |
2007P |
Variation |
1 |
2 |
3 |
4 |
5 |
6 |
7 |
8 |
Liabilities |
89,645 |
105,768 |
17.99 |
Assets |
89,645 |
105,768 |
17.99 |
Share Capital |
196 |
196 |
– |
Cash in Hand |
1,033 |
1,216 |
17.72 |
Reserves |
4,271 |
4,902 |
14.77 |
Balances with RBI |
3,519 |
4,886 |
38.85 |
Share Capital Deposits |
2,180 |
2,188 |
0.37 |
Other Bank Balances |
16,258 |
20,359 |
25.22 |
Deposits |
71,329 |
83,147 |
16.57 |
Other Investments |
24,925 |
25,307 |
1.53 |
|
Current |
3,953 |
4,764 |
20.52 |
Loans and Advances (net) |
38,520 |
47,326 |
22.68 |
|
Savings |
38,233 |
46,122 |
20.63 |
|
|
|
|
|
|
|
|
|
Fixed Assets |
178 |
196 |
10.11 |
|
Term |
29,143 |
32,261 |
10.70 |
|
|
|
|
|
|
|
|
|
Other Assets# |
5,214 |
6,478 |
24.24 |
Borrowings |
7,303 |
9,773 |
33.82 |
|
|
|
|
|
NABARD |
6,301 |
7,525 |
19.43 |
|
|
|
|
|
Sponsor Bank |
959 |
1,998 |
108.34 |
|
|
|
|
|
Others |
43 |
250 |
481.40 |
|
|
|
|
Other Liabilities |
4,367 |
5,562 |
27.36 |
|
|
|
|
Memorandum Items: |
|
|
|
|
|
|
|
a. |
Credit-Deposit Ratio |
55.7 |
58.5 |
|
|
|
|
|
b. |
Investment-Deposit Ratio |
57.7 |
45.8 |
|
|
|
|
|
c. |
(Credit+Investment) |
|
|
|
|
|
|
|
|
Deposit Ratio |
113.4 |
104.3 |
|
|
|
|
|
P : Provisional.
– : Nil/Negligible.
# : Includes accumulated loss.
Source : NABARD. |
3.137 Following the amalgamation of RRBs, the number of both profit-making and loss-making RRBs declined to 81 and 15, respectively, at end-March 2007 from 111 and 22, respectively at end- March 2006 (Table III.55). Increase in interest and other income of RRBs during 2006-07 did not keep pace with the increased expenditure on account of sharp growth in provisions and contingencies and wage bill. Consequently, net profits of RRBs declined from Rs.617 crore during 2005-06 to Rs.596 crore during 2006-07.
Table III.55: Financial Performance of Regional Rural Banks |
(Amount in Rs. crore) |
Particulars |
2005-06 |
2006-07P |
Variation |
|
Loss |
Profit |
Total |
Loss |
Profit |
Total |
Col. (7) |
|
Making |
Making |
RRBs |
Making |
Making |
RRBs |
over |
|
[22] |
[111] |
[133] |
[15] |
[81] |
[96] |
Col. (4) |
1 |
2 |
3 |
4 |
5 |
6 |
7 |
8 |
A. |
Income (i+ii) |
723 |
5,823 |
6,546 |
997 |
6,657 |
7,653 |
1,107 |
|
|
|
|
|
|
|
|
(16.91) |
|
i) |
Interest income |
672 |
5,441 |
6,113 |
932 |
6,182 |
7,113 |
1,000 |
|
|
|
|
|
|
|
|
|
(16.36) |
|
ii) |
Other income |
51 |
382 |
433 |
65 |
475 |
540 |
107 |
|
|
|
|
|
|
|
|
|
(24.71) |
B. |
Expenditure (i+ii+iii) |
912 |
5,017 |
5,929 |
1,298 |
5,759 |
7,057 |
1,128 |
|
|
|
|
|
|
|
|
|
(19.03) |
|
i) |
Interest expended |
471 |
2,790 |
3,261 |
642 |
3,074 |
3,716 |
455 |
|
|
|
|
|
|
|
|
|
(13.95) |
|
ii) |
Provisions and contingencies |
65 |
246 |
311 |
192 |
445 |
636 |
325 |
|
|
|
|
|
|
|
|
|
(104.50) |
|
iii) |
Operating expenses |
376 |
1,981 |
2,357 |
464 |
2,240 |
2,705 |
348 |
|
|
of which : |
|
|
|
|
|
|
(14.76) |
|
|
Out of (iii) |
|
|
|
|
|
|
|
|
|
Wage Bill |
309 |
1,539 |
1,848 |
391 |
1,660 |
2,051 |
203 |
|
|
|
|
|
|
|
|
|
(10.98) |
C. |
Profit |
|
|
|
|
|
|
|
|
i) |
Operating Profit |
-126 |
1,054 |
928 |
-109 |
1,341 |
1,232 |
304 |
|
|
[A - B (i) - B (iii)] |
|
|
|
|
|
|
(32.76) |
|
ii) |
Net Profit (A - B) |
-191 |
808 |
617 |
301 |
897 |
596* |
-21 |
|
|
|
|
|
|
|
|
|
(-3.40) |
D. |
Total Assets |
11,747 |
77,898 |
89,645 |
16,148 |
89,620 |
105,768 |
16,123 |
|
|
|
|
|
|
|
|
|
(17.99) |
E. |
Financial Ratios@ |
|
|
|
|
|
|
|
|
i) |
Operating Profit |
-1.07 |
1.35 |
1.04 |
-0.67 |
1.49 |
1.16 |
|
|
ii) |
Net Profit |
-1.63 |
1.04 |
0.69 |
-1.86 |
1.00 |
0.56 |
|
|
iii) |
Income |
6.15 |
7.48 |
7.30 |
-6.17 |
7.42 |
7.23 |
|
|
|
a) Interest income |
5.72 |
6.98 |
6.82 |
5.77 |
6.89 |
6.72 |
|
|
|
b) Other Income |
0.43 |
0.49 |
0.48 |
0.40 |
0.53 |
0.51 |
|
|
iv) |
Expenditure |
7.76 |
6.44 |
6.61 |
8.03 |
6.42 |
6.67 |
|
|
|
a) Interest expended |
4.01 |
3.58 |
3.64 |
3.97 |
3.43 |
3.51 |
|
|
|
b) Operating expenses |
3.20 |
2.54 |
2.63 |
2.87 |
2.49 |
2.55 |
|
of which: |
|
|
|
|
|
|
|
Wage Bill |
2.63 |
1.98 |
2.06 |
2.42 |
1.85 |
1.93 |
|
|
v) |
Provisions and Contingencies |
0.55 |
0.32 |
0.35 |
1.18 |
0.49 |
0.60 |
|
|
vi) |
Gross NPAs |
|
|
7.28 |
|
|
6.39 |
|
|
vii) |
Net NPAs |
|
|
3.98 |
|
|
3.41 |
|
|
|
|
|
|
|
|
|
|
|
P : Provisional.
@ : Ratios to total assets.
* : Before tax.
Note : Figures within brackets represent number of RRBs.
Figures within brackets in col.8 represent percentage variation over the year.
Source : NABARD. |
Table III.56: Business and Financial Indicators of RRBs |
Indicator |
2000-01 |
2001-02 |
2002-03 |
2003-04 |
2004-05 |
2005-06 |
2006-07 |
1 |
2 |
3 |
4 |
5 |
6 |
7 |
8 |
No.of RRBs |
196 |
196 |
196 |
196 |
196 |
133 # |
96 # |
Net profit (Rs. crore) |
601 |
608 |
519 |
769 |
748 |
617 |
593* |
Per Branch Productivity1 (Rs. crore) |
3.8 |
4.4 |
5.0 |
5.7 |
6.6 |
7.7 |
9.1 |
Per Employee Productivity2 (Rs. crore) |
0.8 |
0.9 |
1.0 |
1.2 |
1.4 |
1.6 |
1.9 |
Accumulated loss as percentage to assets |
5.6 |
4.7 |
4.4 |
3.9 |
3.5 |
2.9 |
2.9 |
Salary as percentage to Assets |
2.0 |
2.2 |
2.3 |
2.6 |
2.0 |
2.1 |
1.9 |
Financial Return3 (per cent) |
9.4 |
10.6 |
9.6 |
8.9 |
8.2 |
7.7 |
7.7 |
Financial Cost4 (per cent) |
6.0 |
6.8 |
6.1 |
5.4 |
4.6 |
4.1 |
4.1 |
Financial margin5 (per cent) |
3.4 |
3.8 |
3.5 |
3.5 |
3.6 |
3.6 |
3.6 |
Risk, operational and other cost (per cent) |
2.1 |
2.6 |
2.6 |
2.2 |
2.3 |
2.8 |
2.9 |
Net margin6 (per cent) |
1.2 |
1.2 |
0.9 |
1.3 |
1.3 |
0.8 |
0.7 |
* : Before Tax
#: Reduction in number of RRBs was due to amalgamation, which began in September 2005.
Note :
1. Average level of business (in terms of total deposits and gross advances) per branch during the reporting year.
2. Average level of business (in terms of total deposits and gross advances) per employee of RRBs during the year.
3. Percentage of total income from both advances and investments against average working funds during the year.
4. Percentage of total interest expended for deposits, borrowings etc. against average working funds during the year.
5. Difference between the financial return and financial cost.
6. Difference between the financial margin and risk, operational and other costs, plus miscellaneous income.
7. Data for 2006-07 are provisional.
Source : NABARD. |
3.138 The ratio of gross and net NPAs declined sharply to 6.4 per cent at end-March 2007 (from 7.3 per cent as at end-March 2006) and 3.4 per cent (from 4.0 per cent), respectively, aided by improved recovery.
3.139 The productivity of RRBs, both in terms of per branch and per employee, increased significantly during 2006-07 (Table III.56).
3.140 During 2006-07, 96 RRBs extended new loans to the extent of Rs.32,067 crore as against Rs.25,427 crore during 2005-06. Of this, the share of priority sector was 82.2 per cent. As at end-March 2007, the outstanding advances of RRBs were Rs.48,494 crore and the share of priority sector was 81.9 per cent (Table III.57). The share of agricultural loans (Rs.27,964 crore in 2006-07) increased to 57.7 per cent at end-March 2007 from 54.2 per cent at end-March 2006.
11. Local Area Banks
3.141 Four local area banks (LABs) operating at end-March 2006 were Coastal Local Area Bank Ltd., Vijayawada; Capital Local Area Bank Ltd., Phagwara, Navsari, Krishna Bhima Samruddhi Local Area Bank Ltd., Mehboobnagar; and the Subhadra Local Area Bank Ltd., Kolhapur. During 2005-06, assets, deposits and gross advances of all LABs (except assets of Coastal Local Area Bank Ltd.) increased significantly (Table III.58).
Table III.57: Purpose-wise Outstanding |
Advances by RRBs |
(As at end-March) |
(Amount in Rs. crore) |
Purpose |
2005 |
2006 |
2007P |
1 |
2 |
3 |
4 |
I. |
Agriculture (i to iii) |
16,710 |
21,509 |
27,964 |
|
|
( 50.8) |
(54.2) |
(57.7) |
|
i. |
Short-term loans (crop loans) |
10,980 |
13,877 |
18,813 |
|
ii. |
Term loans (for agriculture |
|
|
|
|
|
and allied activities) |
5,730 |
7,632 |
9,151 |
|
iii. |
Indirect Advances |
– |
– |
|
II. |
Non-agriculture (iv to vii) |
16,161 |
18,204 |
20,530 |
|
|
(49.2) |
(45.8) |
(42.3) |
|
iv. |
Rural Artisans, etc. |
713 |
748 |
823 |
|
v. |
Other Industries |
580 |
757 |
835 |
|
vi. |
Retail Trade, etc. |
4,364 |
3,452 |
4,152 |
|
vii. |
Other purposes |
10,504 |
13,246 |
14,720 |
Total (I+II) |
32,871 |
39,712 |
48,494 |
Memo item: |
|
|
|
a) |
Priority Sector |
26,077 |
32,177 |
39,695 |
b) |
Non-priority Sector |
6,794 |
7,535 |
8,799 |
c) |
Share of Priority Sector |
79.3 |
81 |
81.9 |
P : Provisional.
– : Nil/Negligible.
Note : Figures in brackets are percentages to the total.
Source: NABARD. |
Table III.58: Profile of Local Area Banks |
(Amount in Rs. crore) |
Bank |
Assets |
Deposits |
Gross Advances |
|
2006 |
2007 |
2006 |
2007 |
2006 |
2007 |
1 |
2 |
3 |
4 |
5 |
6 |
7 |
Capital Local Area Bank Ltd. |
252 |
362 |
215 |
301 |
135 |
186 |
Coastal Local Area Bank Ltd. |
64 |
63 |
50 |
45 |
30 |
32 |
Krishna Bhima Samruddhi Local Area Bank Ltd. |
29 |
49 |
13 |
27 |
19 |
30 |
Subhadra Local Area Bank Ltd. |
19 |
23 |
12 |
15 |
13 |
14 |
Source : Based on off-site returns. |
3.142 During 2006-07, the income of the LABs increased sharply mainly on account of interest income. On the expenditure side, operating expenditure and interest expended registered significant increases during the year. However, the rise in income was more than the rise in expenditure, resulting in higher net profit and operating profit during 2006-07. The ratio of net profit to total assets was higher at 1.2 per cent as compared with 0.8 per cent in the previous year (Table III.59).
Table III.59: Financial Performance of Local Area Banks |
(As at end-March) |
|
Particulars |
2005-06 |
2006-07 |
Variation of Col.(3)
over Col. (2) |
|
|
|
|
Absolute |
Percentage |
|
1 |
2 |
3 |
4 |
5 |
A. |
Income (i+ii) |
30.0 |
46.3 |
16.3 |
54.3 |
|
i) |
Interest income |
25.5 |
37.4 |
11.9 |
46.8 |
|
ii) |
Other income |
4.5 |
8.9 |
4.4 |
96.3 |
B. |
Expenditure (i+ii+iii) |
27.2 |
40.5 |
13.3 |
48.7 |
|
i) |
Interest expended |
12.0 |
18.3 |
6.3 |
52.7 |
|
ii) |
Provisions and contingencies |
2.6 |
4.3 |
1.7 |
64.1 |
|
iii) |
Operating expenses |
12.6 |
17.8 |
5.2 |
41.7 |
|
|
of which : Wage Bill |
4.5 |
7.0 |
2.6 |
57.2 |
C. |
Profit |
|
|
|
|
|
i) |
Operating Profit/Loss |
5.4 |
10.2 |
4.8 |
88.2 |
|
ii) |
Net Profit/Loss |
2.8 |
5.9 |
3.1 |
111.1 |
D. |
Spread (Net Interest Income) |
13.5 |
19.1 |
5.6 |
41.5 |
E. |
Total Assets |
363.3 |
496.4 |
133.0 |
36.6 |
F. |
Financial Ratios@ |
|
|
|
|
|
i) |
Operating Profit |
1.5 |
2.1 |
|
|
|
ii) |
Net Profit |
0.8 |
1.2 |
|
|
|
iii) |
Income |
8.3 |
9.3 |
|
|
|
iv) |
Interest income |
7.0 |
7.5 |
|
|
|
v) |
Other Income |
1.3 |
1.8 |
|
|
|
vi) |
Expenditure |
7.5 |
8.2 |
|
|
|
vii) |
Interest expended |
3.3 |
3.7 |
|
|
|
viii) |
Operating expenses |
3.5 |
3.6 |
|
|
|
ix) |
Wage Bill |
1.2 |
1.4 |
|
|
|
x) |
Provisions and Contingencies |
0.7 |
0.9 |
|
|
|
xi) |
Spread (Net Interest Income) |
3.7 |
3.8 |
|
|
Note : @ Ratios to Total Assets.
Source : Based on Off-site returns. |
|
 IST,
IST,


