RbiSearchHeader

Press escape key to go back

Past Searches

Theme
Theme
Text Size
Text Size
S3

RbiAnnouncementWeb

RBI Announcements
RBI Announcements

Asset Publisher

108114001

Order Books, Inventories and Capacity Utilisation Survey on the Manufacturing sector for Q3:2023-24

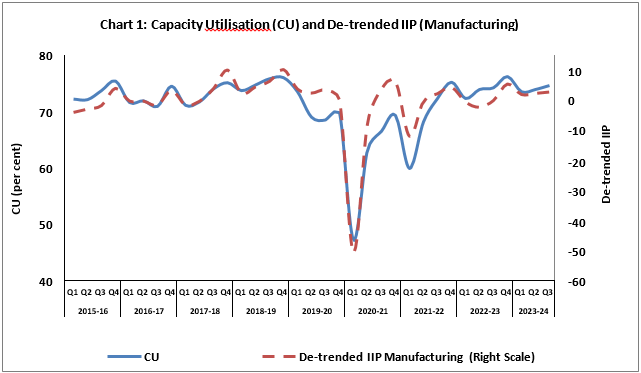
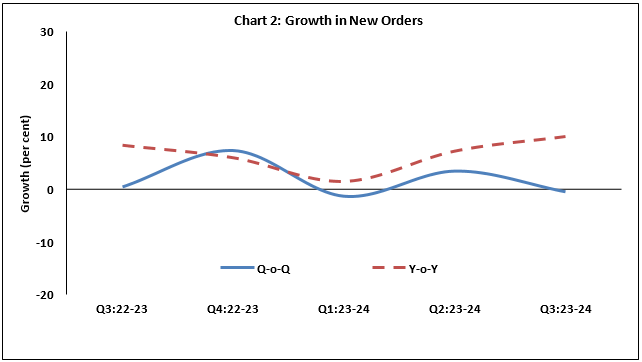
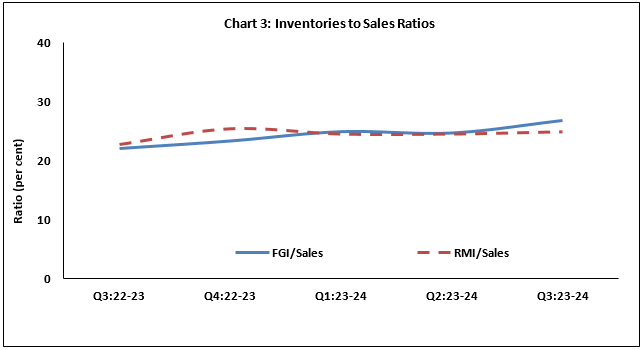
Today, the Reserve Bank released the results of its 64th round of the quarterly order books, inventories and capacity utilisation survey (OBICUS), which was conducted during Q4:2023-24 and covered 813 manufacturing companies. The survey1 provides a snapshot of demand conditions in India’s manufacturing sector during October-December 2023.

Highlights:

  • At the aggregate level, the capacity utilisation (CU) in the manufacturing sector increased to 74.7 per cent in Q3:2023-24 from 74.0 per cent in the previous quarter (Chart 1 and Table 1). The seasonally adjusted CU increased sequentially (q-o-q) by 10 basis points to 74.6 per cent.   
Chart 1
  • The value of new orders received by the responding companies during Q3:2023-24 remained close to that in the previous quarter. On an annual (y-o-y) basis, however, the value of new orders increased by nearly 10 per cent (Chart 2 and Table 2A).
Chart 2
  • The finished goods inventory (FGI) to sales ratio increased marginally in Q3:2023-24 from its level in the previous quarter while the raw material inventory2 (RMI) to sales ratio remained stable (Chart 3 and Table 3A).
Chart 3

Note-Please see the excel file for time series data.

ANNEX 1: Data Tables

Table 1: IIP*-Manufacturing and Capacity Utilisation

Quarter

Number of responding
companies

Capacity Utilisation

IIP-Manufacturing (Quarterly Average)

De-trended Quarterly IIP-Manufacturing

Q3:2022-23

727

74.3

137.0

0.1

Q4:2022-23

705

76.3

143.5

5.5

Q1:2023-24

665

73.6

141.2

2.1

Q2:2023-24

752

74.0

142.7

2.4

Q3:2023-24

761

74.7

144.2

2.9

*: Index of Industrial Production (Base: 2011-12)

Table 2A: Order Books Growth

Quarter

Number of companies

Q-o-Q Growth # (per cent) **

Y-o-Y Growth # (per cent)

Backlog Orders

New Order Book

Pending Orders

Backlog Orders

New Order Book

Pending Orders

Q3:2022-23

277

1.8

0.5

3.9

14.7

8.4

18.4

Q4:2022-23

261

3.9

7.4

2.9

15.8

6.0

15.3

Q1:2023-24

244

-5.2

-1.3

-4.5

22.7

1.5

9.3

Q2:2023-24

245

3.1

3.5

5.6

24.1

7.3

15.7

Q3:2023-24

233

4.7

-0.4

4.1

13.7

10.1

19.0

#: Growth rates are calculated using three rounds common set of companies, namely, companies responded in the current quarter, one quarter ago and the same quarter a year ago.
**: Not seasonally adjusted.

Table 2B: Average Size of Order Books

Quarter

Number of companies

Average Amount (` crore)


Backlog Orders


New Order Book


Pending Orders

Q3:2022-23

277

205.0

212.2

213.1

Q4:2022-23

261

215.6

225.4

221.9

Q1:2023-24

244

212.0

236.2

201.2

Q2:2023-24

245

227.7

248.6

240.4

Q3:2023-24

233

228.6

252.1

238.0


Table 3A: Inventory to Sales Ratios

Quarter

Number of Companies

Ratio (per cent) ##

Total Inventory / Sales

Finished Goods Inventory / Sales

Raw Material Inventory / Sales

Q3:2022-23

675

60.6

21.9

22.6

Q4:2022-23

658

64.1

23.2

25.3

Q1:2023-24

622

63.0

24.8

24.4

Q2:2023-24

688

65.9

24.6

24.4

Q3:2023-24

714

67.7

26.8

24.8

##: Weighted average of industry level ratios using GVA as weights


Table 3B: Average Sales and Inventories

Quarter

Number of Companies

Average Amount (` crore)

Sales

Total Inventory

Finished Goods Inventory

Work in progress Inventory

Raw Material Inventory

Q3:2022-23

675

1106.7

519.9

195.5

67.1

202.4

Q4:2022-23

658

1172.2

546.6

225.4

62.7

206.2

Q1:2023-24

622

1163.1

534.3

226.9

62.8

195.7

Q2:2023-24

688

1091.7

608.1

226.7

120.4

203.8

Q3:2023-24

714

1069.6

581.4

226.0

110.3

187.5


Note: The computations of order book growths and inventory to sales ratios are based on methodology given in the RBI press release dated October 8, 2021 (link: https://website.rbi.org.in/en/web/rbi/-/publications/obicus-survey-on-the-manufacturing-sector-for-q1-2021-22-20650) and not on the basis of averages given in the above tables. Please also see footnote 2 on direct estimation of RMI since 53rd round of the survey.


[1] The survey responses are voluntary, and the results reflect the views of the respondents, which are not necessarily shared by the Reserve Bank. Results of the previous survey round were released on the Bank’s website on February 08, 2024.

[2] So far, the survey estimates of raw materials inventory (including stores and spares, loose tools, stock-in- trade and other inventories) were arrived at by netting out finished goods inventory and work-in-progress inventory from total inventory. Since the 53rd round of the survey (i.e., Q4:2020−21), however, direct data on raw material inventory (excluding stores and spares, loose tools, stock-in-trade and other inventories) are also being collected from survey respondents, in parallel. Estimates of raw materials inventory based on the additional reporting are presented here.


RbiTtsCommonUtility

PLAYING
LISTEN

Related Assets

RBI-Install-RBI-Content-Global

RbiSocialMediaUtility

Install the RBI mobile application and get quick access to the latest news!

Scan Your QR code to Install our app

RbiWasItHelpfulUtility

Was this page helpful?