 IST,
IST,
Productivity, Efficiency and Competitiveness of the Indian Manufacturing Sector
Issued for Discussion DRG Studies Series Development Research Group (DRG) has been constituted in the Reserve Bank of India in its Department of Economic Analysis and Policy. Its objective is to undertake quick and effective policy-oriented research backed by strong analytical and empirical basis, on subjects of current interest. The DRG studies are the outcome of collaborative efforts between experts from outside the Reserve Bank and the pool of research talent within the Bank, These studies are released for wider circulation with a view to generating constructive discussion among the professional economists and policy makers. Responsibility for the views expressed and for the accuracy of statements contained in the contributions rests with the author(s). There is no objection to the material published herein being reproduced, provided an acknowledgement for the source is made. Director Requests relating to DRG Studies may be addressed to It is a pleasure to acknowledge the support we received from the various quarters during the course of this study. We would like to extend our sincere thanks to the Reserve Bank of India for enabling the interaction between academicians and the policy makers through the Development Research Group (DRG). We are particularly thankful to Dr. Narendra Jadhav, the then Principal Adviser and Chief Economist, Department of Economic and Policy Research (DEPR) whose academic support was crucial at the initial stages of this study. We also acknowledge our thanks to the participants (for the comments and suggestions) at the seminar during which this study was proposed. We record our appreciation to each and everyone who was associated with the DRG, DEPR, Reserve Bank of India, since the inception of this study and has been instrumental in providing the logistic support necessary for the completion of this study. We would particularly like to thank Dr. Nishita Raje, Dr. Ramesh Golait, Dr. Snehal Herwadkar and Shri Gopal Prasad. We have used Tim Coelli’s softwares, DEAP (2.1 version) and SFPF (Front 4.1 version) and we are grateful to him for enabling researchers, including us, to use his software. We also express our gratitude to the anonymous referee whose valuable suggestions and comments have helped us to sharpen the focus of the study. Not only during the course of this study but otherwise as well, Pushpa Trivedi was fortunate enough to discuss the various facets of productivity with Prof. K.L. Krishna, Prof. Subhash Ray, Prof. Biswanath Goldar, Prof. Arup Mitra, Dr. Deb Kusum Das and Dr. Abhiman Das, at various seminars and workshops. She expresses her gratitude to each one of them for sharing their expertise with her. We will be failing in our duties if we do not thank Amlendu Dubey and Jaison for their help, as and when needed. During the course of this study, Pushpa Trivedi’s productivity registered a sharp decline, due to her ill-health. She, therefore, thanks all those associated with the study for being patient with her and enabling her to complete this study. She would like to record her gratitude to Prof. Devang Khakhar (Director) and Prof. Rangan Bannerjee (Dean, Research and Development) of the Indian Institute of Technology Bombay, for ensuring a conducive environment for promoting research. Needless to mention, the responsibility for errors, if any, is entirely our own. Pushpa Trivedi
India’s development strategy placed a heavy emphasis on the creation of a well-diversified industrial base to realise the dream of industry-led development. In order to maximise growth from limited resources, the importance of increasing productivity, efficiency and competitiveness needs no justification. It may not be out of place that though the concepts of productivity, efficiency and competitiveness are indicators of performance, these need not necessarily move in tandem with each other. However, improving these indicators should be conceived merely a means to an end (i.e., social welfare) and certainly not as an end in itself. This study focuses on the performance of manufacturing sector by taking a disaggregate view of it. It examines the regional dimensions1 (for 18 states of India), component industries2 (6 industries within manufacturing sector), organised versus unorganised segments of the manufacturing sector, etc. The period of study is 1980-81 to 2003-04 for the disaggregated analysis. However, we have extended the study to include the period up to 2004-05 for the ‘Selected Public Ltd. Manufacturing Companies’ and up to 2007-08 in the case of overall organised manufacturing sector. The study uses both parametric and non-parametric methods to estimate productivity and efficiency of India’s manufacturing sector. Before we report the major findings of the study, we deem it necessary to report a few stylised facts pertaining to India’s manufacturing sector. These are as follows. First, the average share of manufacturing sector in real GDP has marginally increased from about 13 per cent during 1970- 75 to about 15.6 per cent in 2007-08, i.e., approximately by about 2.6 percentage points over a period of almost four decades. Despite the emphasis on manufacturing sector in India’s planning process, the contribution of this sector, at best, is modest. It needs to increase so as to absorb more workers and to enable people to improve their standard of living. Second, the employment and output generation within the manufacturing sector exhibits a major imbalance. According to the latest available data, the unorganised sector accounts for about 80% of employment and only about 33 % of income of the manufacturing sector. Third, as regards the position of manufacturing sector of the various states, Maharashtra, Tamil Nadu and Gujarat are the states which consistently rank as the first three topmost states in terms of both output and employment generation in the organised manufacturing sector. Deterioration of Bihar* and West Bengal, and ascent of Haryana, Karnataka, Punjab and Rajasthan is noticeable in these regards. Fourth, over the period of the study, ‘Metal’ and ‘Machinery & Transport Equipment’ industries accounted (each of them) for almost one-fifth of gross value added (GVA) of the organised manufacturing sector. These industries are followed by the chemical industry which accounted for about 13 percent of GVA of the organised manufacturing sector. However, in terms of job provision, these are not the topmost industries. Textiles and Food (including beverages & tobacco) industries together account for about 41 per cent of jobs in the organised manufacturing sector. Fifth, during 2000-01 to 2008-09, the growth rate of exports (in US $ terms) of Metal and Engineering goods has been highest at about 24 per cent per annum (pcpa) as against the overall growth of exports of about 17 pcpa and that of manufactured products of about 15 pcpa. Growth rates of exports of Textiles and Leather (LEATH) industry have been quite low ranging between 6 and 7 pcpa. Lastly, it is not too much to expect that, with the growth of manufacturing sector, workers would benefit in terms of rising per capita real wages. However, the worrisome feature of the organised manufacturing sector in India is stagnancy of per capita real wages of workers. The plight of workers in unorganised sector is much worse, as the wage differentials between organised and unorganised manufacturing sectors are rather sharp. The major findings of this study are as follows.
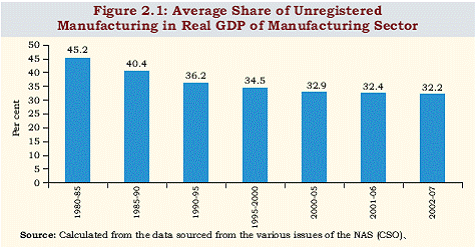
1 1 We have selected 18 states, which are listed as 15 states. These are: Andhra Pradesh, Bihar*, Delhi, Gujarat, Haryana, Karnataka, Kerala, and Madhya Pradesh*, Maharashtra, Orissa, Punjab, Rajasthan, Tamil Nadu, Uttar Pradesh* and West Bengal. The three states suffixed with ‘*’ indicate that these were bifurcated in the year 2000. In this study, Bihar* includes Bihar and Jharkhand; Madhya Pradesh* includes Madhya Pradesh and Chhattisgarh; and Uttar Pradesh* includes Uttar Pradesh and Uttarakhand. 2 The industries selected for detailed investigation are: Food, Beverages & Tobacco, Chemical & Chemical Products, Leather & Leather Products, Metal & Metal Products, Machinery & Transport Equipment and Textiles & Textile Products. PRODUCTIVITY, EFFICIENCY AND COMPETITIVENESS OF THE INDIAN MANUFACTURING SECTOR Pushpa Trivedi#, L. Lakshmanan, Rajeev Jain, Yogesh K Gupta As a reaction to the colonial past, India’s development strategy focused on self-reliance. In pursuit of the same, it placed a heavy emphasis on the creation of a well-diversified industrial1 base to realise the dream of industry-led development. Though this strategy assigned the prime responsibility of developing heavy industries to the public sector, private sector was also allowed to play a supplemental role. Almost until the beginning of the eighties, a myriad of measures to control the private sector, such as, licensing requirement for installation of capacities, quantitative and tariff restrictions on imported inputs, regulation of monopolies and trade practices, foreign exchange regulation, nationalisation of commercial banks, price controls, etc., constituted an integral part of India’s industrial policy. The socialistic fervor in the minds of policy makers got reflected in the policy measure, such as, reservation of labour-intensive manufacturing products for the small scale industries (SSIs), preferential treatment to the SSIs, stringent labour laws against firing of labour in large firms, etc. The industrial policy was primarily designed to protect the ‘infant’ industries from external competition. Unfortunately, it inhibited internal competition as well. By the end of seventies, Indian manufacturing suffered from high costs of production, sub-standard quality of products and lack of competitiveness of its exports. It is no surprise that the regulatory framework of the pre-1980s, inter alia, has been held responsible for low growth rate of output and productivity of India’s manufacturing sector (Ahluwalia, 1991). The first bout of industrial policy reforms that were initiated in the eighties attempted to lift the economy from industrial stagnation through measures, such as, removal of hurdles on capacity expansion, enabling availability of imported inputs, liberalization of price controls, etc. The primary intent of these reforms was to unleash the growth potential of India’s industrial sector. The second bout of reform process was initiated in 1990-91 in the wake of macroeconomic crisis. Economic and institutional reforms are being fine-tuned since then, depending on the unfolding of situations both at the external and domestic fronts. It may also be worth noting that the reforms of the eighties were centered primarily on industrial and fiscal sectors, whereas, the reforms initiated in the early nineties were more in the nature of comprehensive macro-economic reforms. Stabilisation and structural adjustment process constituted the core of reforms in the nineties and these were deemed to be pre-requisites for the pursuit of growth and viable balance of payment. In brief, the reforms in the nineties differed in their characteristics from those of the eighties. The reforms in the eighties have been branded as ‘pro-business’, whereas, the latter as ‘pro-market’ (Rodrik and Subramanian, 2005 and Kohli, 2006). It has been argued by Ahluwalia (1991) that the reforms of the eighties resulted in an upward shift in growth rate and productivity of the Indian economy and in particular that of industrial/manufacturing sector. The comprehensive reforms of the nineties gained wide publicity as these pulled the economy from a crisis situation and succeeded in alleviating foreign exchange constraint and controlling inflation. As substantial liberalisation in terms of tariff reductions and removal of quantity restrictions on imported inputs (needed for growth of manufacturing sector) took place during the nineties, it was expected that these reforms would also enable the economy to follow growth and productivity paths higher than those witnessed during the eighties. However, as noted by Rodrik and Subramanian (2005), no such structural break in either growth or productivity is evident after the initiation of reform process of the nineties. Perhaps, the reforms of nineties targeted primarily the external and financial sectors, which have impacted the real sector indirectly. The emphasis that needs to be placed on productivity has been well articulated in the literature (Krugman, 1994 and Young, 1995). A higher growth path on account of higher productivity is considered to be a preferable alternative as compared to that due to increased application of inputs. The latter is deemed to be unsustainable due to supply constraints and also due to the phenomenon of diminishing returns. However, this can be a contentious issue, if it pertains to application of labour input, especially so in the context of a labour abundant economy like India. If increased productivity is attained by downsizing employment, it may not bode well for the social fabric and it ought to be a cause of concern to the policy makers. As the basic objective underlying the argument for increasing productivity is to increase social welfare, a situation of rising productivity coupled with shrinking employment may be neither socially desirable nor politically sustainable. A higher growth path, enabled by productivity growth and combined with ‘employment generation’ ought to be considered as an ideal trajectory from the point of view of sustainable growth of an economy. The link between productivity and social welfare (poverty alleviation) can best operate through employment generation. The importance of productivity in poverty reduction via employment generation has been duly emphasised in the World Employment Report 2004-05 (International Labour Office, 2005), by an apt choice of theme for the report, viz., ‘Employment, Productivity and Poverty Reduction’. In other words, increase in productivity needs to be conceived merely as a means to an end (i.e., social welfare) and certainly not as an end in itself. Though the concepts of productivity, efficiency and competitiveness are indicators of performance, these need not necessarily move in tandem with each other. These terms have rather different conceptual underpinnings and hence, the policy makers need to focus on movement of each of these in accordance with the socio-economic objectives. As regards the two concepts of productivity, viz., labour productivity and total factor productivity (TFP), these are pertinent for policy makers, since the former has a direct link to standard of living and the latter indicates the economical use of resources in the process of production. ‘Productivity’ per se is a descriptive measure of performance and it can be estimated2 independently for a decision making unit, whereas, measurement of ‘efficiency’ entails a comparison with a peer group and is a normative measure of performance (Ray, 2004). The concept of ‘competitiveness’ has many more dimensions to it, as compared to the concepts of efficiency and productivity. Competitiveness implies increasing share of market in relation to other decision making units3. The Global Competitiveness Report (GCR) 2009-10 published by the World Economic Forum (2009) provides the ranks for Global Competitiveness Index (GCI) and scores for various countries along with their component indices. These indices try to capture both the micro and macro determinants of global competitiveness. The pillars of GCI (as outlined in GCR, 2009) are classified into the basic requirements (institutions, infrastructure, macroeconomic stability, and, health & primary education), efficiency enhancers (higher education and training, goods and market efficiency, labour market efficiency, financial market sophistication, technological readiness, market size) and innovation and sophistication factors (business sophistication and innovation). Hence, the policy makers have to ensure that these basic requirements are provided within the macroeconomic policy frame. The State also has an additional task of providing policy environment to firms that is conducive for enhancing their efficiency and attaining technological and managerial sophistication. In brief, the gains in terms of productivity, efficiency and competitiveness, have to percolate across sectors, regions and income groups so as to enhance the social welfare. The cross-country comparison shows that India is far lower in terms of GCI rank (GCIR) and GCI score (GCIS) as compared with the other Emerging Market Economies (EMEs). India’s GCIR is 49 among 133 countries and the GCIS is 4.3 in the 7 point scale.4 In terms of the efficiency enhancers sub-index, which includes pillars critical for countries in the efficiency-driven stage, India stands at 33rd place among 134 countries. Though the study highlights some aspects of competitiveness, it primarily focuses on productivity and efficiency of ‘manufacturing sector’ for the following reasons. First, manufacturing/industrial sector has received much attention of the policy makers in India in terms of financial allocations in planning process. Second, during the process of transition (i.e., when growth of an economy is being driven by manufacturing and tertiary sectors rather than by the primary sector), manufacturing sector is known to generate employment for both unskilled and skilled labour and the employment potential of manufacturing sector is higher as compared to that of the tertiary sector. Third, the growth of manufacturing sector is also necessary for the overall growth of the economy, as it can supply inputs and provide market to other sectors. Lastly, we also view that the solution to the agrarian crisis will also be found in the growth of output and employment of manufacturing sector. The motivation for this study was derived from the fact that the Reserve Bank of India has displayed a keen interest in the arena of productivity trends in the Indian economy (Reddy, 2005). Unlike many other countries, India has not witnessed a stylised sectoral growth process during her developmental process. India’s service sector led growth in the recent years has been viewed with some apprehension in terms of fostering inequalities across regions and sections of population. Concerns have also been raised about the widening regional and sectoral dispersion of growth (Ahluwalia, 2000) and jobless growth in the context of economic reform process that gathered momentum in the early nineties. The objectives of this study are as follows: (i) To estimate productivity and efficiency both at industry5 and state6 levels for India’s manufacturing sector; and, (ii) To examine the path of efficiency and productivity in the context of economic reforms undertaken by the Indian manufacturing sector; (iii) To provide a comparative view of the performance in organised and unorganised sectors of India’s manufacturing sector and, (iv) To identify the determinants of growth and productivity of the Indian manufacturing sector. The remainder of this study is organised as follows. Section 2 provides some stylised facts about India’s manufacturing sector. Section 3 provides a synoptic review of the literature pertaining to efficiency and productivity of India’s manufacturing sector. Section 4 presents the details of the coverage of the study, methodology and data used in the study. Section 5 presents the estimates of productivity growth and efficiency obtained by the various methodologies for the different datasets. Section 6 provides the overall view of the results obtained in the study in a holistic perspective and policy implications emanating from the previous sections of the study. The share of manufacturing sector in India’s real GDP has risen over the years. However, this increase has not matched the expectations for two main reasons. First, the expectations from manufacturing sector were high due to the emphasis on heavy industries led development in the planning process in India; and, second, the countries with similar levels of development on the eve of planning in India, especially the East-Asian Economies including China, have been able to make their presence felt in the global market for manufacturing products to a far greater extent than India. In Box 2.1, we provide the description of concepts and definitions used in the context of disaggregated data in India’s manufacturing sector. Box 2.1: Classification of Manufacturing Sector in India The manufacturing sector covers all manufacturing, processing and repair & maintenance services units irrespective of their employment size, investment and location. The first classification of the manufacturing sector is into two broad sub-sectors: (i) registered or organised; and, (ii) unregistered or unorganised. The data on manufacturing in the organised sector is collected through Annual Survey of Industries (ASI), annually, whereas, the data on unorganised sector is collected by National Sample Survey Organisation (NSSO). Registered (Organised) manufacturing sector : The registered manufacturing sector includes all factories covered under sections 2m (i) and 2m (ii) of the Indian Factories Act (IFA), 1948 which refers to the factories employing 10 or more workers and using power or those employing 20 or more workers but not using power on any day of the preceding 12 months ( for the entire country except the states of Arunachal Pradesh, Mizoram, and Sikkim and Union Territory of Lakshadweep). It also includes Bidi and Cigar establishments registered under Bidi and Cigar Workers (Condition of Employment) Act, 1966 with the same employment and use of power criteria as mentioned above. All electricity undertakings engaged in generation, transmission and distribution of electricity registered with the Central Electricity Authority (CEA) were covered under ASI irrespective of their employment size, until 1997-98. Since 1998-99, the electricity units registered with the CEA and the departmental units such as railway workshops, RTC workshops, GOVT. MINTS, sanitary, water supply, gas storage, etc. are not covered under ASI. Unregistered (Unorganised) manufacturing sector: The unregistered manufacturing sub-sector, a complement set to the registered manufacturing sub-sector, covers all the residual units which are not covered under the registered manufacturing sector. Thus, the unregistered manufacturing sector covers all the manufacturing, processing, repair & maintenance services units employing less than 10 workers and using power or less than 20 workers and not using power. The data on unorganised sector is collected through periodic surveys by the NSSO. Further classification of the unorganised sector is as indicated below. 1. Own Account Manufacturing Enterprise (OAME) : These enterprises are engaged in manufacturing and/or repairing activities and are run without any hired worker employed on a regular basis. 2. Establishment : An establishment employs at least one hired worker on a fairly regular basis. Paid or unpaid apprentices, paid household member/servant/ resident worker in an enterprise are considered hired workers. Establishments are further categorised into two types: non-directory and directory manufacturing establishments. 2.1 Non-directory Manufacturing Establishment (NDME) : It is an establishment engaged in manufacturing and/or repairing activities and employs less than six workers (household and hired workers taken together). 2.2 Directory Manufacturing Establishment (DME): A directory establishment engaged in manufacturing and/or repairing activities employs six or more workers (household and hired workers taken together). Source : http://mospi.gov.in/mospi_asi.htm (for ASI coverage) 2.1 Contribution of Manufacturing Sector to Real GDP In Table 2.1, we provide a synoptic view of the importance of the manufacturing sector and its two components, viz., registered and unregistered manufacturing in India’s real GDP. It can be seen from Table 2.1 that the average share of manufacturing sector in real GDP increased from about 13 per cent during 1970-75 to about 15.1 per cent during 2002-07, i.e., approximately by just about 2 percentage points over a period of more than three decades. Even in the year 2009-10, the share of manufacturing sector in India’s real GDP is just about 16.1 percent. During 1970-75, India’s real GDP of manufacturing sector was more or less equally distributed between its registered and unregistered segments. Over the years, the growth of real income in the registered manufacturing has been higher than that of unregistered manufacturing sector, resulting in the average contribution of the unregistered sector shrinking to almost half of that of the registered sector during 2002-07. The situation has remained more or less unchanged even during the post 2007 period. Kochhar et al (2006) demonstrate that given the per capita GDP and size of India, the share of manufacturing sector in GDP was in conformity with the stylised growth pattern of other countries. According to them, manufacturing sector in India underperformed since 1981 and this perception about its underperformance is also due to its comparison with China7. China was a significant positive outlier (i.e., China’s manufacturing sector contributed more to its national income as compared with the historical evidence on countries of similar levels of development) in 1981. To put it differently, India had approximately the normal share of output and employment in manufacturing in 1981, if compared with countries at a similar level of development and size. Over the next two decades, (when reforms were implemented, so as to remove the constraints on manufacturing sector), it failed to keep pace with the growth of manufacturing sector in other countries with similar levels of development. This is not to deny the fact that India has done reasonably well as compared to its own past performance. The composition of India’s manufacturing sector is also crucial from the point of view of intra-sectoral equity. In Figure 2.1, we provide the proportion of real GDP originating in unregistered manufacturing in the total manufacturing sector. The unorganised manufacturing sector accounts for about 80 percent of the employment generated in manufacturing sector. However, its contribution to the income generation or to real GDP of manufacturing (as seen in Figure 2.1) is much less in proportion to its employment generation. Furthermore, the relative income contribution of the unregistered sector vis-à-vis registered sector in manufacturing has been consistently declining over the years. In the first half of the eighties, this share was approximately 45 per cent and it has fallen to about 32 per cent during 2002-07. Even in 2008-09, the share of unorganised sector in real GDP of manufacturing sector was about 33.2 percent. In brief, the income originating in unregistered segment of India’s manufacturing sector is much lower than the proportion of workforce it supports. This has implications for the differences in labour productivity in registered and unregistered segments of India’s manufacturing sector. 2.2 Contribution of Manufacturing Sector to Employment A vast body of literature has accumulated over the problem of lack of tandem between income and employment generation across various sectors in India. Though the composition of GDP in India has undergone substantial changes over the years, the dependence of workforce on manufacturing sector has hardly increased. Historically, during the transition process, manufacturing sector has been the main absorber of mass unskilled labour that gets released from agricultural sector. Unlike the East Asian economies, India failed to draw employment from agriculture into manufacturing in any significant magnitude (Kochhar et al, 2006).
In Table 2.2, we provide the data on employment generation in the industrial sector of India which includes manufacturing sector. In the year 2000, agriculture in India accounted for almost 60 per cent of total employment which is the highest in comparison to the countries listed in the Table. It is even higher than the respective figure for the lower middle income countries. Industry accounted for just about 18 per cent of total employment, which means the contribution of manufacturing to employment generation is even lower. Though, in the case of India, services sector has been able to absorb much more labour than the manufacturing sector, labour absorption by this sector is lowest as compared to other countries and it is almost similar to that witnessed by the low income countries. In brief, the manufacturing sector in India has failed to generate adequate employment in general and in organised manufacturing sector in particular. This implies inequalities in inter-sectoral and intra-sectoral distribution of purchasing power.
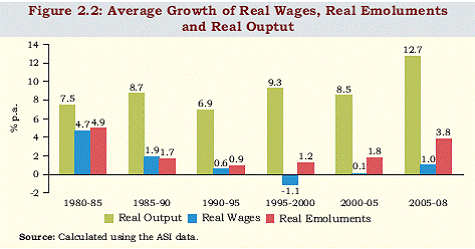
In Table 2.3, we present a synoptic view of the employment generation in India’s unorganised sector vis-à-vis that in the organised sector. It can be seen from Table 2.3 that the contribution of unorganised sector in employment generation in manufacturing sector hovers around 80 per cent or so. In other words, the share of organised sector in total employment generation of manufacturing sector is just about one-fifth. This, when put together with the data reported in Table 2.1, indicates that only about 32 per cent of income of the total manufacturing sector was generated in the unorganised sector, which employs almost 80 per cent of labour of the manufacturing sector. In other words, we see not only the disproportion between income and employment generation across sectors, but also within the manufacturing sector, i.e., between its organised and unorganised segments. Moreover, we also observe from Table 2.3 that economically backward states have much higher proportion of employment in unorganised manufacturing in comparison to that in the organised manufacturing. 2.3 Growth of India’s Organised Manufacturing Sector: A Profile In this sub-section, we highlight various dimensions of growth of India’s organised manufacturing sector. In Figure 2.2, we plot the average growth rates of real output, real wages and real emoluments8 in India’s organised manufacturing sector. It can be seen from the Figure 2.2 that average growth of output of the organised manufacturing sector during the various quinquennia spanning from 1980-85 to 2005-08 ranged between 6.9 and 12.7 pcpa. The growth performance of the manufacturing sector had been rather impressive since the eighties itself. The pro-business policies of the eighties, according to Rodrik and Subramanian (2004), were responsible for a markedly improved growth performance of the Indian economy during the eighties as compared to the earlier three decades. There does not seem to be a statistically significant ‘improvement’ in the growth performance of the Indian manufacturing sector in the early nineties, i.e., after the initiation of the next bout of economic reforms. Nonetheless, the growth momentum of the eighties has been ‘maintained’ during the pro-market reforms of the nineties. It can be seen from Figure 2.2 that the growth performance of manufacturing sector has indeed been impressive in the last three years. Hashim, et al (2009) argue that the major liberalization undertaken during 1990s led to structural transformation of the Indian economy. Therefore, the enormity of change associated with transition from old inefficient structure to a new globally more efficient structure was characterised initially by a slowdown in GDP growth in sectors undergoing such transition.
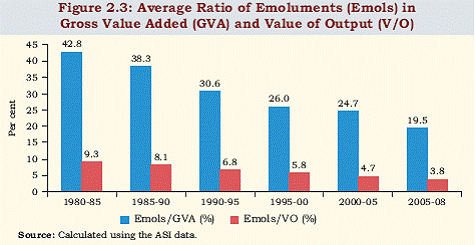
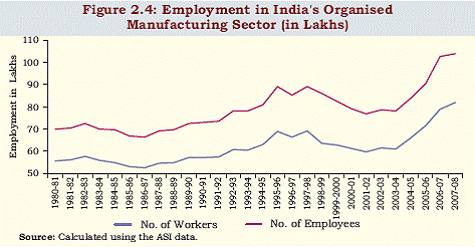
Figure 2.3 indicates that the ratio of emoluments to both gross value added and value of output has registered a consistent decline since the eighties. In the first half of the eighties, the average ratio of emoluments to gross value added (value of output) was about 43 (9.3) per cent which declined to about 25 (4.7) per cent during 2000-05 period. This has further gone down to 19.5 (3.8) percent during 2005-08 period, despite an impressive growth performance of the economy. In other words, the ratio of wages and emoluments in income generated in organised manufacturing has shrunk over the years. Figure 2.4 highlights the employment situation in the organised manufacturing sector of India. As can be seen from Figure 2.4, almost up to 1986-87, employment in organised sector witnessed a declining trend. After that almost for the next ten years, employment trend was positive. Thereafter, again we see a period of not only jobless but job loss growth. This situation has been arrested in the earlier years of the next decade and the latter half of the next decade presents an impressive performance on the employment front.
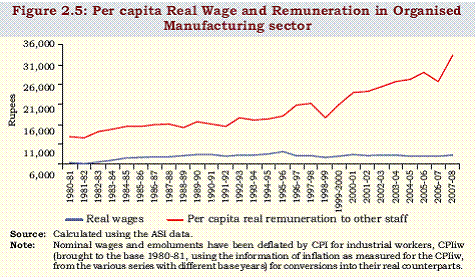
One of the areas of concern regarding the reform process in Indian manufacturing sector has been the deceleration in the rate of growth of real emoluments (see Figure 2.2). Growth of real emoluments has been shrinking over the years and it was in fact negative during the latter half of the nineties. However, we see a revival in the same since the midnineties and a ‘U’ shaped pattern in the growth of real emoluments can be seen in Figure 2.2. Emoluments consist of wages to the shop-floor workers (skilled and unskilled) and compensation to the ‘other supporting staff’, including the managerial staff. However, the worrisome feature of Indian manufacturing sector is stagnancy of per capita real wages. In Figure 2.5, we plot the per capita real wages and per capita real remuneration to staff other than workers. It can be seen that the growth rate of compensation to supporting staff has increased since the late nineties, in relation to the workers directly engaged in production process. This can have an adverse effect on the motivation for the shop-floor workers. It also explains as to why most of the engineering graduates do not prefer to pursue their engineering skills on the shop-floor and instead prefer to take up managerial positions. It is necessary for manufacturing sector to retain technologists who are engaged in production process and for this the real per capita incomes to technologists have to move in tandem with those for the other managerial staff. Productivity increases depend both on technology as well as managerial improvements and we can ill-afford to neglect either of these.
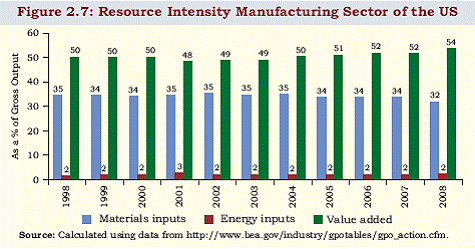
Another concern pertaining to India’s manufacturing sector has environmental point of view, i.e., the growth of manufacturing sector has been material resource intensive. Figure 2.6 highlights this phenomenon. Total value added constitutes barely 20 per cent of the value of output in India’s organised manufacturing sector. The ratio of material inputs to total value of output has ranged between 58 and 65 per cent and the respective range for the fuel inputs is between 6 and 7 per cent. If we compare it with the resource intensity in the United States (see Figure 2.7), the proportion of value added in gross output is about half as compared to about one fifth in India. Material inputs account for about two-thirds of value of output in India in comparison to just about one-third in the United States. Fuel inputs account for about 5 to 7 percent of value of output in India as compared to merely 2 percent in the United States. For Germany, the average ratio of value added to gross output was about one-third during 1998-2007, i.e., for the last 10 years for which the data are available9. It is true that the composition of the manufacturing sector of the US or Germany and that of India are quite different. However, if the Indian manufacturing sector is not able to add as much value to the intermediate inputs, as is done by the other countries, it will need restructuring in order to be globally competitive. In other words, there is scope for improving efficiency and productivity in Indian manufacturing sector, if we have to benchmark India with the globally competitive advanced nations. Even in China, the average ratio of value added to gross output of the industrial sector during 1998-2007 was about 29 per cent (China Statistical Yearbook, 2009), In other words, benchmarking against the most competitive economies is mandated, if we need to compete with the manufacturing giants in this era of globalization.
In this study, we have selected six major industry groups (listed in Table 2.4) across the eighteen states of India (these include the three states which were created in the year 2000). In Table 2.4 and 2.5, we provide the relative positions of the various industries and states in India’s organised manufacturing sector. It may be mentioned here at the outset that we have been able to do the aggregate country level analysis in this study for the period 1980-81 to 2007-08. However, for the state by industry analysis of organised manufacturing sector, the time-span of the study is 1980-81 to 2003-04 and we have used the ASI 2-3 digit level data. We also procured the unit level data from ASI for the time-span 1993-94 to 2003-04 and estimated productivity for this dataset as well10. For the company level data obtained from the RBI, we have been able to do industry level analysis from 1993-94 up to 2004-05. It can be seen from Table 2.4 that ‘metal’ and ‘machinery & transport equipment’ industries are the two major industries and each one of these accounted for about one-fifth of GVA in the organised manufacturing sector. These industries are followed by the chemical industry which accounts for about 13 percent of GVA of the total organised manufacturing sector. However, in terms of job provision, these are not the topmost industries. Textiles and Food industries together account for about 38 per cent of jobs in the organised manufacturing sector. Leather industry is the least important industry from the chosen industries. We have included this industry in our analysis despite its low share in value added in organised manufacturing in India, because its contribution to export earnings has been higher than its importance in the production contribution in the organised manufacturing sector. Table 2.5 (and Tables 2.5a to 2.5f) highlights the importance of various selected manufacturing industries in the selected states. The following observations can be made regarding the ranking of the organised manufacturing sector of the various states of India (also refer to Annexure 2.1 and Annexure 2.2).
In other words, Maharashtra, Tamil Nadu, Gujarat and UP* are the states which consistently appear in the first five topmost states in terms of both output and employment generation in the organised manufacturing sector. The deterioration of Bihar* and West Bengal and the ascent of Haryana are noticeable. 2.4: Contribution of Manufacturing Sector to India’s Exports In Table 2.6, we provide the contribution of manufacturing sector to exports of the Indian economy. It can be seen from Table 2.6 that India’s exports have multiplied almost 4.2 times during 2008-09 over 2000-01. Manufactured exports as well as exports of selected industries have multiplied by 3.6 times during this time-span. Share of exports of manufacturing sector as also leather, chemical and textiles industries11 in India’s exports have declined especially during the post-2003-04 period (which is mainly due to rise in exports of petroleum products) despite their impressive compound growth of about 15.3 pcpa in US $ terms. The exports of selected industries account for about half of India’s export earnings. The major change which we see as regards composition of exports of selected industries is in terms of decline in contribution of textiles and leather (traditional) industries and a rise in share of engineering goods. The compound rates of growth of exports (EXg) of traditional manufactured goods, such as leather and textiles were quite low (about 7 pcpa) in comparison to the engineering goods (24 pcpa) and chemical industry (16 pcpa).
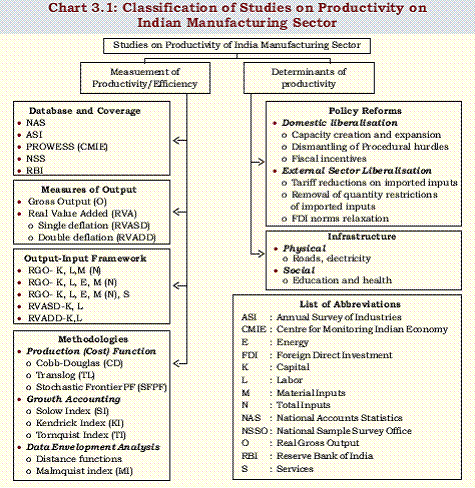
3. Productivity and Efficiency in Indian Manufacturing Sector: A Review of Literature The available literature reviews on studies of productivity in the Indian manufacturing sector have been undertaken by Krishna (1987) and Goldar and Mitra (2002). The former review considered three major studies, viz., Brahmananda (1982), Ahluwalia (1985) and Goldar (1986), i.e., those studies published in the eighties. The review by Goldar and Mitra (2002) encompassed the studies of earlier vintage as well as the recent ones12. The studies reviewed by Goldar and Mitra (2002) have been broadly classified by them into two groups: (i) studies published until 1991 (first group); and, (ii) studies published thereafter (second group). The temporal coverage of the first group of studies varied between 1946 and 1985. Keeping in view the fact that the temporal coverage of this study begins with 1980-81 and that the studies encompassing the period before 1980-81 have already been reviewed competently by the studies mentioned above, we will focus this review on the studies that cover mainly the timespan of the eighties and thereafter. The studies on productivity of Indian manufacturing sector can be classified broadly as follows: (i) studies that provide estimates of productivity growth either for aggregate manufacturing sector or at various levels of disaggregation (states/industries), using alternative databases and methodologies for different time-spans; (ii) studies that test the sensitivity of productivity growth estimates to the alternative proxies for output, viz., real gross output (O) or real value added obtained by single deflation method (RVASD) or real value added obtained by double deflation method (RVADD); (iii) studies that deal with the turnaround of productivity growth, if any, in response to policy reforms undertaken in the Indian economy (the first bout initiated in the eighties13 and the second bout in the nineties); and, (iv) studies that attempt to ascertain the determinants of productivity,such as, the role of infrastructure, investment climate, education, policy reforms (usually examined in an inter-state perspective). In Chart 3.1, we present a synoptic view of the criteria for classifying the studies on the productivity of Indian manufacturing sector.
The studies reviewed by us differ in respect of: (i) the database used and the coverage (spatial/temporal/sectoral) of the study; (ii) the proxy used for level of production; (ii) the inputs included and their measurement; (iii) methodology used for estimation of productivity and efficiency; and, (iv) time-span covered. Due to these differences, the various studies have obtained different estimates/magnitudes of TFPG and efficiency levels. The output of these studies can be classified in terms of: (a) The estimates of TFPG; and, (b) the research question answered by the study, over and above providing the estimates of TFPG. The main research questions that have been raised in these studies are as follows. First, whether there has been acceleration/deceleration or absence thereof in TFPG of manufacturing sector as a consequence of economic reforms in the Indian economy? Second, has trade liberalisation (which is only one of the components of the overall economic policy reforms) made any impact on the TFPG of manufacturing sector? Third, does the provision of infrastructure (social, physical or investment climate) matter in determining the TFPG? Fourth, whether the economic reforms have impacted different industries/ regions/states differently? Lastly, whether the growth of output of Indian manufacturing sector has been driven by TFPG or by intensive use of inputs? As indicated in Chart 3.1, mainly five databases have been used in the studies on productivity/efficiency in the Indian manufacturing sector. The information on databases used by the various studies is given in Table 3.1. Manufacturing sector in National Accounts Statistics (NAS) includes both registered and unregistered segments. Hence, the studies which use NAS database have wider coverage as compared to the other databases. The problem with this database is the non-availability of employment series on an annual basis for unregistered manufacturing sector. Hence, employment series used in the studies based on NAS data has to be intrapolated/extrapolated using different assumptions. Bosworth et al (2007), Mohanty (1992) and Virmani (2004) have used the NAS data. They had to make various assumptions so as to arrive at the estimate of labour input in order to proceed with the estimates of productivity14.
As against it, ASI database provides a much more detailed industry/ state level classification and both primary and non-primary input details are available on an annual basis. Hence, this database has been most widely used among the researchers. However, this database includes only registered manufacturing sector. We have already seen that the registered sector accounts for merely 20 per cent of employment though its contribution in terms of output is about 68 per cent of the total manufacturing sector. A large number of studies, such as, Aghion et al (2003), Ahluwalia (1991), Balakrishnan & Pushpangadan (1994), Banga & Goldar (2007), Das (2004), Dholakia & Dholakia (1994), Gangopadhyay & Wadhwa (1998), Goldar (2004), Hulten & Srinivasan (1999), Majummdar (1996), Mitra (1999), Mukherjee & Ray (2004), Pradhan & Barik (1998), Pradhan & Barik (1999), Pradhan & Barik (2004), Rajesh & Mahapatra (2009), Rao (1996a), Rao (1996b), Ray (2002), Tata Services Ltd (2003), Trivedi et al (2000), Trivedi (2003), Trivedi (2004), Unel (2003), among others, have used the ASI data. The studies which have dealt with the industry/state level issues related to productivity have used disaggregated data up to two or three digit level National Industrial Classification (NIC) for the various states or for India as a whole. The CSO has also started compiling unit level (micro) data for the organised sector and it is available for most of the years since 1993-94. However, this database has been rarely used by the researchers. Construction of capital stock series (at replacement cost) for unit level data is a challenging task, as the estimates of capital stock in earlier years are not available. One of the main reasons for underutilisation of this data is that permanent serial numbers or identification codes for the units included in the sample are not available partly due to the sampling procedure and partly on the grounds of maintaining confidentiality. Hence, it is not possible to construct either a balanced or an unbalanced panel from this dataset, something that would be of interest to researchers when using the micro level data. In view of this, despite its richness in terms of information content, this dataset is also grossly underutilised. Only a few researchers, viz., Sivadasan (2007), Bhaumik, et al (2006) and Kathuria, et al (2010) have used the unit level ASI dataset sourced from the CSO . PROWESS database of CMIE consists of data on companies and is compiled from their financial statements. More often than not, this database does not include labour input and hence, is not particularly suited for productivity measurement. The problem of construction of labour input series for this dataset is similar to that for the NAS data. The studies by Balakrishanan et al (2000), Topalova (2004) and Krishna & Mitra (1998) have used this database and had to make various assumptions for the construction of labour input series. However, PROWESS database has the advantage that it is micro level database and it is possible to construct a panel from this database and also stratify performance of the companies according to their size or some other criteria. This dataset encompasses only a subset of organised manufacturing sector, as the financial statements are issued mandatorily only for the listed companies. As can be seen from Table 3.1, this database also has not been used as intensively by the researchers as is the case with the ASI database. The RBI dataset has advantages and limitations which are more or less akin to the PROWESS dataset, as both the datasets are based on information culled out from the audited annual accounts of the companies. The RBI standardises the data items presented in annual accounts of companies through a normalization process, which is based on accounting principles. However, the firm level data compiled by the RBI is not publicly available. Despite the fact that the identification of firms is confidential, the codes are given to companies and hence it is possible to construct a balanced/unbalanced panel from the RBI dataset. Only Srivastava (1996) and Srivastava (2000) studies have used this dataset. More detailed data (at industry and state levels) on unorganised manufacturing sector is available from the ‘reports’ of the various enterprise surveys conducted by the NSSO. This dataset is available only for a few years and at times not exactly comparable across the different surveys. The enterprise level data is also maintained by the NSSO and it is an enormously rich dataset, but again it is not possible to construct a panel from this dataset. In addition, there is a problem of constructing a reliable capital stock series for the enterprises included in this dataset. Unni et al (2001), Raj & Mahapatra (2009), Raj & Duraiswamy (2006) and Goldar & Mitra (2008), Kathuria, et al (2010) have used NSSO data for analysing the performance of unorganised sector in terms of employment, output and/or productivity growth rates. Most of these studies have also used ASI data for organised sector so as to provide a comparison between organised and unorganised segments of the Indian manufacturing sector. Jayadevan (1996), Mitra (1999), Unni et al (2001), Ray (2002), Sunil Kumar (2003), Aghion (2003), Trivedi (2003), Mukherjee & Ray (2004), Trivedi (2004), Raj & Duraiswamy (2006), Raj and Mahapatra (2009), and Goldar and Mitra (2008) have used state-level disaggregation to investigate the state level performances and/or determinants of productivity. Quite a few studies, such as Ahluwalia (1991), Krishna & Mitra (1998), Pradhan & Barik (1998), Gangopadhyay and Wadhwa (1998), Pradhan and Barik (1999), Mitra (1999), Trivedi, et al (2000), Trivedi (2003), Unel (2003), Das (2004), Pradhan & Barik (2004), Trivedi (2004), Veeramani and Goldar (2005), etc., have estimated TFPG at industry levels using the ASI dataset. In brief, the research on productivity on Indian manufacturing sector has been gaining popularity among researchers. As is evident from the above discussion, ASI industry/state level database has been the most often used database, since it provides the essential information required for estimation of productivity. The data limitations for micro level data compiled both by CSO and NSSO need to be addressed by the Ministry of Statistics and Programme Implementation, GoI, so as to enable the researchers to exploit the rich information content embedded in these datasets. 3.2: Output-Input Framework and Methodologies UsedProductivity estimates are sensitive to measurement of output and inputs, besides that to the methodology used. There has been a debate over the appropriate measure of output and the corresponding inputs to be used for productivity measurement. The three alternatives proxies of output used in the various studies are: (i) real value added obtained by single deflation (RVASD); (ii) real value added obtained by double deflation (RVADD); and (iii) real gross output (RGO). The NAS data is compiled using the RVASD methodology. ASI provides data on nominal value added and prior to Balakrishnan and Pushpangadan (1994) researcher in India mainly used RVASD as a measure of output. Balakrishnan and Pushpangadan (1994) refuted the claim of Ahluwalia (1991) regarding turnaround in TFPG of organised manufacturing sector arguing that such a conclusion was arrived at due to the use of inappropriate proxy for measurement of output, viz., RVASD. They recommended use of RVADD instead of RVASD. A number of researchers, viz., Ahluwalia (1994), Dholakia and Dholakia (1994), Goldar (1994), Pradhan and Barik (1998), Rao (1996a), Rao (1996b) and Shastry (1994), etc., contributed to this lively debate. Since the use of RGO does not involve the assumption of separability of production function, we find that the studies after 1994 have taken a greater recourse to the use of RGO as the measure of output and in view of this the input framework has been extended to include material inputs as well. Table 3.2 details the input-output and methodological framework adhered to in the various studies on TFPG15. The input framework in the case of use of RVASD and RVADD (as proxies to output) has to be confined to labour and capital. The input framework has to be modified to include material and other inputs in the case of use of RGO as a proxy for production. As can be seen from Table 3.2, various studies have used input frameworks which are not the same. The input frameworks used range from the use of two inputs, viz., K16 and L (capital stock and labour, respectively) to five inputs, viz, K, L, E (energy), M (material inputs), N (total inputs) and S (services). It is pertinent to note here that some studies have used the two variants of labour inputs, viz., production workers (L1) and non-production staff (L2, which is obtained by subtracting L1 from the total number of employees). Studies, such as, Bosworth et al (2007), Veeramani (2005) have adjusted for labour quality as well. We have refrained from discussing the construction of capital input series in the studies covered in this survey, not because of lack of its importance, but due to the elaboration it requires. Usually capital stock series are available at book value and need conversion into one at replacement cost. Quite a few studies have attempted such conversions adhering to the various assumptions about the capital stock in the benchmark year, the rate of depreciation and the rate of inflation deemed relevant to capital goods which have been proxied either by investment deflator or the WPI of machinery and transport equipment. Then the perpetual inventory method (PIM), is used which requires the estimates of capital stock for the benchmark year and capital formation for the successive years. However, some of the studies have simply used the capital stock series at book values, which is inappropriate.
The use of RVADD and RGO necessitates computation of material/ input price indices. As can be seen from Table 3.2, quite a few studies have used only one input-output absorption matrix for obtaining weights for material inputs/total inputs used by industries/manufacturing sector. Fixed weights imply that the input structure does not change over time even as technology and input prices change. This seems to be an untenable assumption, especially if one is trying to assess the impact of policy reforms on TFPG. Balakrishnan and Pushpangadan (1994) did test the sensitivity of productivity estimates to the alternative weighting diagrams for material inputs derived from 1973-74 and 1983-84 I-O absorption matrices and demonstrated that it does not alter their conclusion of ‘no turnaround in TFPG in the eighties’. Though the insensitivity of TFPG estimates or turnaround to the two set of I-O coefficients may be true for the data set analysed by them, this cannot be presumed on theoretical grounds. Whilst constructing the input price index it is desirable to incorporate the changes in weights of various inputs which are expected to take place over time. To best of our knowledge Das (2004) and Trivedi (2004) are the only studies, which have incorporated changing weights derived from the various available I-O matrices. A few studies, such as, Srivastava (1996) and Hulten and Srinivasan (1999) have used Tornquist indices of inputs for the aggregation of inputs. 3.3: Methodologies UsedIn Table 3.2, we have also provided a synoptic view of the methodologies used by the various studies on the TFPG for the Indian manufacturing sector17. As outlined in Chart 3.1, there are three major alternative approaches, viz., production function Approach (PFA)/Cost Function Approach (CFA), Growth Accounting Approach (GAA) and Data Envelopment Analysis (DEA) for estimation of TFPG and/or efficiency levels and changes. PFA/ CFA and Stochastic Frontier Production Function (SFPF) approaches are parametric approaches and involve estimation of parameters. These approaches require assumptions about the underlying production functions. As against it, GAA and DEA are non-parametric approaches. The DEA does not require any prior assumption about the underlying functional form for production technology used by the firms/ industry. This approach yields estimates of efficiency, i.e., it provides estimates of efficiency of various firms in relation to the most efficient firm for which efficiency is set at unity. Thus, as mentioned earlier, efficiency is a relative concept. Malmquist index of productivity is also based on the concept of the distance functions. As can be seen from Table 3.2, most of the studies in India have adhered to GAA and used the translog (TL) production function as the underlying form of the production function. It collapses into Cobb-Douglas (CD) production function, if the interaction terms are not significant. The studies using GAA have also used factor shares as the weights for the inputs. This implies the assumption of perfectly competitive market structure. Restricting the sum of weights for factor shares to unity implies constant returns to scale (CRS). A few studies, such as, Majumdar (1996), Ray (2002), Mukherjee and Ray (2005), Raj and Duraiswamy (2006), Raj & Mahapatra (2009) have used the DEA and have provided estimates of efficiency. A couple of studies, such as, Bhaumik et al (2006) and Sivadasan (2007) have also tried to overcome the problem of endogeneity in the use of capital by following procedures laid down in Olley & Pakes and Levinsohn & Petrin (2003) 3.4: Efficiency and Productivity Estimates In the preceding three sections, we have detailed the differences in the time-period, input-output frameworks and methodologies used in the various studies. In view of this, it is natural that these studies yield disparate estimates of efficiency and productivity and it is rather difficult to arrive at some consensus regarding; (i) estimates of TFPG/efficiency; (ii) Contribution of TFPG to growth; and, (iii) The turnaround in productivity growth in response to policy reforms.Tables 3.3A and 3.3B provide a synoptic view of these aspects of the various studies surveyed in this section. It is pertinent to note here that wherever possible, we have tried to estimate the rates of growth of production as used in the respective studies and the contribution of TFPG to growth from the information provided in these studies so as to enable us some meaningful comparisons across studies. It can be seen from Tables 3.3A & 3.3B that, in general, the estimates of TFPG obtained with RVADD as a proxy for output are much higher as compared with those obtained with RVASD or RGO. In view of empirical evidence provided by Pradhan and Barik (1998) about non-separability of inputs in production function, the productivity estimates based on RGO seem to be preferable to the alternative estimates. For the organised manufacturing sector, TFPG estimates based on RGO confirm that the contribution of TFPG to output growth has been rather modest. As regards the unorganised manufacturing sector, the estimates of TFPG seem to be rather unreliable in view of the data limitations. Unni et al (2001) provide the estimates of TFPG and real value added for unorganised manufacturing. If we extrapolate the contribution of TFPG to growth from these data, the conclusions arrived at are rather bizarre. The problem seems to lie in the inaccurate measurement of capital. Hence, it would be better to focus on labour productivity rather than TFPG for unorganised sector. As regards the turnaround of TFPG, different cut-offs for demarcating pre-reform from post-reform periods have been used in the various studies. In general, the beginning of the eighties, mid-eighties and beginning of the nineties have been considered cut-off for pre-reform and post-reform periods. 3.5 Turnaround and Determinants of Productivity and EfficiencyIn this section, we discuss the turnaround of productivity and efficiency for the organised and unorganised manufacturing sectors. As can be seen from Table 3.3A and 3.3B, the studies on unorganised sector have been very few.
3.5.1 Organised Manufacturing Sector Studies by Ahluwalia (1991), Dholakia and Dholakia (1994), Majummdar (1996), Gangopadhyay & Wadhwa (1998), Srivastava (1996), Mitra (1999), Tata Services Limited (TSL, 2003), Topalova (2004) and Unel (2003) find that change in policy regime in India has been associated with higher TFPG and/or efficiency. However, the timing of the change of policy regime in these studies differs. Ahluwalia (1991), Dholakia and Dholakia (1994), Majummdar (1996), Gangopadhyay and Wadhwa (1998), among others, have used the eighties as the beginning of the liberalised policy regime and compared it with the earlier period. Srivastava (1996) and Mitra (1999) compared the post mid-eighties with the earlier period and treat the former as a period of liberalised policy regime. Ray (2002), Unel (2003) and Topalova (2004) treat the nineties as the period of reform period and compare it with earlier period. Mohanty (1992), Balakrishnan & Pushpangadan (1994), Rao (1996a), Pradhan & Barik (1998), Hulten & Srinivasan (1999), Unni et al (2001), Das (2004), Goldar (2004), Trivedi (2004), Banga and Goldar (2007), among others, find that TFPG has decelerated during the post-reforms period. Again, like the studies quoted in the above paragraph, these studies also use different periodisation for the pre and post-reform periods. However, except for a couple of studies, the mounting empirical evidence points out to the deceleration of TFPG during the nineties, as compared to that in the eighties. Some studies attribute it to the poor capacity utilisation during 1990s while others attribute it to the lag between reforms and impact on productivity growth. It is also noteworthy that quite a few of these studies have used policy dummy to demarcate the pre-reform from the post-reform period, with the exception of a few studies which have used the specific variables pertaining to tariff reduction, FII and FDI inflows, etc., as a proxy for the liberalised regime. 3.5.2 Unorganised Manufacturing Sector The studies by Mohanty (1992) and Unni, et al (2001) do not indicate any acceleration in TFPG for the unorganised sector in the wake of liberalisation, irrespective of the periodisation of reform period. As against it, Raj and Duraiswamy (2006) and Raj and Mahapatra (2009) indicate increase in TFPG and efficiency for the unorganised sector during the reform period. In fact, a recent study by Kuthuria et al (2010) finds a steady decline in TFPG in unorganised manufacturing sector over the period 1994-2005. 3.5.3 Determinants of TFPG across States Besides the policy reforms, various state-specific characteristics have also been used by the researchers to investigate the determinants of TFPG. Jaydevan (1996), Ray (1997), Mitra (1999), Ray (2002), Kumar (2003), Aghion (2003), Trivedi (2003), Trivedi (2004), Mukherjee and Ray (2004), and Topalova (2004) are among a few studies which also deal with the estimation and/or determinants of productivity across states. The estimates of TFPG provided by some of these studies are provided below in Table 3.4. It can be seen from Table 3.4 that TFPG estimates by Mitra (1999) are rather high as compared to the other studies. This is mainly due to the use of RVADD used as the output proxy. The differences between TFPG in other studies are not too wide. Both Mitra (1999) and Ray (2002) indicate improvements in TFPG in response to policy reforms. However, Mukherjee and Ray (2004) do not indicate any substantial improvement in efficiency at the all India level as a result of reforms and also do not indicate any substantial changes in ranking of the states or convergence of efficiency in response to economic reforms in India. The inter-state variations in TFPG are high in the study by Mitra (1999). There is some problem in ranking of states according to TFPG since in the case where output fall is lower than fall in employment rate, it gets reflected in high or rising TFPG and such a state can get a higher rank, despite its poor overall performance.The case of Bihar* has been pointed out by Ray (2002) and Trivedi (2003, 2004). Some of the other studies have used the various characteristics of states which are considered as pertinent to exploiting the advantage of reforms at the state levels. These factors have been predominantly geographical location of states which makes them more suitable for water/surface transport, investment climate, labour regime as to whether it is pro-labour or pro-business or neutral. These characteristics have been provided in Table 3.5. 4. Coverage of the Study and Methodology 4.1. Coverage of the Study and Data Details This study can be considered both a continuum and a complement to the previous studies, viz., Trivedi et al (2000), and Trivedi (2004). These studies encompassed only organised manufacturing sector. The present study is more comprehensive as compared to the previous studies as regards the datasets used and its coverage which are as follows:
The study encompasses 18 major states of India, three of which were bifurcated in November 2000. The bifurcated states are: Bihar, Madhya Pradesh and Uttar Pradesh. Three new states, viz., Jharkhand, Chattisgarh and Uttarakhand were carved out of Bihar, Madhya Pradesh and Uttar Pradesh, respectively. To ensure the comparability of pre-bifurcation period with the post-bifurcation period, we have added the data for the newly created state to the respective state from which it was created. We have marked the bifurcated States with ‘*’. Thus, the states included in this study, arranged in alphabetical order, are: Andhra Pradesh (AP), Bihar* (BIH*), Delhi (DEL), Gujarat (GUJ), Haryana (HAR), Karnataka (KAR), Kerala (KER), Maharashtra (MAH), Madhya Pradesh* (MP*), Orissa (ORI), Punjab (PUN), Rajasthan (RAJ), Tamil Nadu (TN), Uttar Pradesh* (UP*) and West Bengal (WB). The industry groups chosen for investigation, again arranged in alphabetical order are: (i) Chemical and chemical products (CHEM); (ii) Food, Beverages and Tobacco (FBT); (iii) Leather and leather products (LEATH); (iv) Metal and metal products (METAL); (v) Machinery and transport equipment (MTE); and, (vi) Textiles and textile products (TEX). In addition, we have investigated the performance of overall manufacturing sector (MFG).
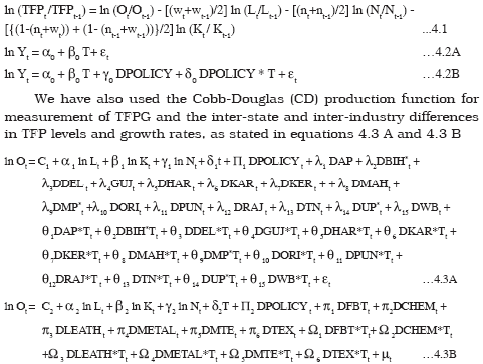
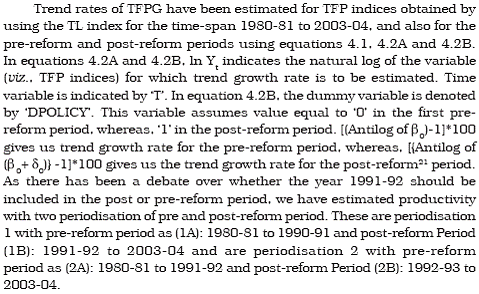
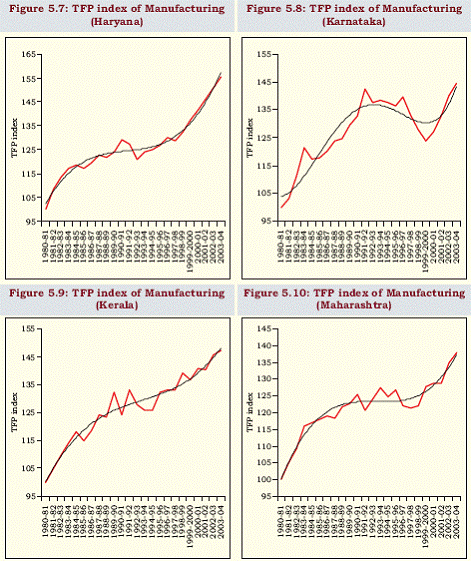
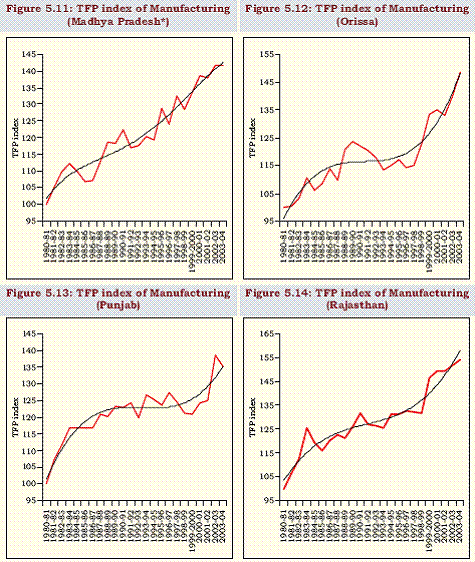
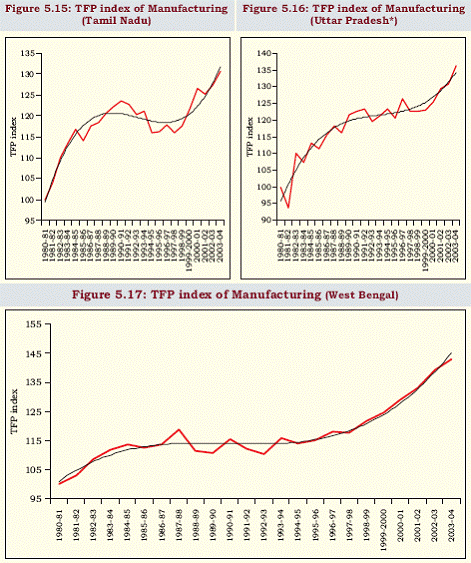
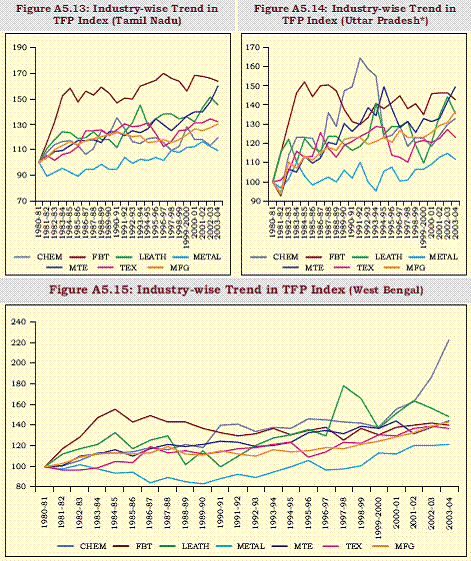
Thus, this study is a major revision of the earlier studies, in terms of the spatial coverage, temporal coverage, sectoral coverage and application of alternative methodologies to examine the performance of the Indian manufacturing sector. The input price index in this study uses input weight for input prices based on the CSO Input-Output tables 1978-79, 1984-85, 1989-90, 1993- 94 and 1998-9919 and hence this index is expected to reflect a more adequately the movement in input prices as compared with the indices which have been used in the other studies. The advantage of using these weights is that these indices also include the prices of ‘infrastructure and other services’ as well. The extension of time-period in this study has also enabled us to increase the length of the post-reform period in our dataset. For the period of the study, three National Industrial Classification (NIC) codes have been used for data collection by the Annual Survey of Industries (ASI). The details of NIC codes (1970, 1987 and 1998) of the industries covered in this study have been provided in Annexure 4.1. It may also be noted that the necessary adjustment has been made in the data series for period 1980-81 to 1997-98 so as to make it comparable to the ASI data reported after 1997-98 (as these do not include electricity, etc.). Output: We have used gross output/value of output as the proxy for output, which has been converted in real terms by deflating it by the WPI for the respective industries. For the datasets which begin in 1993-94, we have used WPI with 1993-94 base and for the ASI industry-state level data which begins in 1980-81, the WPI series have been spliced and arithmetically converted to 1981-82 base. Labour: Total persons engaged/ total employees have been used as a measure of labour input. We did not attempt to adjust for the quality of the labour. It may be pertinent to note that Bosworth, et al (2007) did adjust for the quality of labour and did not find any significant contribution of education to productivity. Inputs: As mentioned earlier, we have included total inputs which comprise of material, fuel and inputs of other services and we have deflated total inputs by a weighted index of input prices, wherein, the weights of input prices have been assigned in proportion to the value of inputs used to the total inputs used by the respective industry. The weights have been derived from the absorption matrices of the various input-output tables provided by the CSO. The industry codes in the various input-output matrices which are matched with the various NIC codes are provided in Annexure 4.2. Capital Stock: As the stock of capital is available at the historic cost, we have converted the same to replacement cost, wherever possible. This has been possible in the case of datasets 1 and 3. For datasets 2 and 4, this conversion was not possible due to the lack of data on the units’ capital stock in years prior to 1993-94. Annexure 4.3 details the procedure for compilation of capital stock series for dataset 1 and Annexure 4.4 does so for the dataset 3. Productivity and efficiency levels/changes can be measured using either parametric or non-parametric methods. In Table 4.3, we outline the main methodologies used in the literature to measure productivity and efficiency levels/changes. We have used some of these methodologies and these are explained in the various sub-sections in the context of the dataset used. 4.3.1 ASI dataset for Industry-State Levels (Organised Manufacturing Sector) For this dataset, we have used Equation (4.1) to estimate ‘annual’ TFPG, which have later been used to construct TFP indices. The trend growth rates of TFP for the entire time-span of the study have been estimated by using the semi-log trend equation as specified in equation (4.2A). Equation (4.2B) has been used for estimating trend rates of growth of TFP for the pre-reform and post-reform periods, respectively.
The notations used in the above equations are as follows. ‘O’ and ‘N’ denote value of output and raw materials at constant (1981-82) prices. ‘L’ and ‘K’ denote labour employed and real capital stock, respectively. In equation (4.1), ‘w’ and ‘n’ are shares of wages and inputs (excluding factor inputs) respectively, in nominal output. ‘ln’ indicates natural logarithm, whereas, ‘t’ denotes time. We have used notation ‘T’, wherever we have used time an explanatory variable. The weight of capital input in equation (4.1) has been obtained as residual, i.e., by subtracting the sum of weights of labour and inputs from unity.
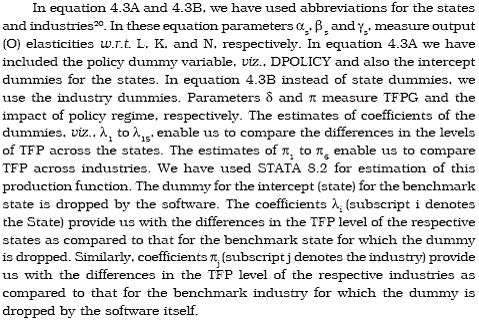
We have also included multiplicative or slope dummies in equation 4.3A (4.3B) which have been obtained by multiplying the state (industry) intercept dummies with the time variable. These dummies have been indicted by ‘T’ and multiplied to the intercept dummies. Needless to mention that one of the states/industries is treated as benchmark state/industry for TFPG and the multiplicative dummy for the benchmark state/industry is dropped by the software. The coefficients of slope dummies capture the differences in TFPG of various states/industries in relation to the benchmark state/industry. Equation 4.3A and 4.3B have been estimated using the panel data. Data for 15 states/6 industries for the abovementioned variables spanning the time-period 1980-81 to 2003-04 (24 years) constituted the balanced panel for each state/industry group. The benchmark states/industries for intercept dummies and slope dummies are indicated in the empirical results.
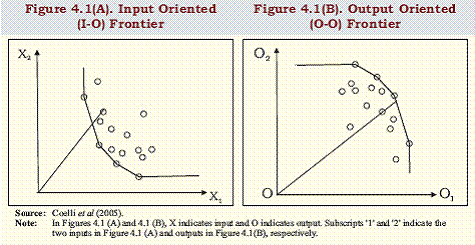
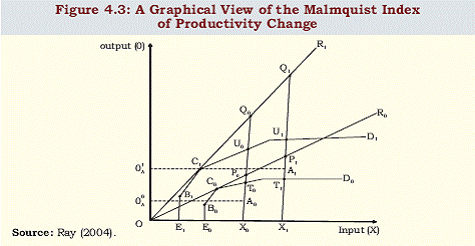
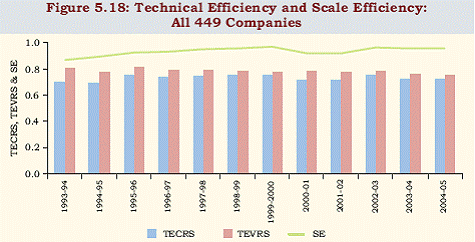
As regards the measure of production, gross output22 has been preferred to value added and hence, total inputs23 have been included in the set of inputs. Data on value of output, number of employees, value of material inputs and net fixed capital formation, fixed capital, etc., have been drawn from the datasets mentioned above. All these data, barring the number of employees, are in nominal terms. Nominal output has been converted into real output by using the Wholesale Price Index (WPI) for the relevant industry/industry groups. WPI series with base 1970-71, 1981- 82 and 1993-94 have been used for the relevant periods. The 1970-71 and 1993-94 WPI series have been arithmetically brought to a common base year, i.e., 1981-82. We have converted the nominal inputs series into real input series by deflating them by the input price index series constructed for each of the industry groups. As mentioned above, five input-output matrices have been used to obtain the weights for inputs used by the selected industries. These are Input-Output (Commodity X Industry) absorption matrices. The industries in the input-output absorption matrices which broadly correspond to the industries selected in this study have been reported in Annexure 4.2. As both workers and supervisory/managerial staff changes can affect productivity, we have preferred to use the number of employees over the number of workers, as a proxy for labour input. For the period 1998-99 to 2001-02, the data on total persons engaged has been used. The data on emoluments and of total inputs in nominal gross output, used to calculate ‘w’ and ‘n’, respectively (see Equation 4.1), have also been drawn from the ASI and used for estimating TFPG for dataset 1. The National Accounts Statistics (NAS) 1990 provides estimates of net fixed capital stock (NFCS) for the registered manufacturing sector. Using data from NAS and from ASI, we have constructed the capital stock series. Details of compilation of capital stock series have been provided in Annexure 4.3. 4.2.2 ASI dataset at Unit Level (Organised Manufacturing Sector) As mentioned earlier, this dataset does not enable us to construct either a balanced or unbalanced panel, as it is not possible to assign identification codes for the units surveyed in the sample sector. In view of this, the best we could do is to estimate efficiencies derived from the stochastic frontier production function, for each year and for each industry and report the mean efficiency levels for the same. For this dataset, at best we could use a Cobb-Douglas and Translog Production Frontier using cross-sectional data and assuming a truncated normal distribution for the non-negative random variable (Ui) that capture inefficiency. The Translog Production Frontier functional form underlying this model is given in Equation (4.4) and the Cobb-Douglas function excludes the square and interaction terms for inputs from this equation. Here ‘i’ indicates the firm and Vi are random error term with a zero mean and constant variance and are identically and independently distributed (iid). The estimates of efficiency have been obtained using Front 4.1 version of the software provided by Tim Coelli24. 4.2.3 RBI dataset at Unit Level for Non-government Public Limited Companies This dataset enabled us to construct a balanced panel for industries and for all manufacturing. We have estimated the standard efficiency models within the framework of data envelopment analysis (henceforth, DEA), with the assumptions of CRS (constant returns to scale) and VRS (variable returns to scale) for each of the industries across years and also estimated the output-oriented Malmquist index (MIo) for estimating productivity change. As mentioned by Coelli (1996) DEA drawing upon the works of Debreu (1951) and Koopmans (1951), Farrell (1957) outlined the framework for measurement of levels of efficiency in the framework of DEA. DEA method involves construction of a piecewise linear frontier (using the linear programming models) for the decision making units (DMUs) from their observed input-output data. In other words, these combinations of inputs-outputs are based on the actual data and no functional form to the underlying relationship between inputs and outputs is assumed. Thus, the construction of the frontier is parameter free. Efficiency of a DMU is measured in terms of how far it is from the frontier. DEA can be either input-orientated or output-orientated. The input-orientated (I-O) DEA method defines the frontier by seeking the maximum possible proportional reduction (radial measure) in input usage for a given output for each DMU. This is shown in Figure 4.1 (A). In the case of output orientated (O-O) DEA method, it measures the maximum proportional (radial measure) increase in output production, for the input levels (Figure 4.1 (B)). (In)efficiency of a DMU is measured in terms of how far it is from the frontier. The efficiency is bound between 0 and 1, with DMUs which are on the frontier, the efficiency level will be equal to 1 and those outside (inside) it in the case of I-O (O-O) will have efficiency levels less than 1. The I-O and O-O measures of technical efficiency yield identical results in the case of constant returns to scale (Fare and Lovell, 1978).
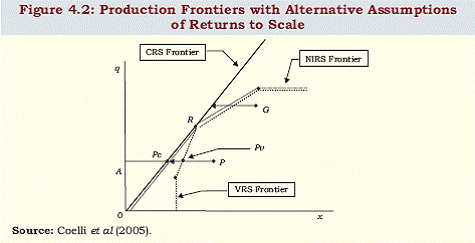
The assumption of CRS is valid when all DMUs operate at optimal scale. In the situations of market imperfections and distortions, the companies have to deviate from operating at optimal scale. Adjustments to CRS-DEA model to incorporate VRS were suggested by Fare, Grosskopf and Logan (1983) and Banker, Charnes and Cooper (1984)25. Technical efficiency (TE) measured with the assumption of CRS in the event of market imperfections and distortions is confounded by scale efficiencies (SE). In order to remove the effect of SE from TE, the use of VRS models is adhered to. Figure 4.2 and equations 4.5 to 4.8 illustrate how the assumptions regarding the returns to scale can alter the measurement of TE. Figure 4.2 depicts one output and one input case. We measure output quantity (q) on Y axis and input quantity (x) on X axis. CRS and VRS frontiers have been indicated along with the NIRS (non-increasing returns to scale) portion of the VRS frontier. The input oriented technical and scale efficiencies at point ‘P’ (Figure 4.2) can be estimated as follows.
In other words, the scale efficiency can be interpreted as the ratio of the average product of the DMU operating at point Pv to the average product at the point of technically optimal scale of production at point R. We have used DEAP version 2.1 of the software provided by Tim Coelli 26 for measuring efficiency levels of DMUs and have reported only the mean efficiency levels of companies for each industry in the following chapter. We have used equation 4.4 and also the Cobb-Douglas specification to estimate the efficiency of various industries. The Cobb-Douglas specification excludes the quadratic and multiplicative terms of equation 4.4. Rest of the description of methodology remains the same as specified in section 4.2.2. Frontiers and technical-efficiency measures can be compared across time by means of the Malmquist index. Malmquist productivity indices were first introduced into the literature by Caves et al27 (1982) and were empirically applied by Fare et al (1994). They demonstrated that the Malmquist output based productivity index can be decomposed in two components: (i) representing the reletive efficiency change index under the constant returns to scale and measures the degree of catching up to the best-practice frontier for each observation between time period t and time period t+1; and (ii) representing the technical change index which measures the shift in the frontier of technology between two time periods evaluated at Xt and Xt+1. The Malmquist index output oriented (MIo) index of productivity change is the geometric mean of the two output based Malmquist TFP indices. The former ratio uses the period t technology and the latter ratio uses period t+1 technology. The four distance functions are calculated for MIo.
A value of MIo > 1 indicates positive TFP growth from period t to period t+1, while a value less than one indicates a TFP growth decline. We elaborate this using Figure 4.3.
In Figure 4.3, Ro and R1 indicate the CRS frontiers for the two times period 0 and 1, whereas, the piecewise linear frontiers depict the VRS frontiers. The lower frontier is for time period ‘0’ and the upper frontier is for time period 128. To measure the Malmquist index of productivity change, we have used DEAP 2.1 version, provided by Coelli. 4.2.4 Unit level NSSO data As seen in Section 2, the unorganised manufacturing sector is more important in terms of generation of employment rather than in terms of contribution to the output. There were numerous problems with capital stock series for the unit level data for unorganised sectors and we did not deem it appropriate to use the same. In view of this, instead of solving the huge number of linear programming models and examining the efficiencies of DMUs or industries, we have estimated industry-wise average labour productivity in unorganised sector and compared the same with the organised sector. In other words, we can view the organised sector as providing a benchmark to the unorganised sector or vice versa. 5. Productivity and Efficiency of Indian Manufacturing Sector This chapter details the estimates of TFP levels, TFPG and efficiency of the Indian manufacturing sector. In section 5.1, we present the empirical results pertaining to the organised manufacturing sector (industry and state levels), using the both growth accounting and production function approaches. The estimates presented in section 5.1 are for the period 1980-81 to 2007-08 for aggregate manufacturing sector and for the period 1980-81 to 2003-04 for ASI data at industry and state levels. In section 5.2, we present the efficiency estimates using the Stochastic Frontier Production Function (SFPF) (TL specification) for the ASI unit level data. The estimates presented in section 5.2 are for the period 1993-94 to 2003- 04 (barring the year 1995-96, due to the non-availability of data). Section 5.3.provides estimates of efficiency for the Public Ltd. Companies (RBI dataset), using Data Envelopment Analysis (DEA), Stochastic Frontier Production Function with both Cobb-Douglas and Translog specifications and also productivity growth estimates using the Malmquist Index. The estimates of productivity and efficiency provided in this section are for the period 1993-94 to 2004-05. Section 5.4 provides estimates of labour productivity for the unorganised manufacturing sector based on the NSSO unit level data. This dataset is available for 1989-90, 1994-95, 2000-01. A comparison of labour productivity between organised and unorganised sectors has also been provided in section 5.4. 5.1 Total Factor Productivity in India’s Organised29 Manufacturing Sector (MFG) 5.1.1 Growth Accounting Estimates of TFPG: Trends In this sub-section, we first discuss the trend growth rates of TFP obtained using the growth accounting framework (i.e., discrete approximation of the translog production function). As mentioned earlier, opinions have differed over the inclusion of the year 1991-92 as a post or pre-reform year. In view of this, we have estimated productivity with two alternative pre and post reform periods. These are classification 1 with pre-reform period as (1A): 1980-81 to 1990-91 and post-reform Period (1B): 1991-92 to 2003-04 and classification 2 with pre-reform period as (2A): 1980-81 to 1991-92 and post-reform Period (2B): 1992-93 to 2003-04. This is to ensure that the choice of cut-off period does not vitiate the comparison of TFPG during the pre and post reform period. We also highlight the annual variations in TFPG which allow us to view the fluctuations in TFPG over the span of the study. Figure 5.1 gives a synoptic view of the TFP index and TFPG for the organised manufacturing sector. It can be seen from Figure 5.1 that the TFP index registered a rise in the eighties, though the rate of increase decelerated as we approached the end of the eighties. Despite the fluctuations in TFPG during the eighties, the trend rate of TFPG (refer section 5.1.2 for more details) is about 2 pcpa during the pre-reform period irrespective of which of the two alternative cut-off periods are considered. The deceleration in TFPG during the post-reform period, especially in the nineties, is very much evident. The TFPG estimates for the post-reform period with the two cut-off periods are 0.98 and 1.05.30 The deceleration in TFPG during the post-reform period is statistically significant. However, one of the redeeming features of the growth of manufacturing sector in India is that in the post-nineties, TFP index seems to be on an ascent, as can be seen from Figure 5.1.
Table 5.1 provides the trend rates of TFPG across the various industries. It can be seen from Table 5.1 that TFPG for the manufacturing sector for the period 1980-81 to 2007-08 works out to be about 0.99 pcpa. As regards the rate of change of TFP (TFPG) for MFG as a whole, it witnessed deceleration during the post-reform period. For the period 1980-81 to 2003-04, CHEM and MTE industries witnessed TFPG which were much higher than those witnessed by other industries. As against it, FBT and TEX industries were responsible for pulling down the TFPG of MFG as a whole. TFPG of METAL industry was comparable to that witnessed by the MFG. Both CHEM and TEX industries witnessed deceleration in TFPG. The only shining industry seems to be the METAL industry during the post-reform period, which seems to be confined to the nineties alone. The 7 other industries, viz., FBT, MTE and LEATH did not witness either acceleration or deceleration in TFPG during the post-reform period.
In Figure 5.2, we provide a synoptic view of the yearly movements of TFP index across the selected industries. We can see from Figure 5.2 that during the post-nineties, most of the industries, barring FBT have demonstrated rising TFP levels. In other words, by and large the Indian manufacturing sector productivity performance seems to have improved in the recent years in comparison to that witnessed during the nineties. Table 5.2 provides the trend rates of growth of TFPG for the manufacturing sector across the various states of India. It can be seen from Table 5.2 that, the TFPG has decelerated for the total manufacturing sector as well as for most of the states. In the case of AP, MP*, Orissa and Rajasthan neither acceleration nor deceleration in TFPG was witnessed, irrespective of the cut-off year for pre and postreform period. Incidentally these states, barring AP, are not the major contributors to the output of organised manufacturing sector in India. Haryana and West Bengal have demonstrated acceleration in TFPG. Acceleration in TFPG in Haryana is sensitive to cut-off year for the reform period, whereas, for West Bengal, acceleration is more robust. In brief, the TFPG in three major states of India, viz, Gujarat, Maharashtra and Tamil Nadu was either below or equal to the TFPG for India as a whole and these states witnessed deceleration in TFPG. Only West Bengal, which ranked high in terms of output in 1980-81, witnessed acceleration in TFPG. However, this is only a partial view of the industrial performance, as will be explained shortly. In what follows, we present the industry-wise TFPG (Table 5.3 to Table 5.8) for each of the selected states of India. We provide the estimates of TFPG for both pre and post-reform periods. It may also be noted that TFPG at industry levels in a few states could not be estimated due to data problems in capital stock series31. As mentioned earlier, Gujarat and Maharashtra are the two major states which account for more than half of the national output of chemical industry. Both these states witnessed TFPG (see Table 5.3) which was lower than the TFPG for this industry for the country as a whole. Moreover, both these states as well as many other states witnessed deceleration in TFPG in this industry. Kerala, West Bengal and Orissa witnessed neither acceleration nor deceleration in TFPG. However, in the former two states this industry has the least presence, whereas, in West Bengal this industry has a good presence. As can be seen from Table 5.4, FBT industry witnessed negative trend rate of TFPG over the entire span of the study and did not witness any acceleration or deceleration in TFPG during the post-reform period over the pre-reform period, irrespective of the two cut-off periods chosen. Maharashtra, UP*, AP, Gujarat and Tamil Nadu are the states in which FBT industry has the maximum presence. In other states as well, FBT industry has not witnessed acceleration in TFPG in the post-reform period. It can be recalled that this is one of the industries which accounts for about 21 per cent of employment in organised manufacturing industry. A fall in productivity level in FBT industry coupled with no improvement in growth of productivity in this industry during the post-reform period should certainly be a cause of concern for policy makers. Tamil Nadu, UP* and West Bengal are the three major states which account for most of leather production in India. The TFPG of this industry is above that witnessed by the manufacturing sector as a whole (Table 5.1). Though the TFPG rates for leather industry (Table 5.5) during the post-reform period are slightly higher than those witnessed in the prereform period, the acceleration is not statistically significant. West Bengal did witness acceleration in TFPG over the post-reform period, but this was not the case with other two states. Also TFPG in the two other states was much below that witnessed by West Bengal, if the entire time-span of the study is considered. TFPG of metal industry was higher than the TFPG for the manufacturing sector as a whole (Table 5.1). Moreover, TFPG for metal industry accelerated during the post-reform period, unlike the other industries. The dominating states in the case of metal industry are: Maharashtra, West Bengal, Bihar* and MP*. Maharashtra displays almost absence of growth of TFP in metal industry. The acceleration/deceleration of TFPG is sensitive to the choice of the cut-off year for reform and is significant only at 20 per cent level. Hence, Maharashtra does not account for acceleration of TFPG of metal industry. Bihar* also did not show either acceleration/deceleration in TFPG in metal industry, though it certainly accounts for better overall performance of TFPG of metal industry. MP* and West Bengal witnessed TFPG in metal industry close to the national rate and also the acceleration of TFPG in these two states in the postreform period was statistically significant.
MTE industry demonstrated a better performance in terms of TFPG as compared to the other industries (Table 5.1). This industry did not witness any significant acceleration/deceleration in TFPG during the postreform period. Machinery and transport equipment industry is located mainly in Maharashtra, Tamil Nadu, Haryana, UP*, Karnataka and Gujarat. Maharashtra and UP* have witnessed significant deceleration in TFPG in MTE industry during the post-reform period. In contrast, Haryana has witnessed acceleration in TFPG in MTE industry. Karnataka and Tamil Nadu did not witness either acceleration or deceleration in TFPG of MTE industry. Gujarat also did not witness acceleration in TFPG. In fact it witnessed deceleration in TFPG, if we include the year 1991-92 in the post-reform period.
Textiles industry is one of the major contributors to employment in manufacturing sector. TFPG has been rather low and has also decelerated in this industry (See Table 5.8) during the post-reform period, similar to what has happened to FBT industry. Tamil Nadu, Maharashtra, Gujarat, Punjab and Rajasthan have been the leading states in textiles industry. Except for Rajasthan, TFPG in each of these states has been lower as compared to that witnessed for the country as a whole. Moreover, all these states including Rajasthan have witnessed deceleration in TFPG during the post-reform period. 5.1.2 Growth Accounting Estimates of TFPG: Time-Path and Volatility We now discuss the time paths of TFP indices, as these enable us to observe the TFPG movements across states and industries in a less rigid framework than in the framework of pre and post-reform period. In Figures 5.3 to 5.17, we present the annual time-path of TFP indices for the 15 selected states of India32. The thin black smoothened curve is the fitted trend (of polynomials of not more than 4th order) for the TFP indices. It can be seen from these Figures that in most of the states (barring Kerala, MP* and Rajasthan, wherein trend growth rate of TFP seems to be constant over the entire span of the study), the curvature of the trend curve is sharper in the post-nineties than during the nineties which is indicative of the fact that the TFP has been rising at a higher rate during the recent years as compared with that witnessed during the decade of the nineties.
In Table 5.9A, we provide the average of annual growth rates of TFP for the various time-periods and also the coefficient of variation (CV) as a measure of volatility of TFPG for the various industries.
It can be seen from Table 5.9A that except for metal industry, all the component industries, as well as the manufacturing sector have witnessed a revival of TFPG in the present decade. This is a welcome feature of the Indian manufacturing sector, though much more is needed in terms of its overall performance. As can be seen from Table 5.9, FBT and TEX are the industries with maximum fluctuations in TFPG, besides being the lowest TFPG performers. A perusal of Table 5.9B also indicates the revival of TFPG during 2000-01 to 2003-04 for all India as well as for most of the states barring Bihar*, MP*, Orissa and Rajasthan. 5.1.3 Production Function Estimates of TFP and TFPG: 1980-81 to 2003-04 We have also used the Cobb-Douglas (CD) production function approach for measurement of TFPG and the inter-state differences in TFP levels and growth rates (see section 4.2.1 for methodological details). These results have been presented in Tables 5.10 to 5.16. The empirical results pertaining to contribution of inputs (L, K and N), productivity (captured by the coefficient of time variable), inter-state differences in TFP levels and TFPG have been provided in these tables. The estimates of TFPG across states and the TFPG over the reform period are given in Table 5.17. The main observations that emerge from the scrutiny of Table 5.10 to 5.17 are as follows:
For MTE industry, it is negative, but statistically significant at 12 per cent level. In other words, the TFPG performance of various industries has varied across the policy regimes.
In Tables 5.18A and 5.18B, we provide the summary of empirical results obtained for the organised manufacturing sector based on the ASI industry-state level data. In the former table, we provide ranks of the various states for both TFP and TFPG. TFPG ranks are derived by applying the two alternative methodologies, viz., PFA and GAA. In the latter Table (5.18B), we highlight the consistency or otherwise of the TFPG ranks of three best/worst states. The states highlighted in blue color are the states in which an industry contributes significantly to the output of organised manufacturing of the respective state. Thus, mainly it is the consistency/ inconsistency of TFPG ranks for these states that is of prime concern to us. Gujarat emerges as the best performer according to the PFA and worst performer according to GAA. As mentioned earlier, leather industry constitutes a rather insignificant proportion of the total organised manufacturing. The ranking of UP* (for leather industry) which is one of the three major states that specializes in leather industry also gets inconsistent ranking with the two alternative methodologies. However, for most of the states, the ranking of best performing and worst performing states in major states seems to be consistent, as can be seen from Table 5.18B. 5.2 ASI Unit Level Data: 1993-94 to 2003-04 As mentioned in section 4 of this study, ASI has also been providing unit level data, since 1993-94 (barring 1995-96). Unfortunately, we are unable to compile a panel data set from this database. This is partly due to the fact that the ASI does not provide the identification codes for the census sector. For the sample sector, in any case it cannot be done. In view of this, we have estimated year-wise mean efficiency scores of the units belonging to the six industry groups. These estimates have been presented in Table 5.19A and 5.19B. We have used SFPF both CD and TL specifications. The methodology has been outlined in Section 4.2.2 for estimating the mean efficiency levels for the ASI unit level dataset, for each of the years spanning from 1993-94 to 2003-04 (barring 1995-96). These estimates reveal that though in most of the years, a majority of firms were operating close to the frontier (since the mean efficiency score is very close to unity), in 1994-95 FBT and LEATH industries show inefficiencies with CD specification, but only FBT shows inefficiency with TL specifications. In 1996-97 all industry groups indicate efficiency levels ranging between 0.44 and 0.59 with CD specification and between 0.49 and 0.88 with translog specification. In 2002-03 and 2003-04, FBT industry displays inefficiency levels ranging from 10 to 16 percent. It can also be seen that TFP indices obtained by growth accounting estimates at industry levels (Figure 5.2) in these years are rather low as compared to those in observed for other years. However, we are not very comfortable with these estimates for two reasons: (i) the data base is too large and the detection of outliers is a difficult proposition; and, (ii) we believe that there is problem in measurement of input, particularly that of capital. In view of this, we can treat these results as rather tentative. However, these results can be treated as indicators of problems associated with the database. 5.3 Technical Efficiency and Productivity for Public Limited (Non- Government) Manufacturing Companies: 1993-94 to 2004-05 We have also used Public Limited (Non-Government non-financial) Manufacturing Companies database that is compiled by the Reserve Bank of India. This database spans over the period 1993-94 to 2004-05. For this database, we could construct a balanced panel dataset and have applied the Data Envelopment Approach (DEA) outlined in Section 4.2.3 in order to estimate the mean levels of technical efficiency and the scale efficiency. Besides, we have estimated TFPG with the help of Malmquist productivity index. These calculations have been done by using DEAP33. The sample firms in leather and tobacco industries were too few in number and hence, we could not include these industries in analysis conducted in this section. The analysis is not carried out at state level due to the small number of companies in the sample. 5.3.1 Industry-wise Technical Efficiency using DEA (Multi-Stage): 1993-94 to 2004-05 It can be seen from Figure 5.18 that scale efficiency (SE) is very close to unity and hence, the assumption of constant returns to scale (CRS) for the manufacturing sector as such seems to be justified. Technical efficiency (TE) has ranged between 0.69 and 0.75 (under the assumption of CRS). In Figure 5.19, we present the technical efficiency scores of the five selected industries under both CRS (TECRS) and VRS (TEVRS) assumptions. It can be seen that with the CRS assumption, the efficiency of food and beverages (FB) industry is the lowest and that of metal industry is the highest.
Yearly movements in technical efficiency for various industries are given in Tables 5.20 to 5.25.
5.3.2 Total Factor Productivity Growth (Measured Using the Malmquist Index) In Table 5.26, we present the TFPG across industries using the Malmquist Index. It can be seen from Table 5.26 that the average TFPG of manufacturing sector is about 1.50 pcpa for the entire period. TFPG of Food and Beverages is lowest followed by the TEX industry. MTE and METAL industries have recorded the highest TFPG which is almost double of that for the CHEM industry. The empirical results of estimates of efficiency obtained by application of various methodologies which have been applied to the RBI dataset on Public Ltd. Companies belonging to the manufacturing sector have been compared in Table 5.27. The empirical results of efficiency estimates derived from DEA, SFPF (both Cobb-Douglas and Translog specifications) and productivity estimates derived by using Malmquist Index indicate that the efficiency and productivity of Food and Beverages industry is the lowest. The latter two approaches also indicate that the next worst performer is the TEX industry. According to SFPF estimates, CHEM industry is the best performer in terms of efficiency. As per the Malmquist index, MTE and METAL industries are the best performers as regards TFPG. 5.4 Labour Productivity: A Comparison of Organised and Unorganised Sector The NSSO has been conducting enterprises surveys relating to various activities in its periodical rounds. The enterprises surveys on unorganised manufacturing sector were introduced since 33rd round of NSS (1978-79). Thereafter, the unorganised manufacturing sector has been covered in the 40th, 45th, 51st, 56th and 62nd rounds and the consolidated results were published by the NSSO accordingly. We have obtained the unit level raw data for 45th, 51st and 56th rounds from the NSSO, which were processed at our end. These unit level data were compiled state-wise and industry-wise for the estimation of labour productivity. The industrial classification used for unit level data in the ASI dataset has been adopted for this analysis. We now present the levels of labour productivity in organised and unorganised manufacturing sectors in Table 5.28. From Table 5.28, we can see that labour productivity in both organised and unorganised sector has increased over time. Labour productivity in various organised manufacturing industries ranged between 1.6 to 2.2 times in 2000-01 as compared to the respective figures in 1989-90. This range for the unorganised sector was 1.7 to 2.8 times. However the disparity in the levels of labour productivity between organised and unorganised sectors are rather sharp and have perpetuated. Organised manufacturing sector had labour productivity which was 13 times, 14 times and 15 times higher than its unorganised counterpart in years 1989-90, 1994-95 and 2000- 01, respectively.
6. Performance of Manufacturing Sector in India: Output, Employment and Productivity Growth The earlier sections of this study have provided estimates of productivity and efficiency for the various datasets. In this section, we take an overall view of the performance of India’s manufacturing sector, as productivity growth ought to be combined with growing output and employment for it to make a positive impact on the standard of living of people. 6.1. Organised Manufacturing Sector The performance of a state/industry needs to viewed in various dimensions, such as, growth of output (Og), growth of employment (Lg), the level of TFP and the growth of TFPG. In this section, we try to take a holistic view of each state/industry as regards these criteria. We first discuss the levels of TFP and productivity growth rates along with the employment growth rates. Needless to mention that we will focus on the performance of states in which a particular industry has some presence (see section 5.1.2 and Table 5.18B). Annexures 6.1A, 6.1B, 6.2A and 6.2B provide the trend growth rates of output and employment. In Figure 6.1A, we provide the trend rates of growth of employment (Lg) and productivity TFPG (obtained with GAA and PFA methodologies, TFPG (GAA) and TFPG (PFA), respectively) for the organised manufacturing sector for the period 1980-81 to 2003-04. In Figure 6.1B and 6.1C, TFPG (GAA) estimates for the pre-reform and post-reform periods (classification 2, in which post-reform period starts from 1992-93 onwards) along with Og and Lg have also been provided. 6.1.1 State-wise Analysis of Performance of Organised Manufacturing Sector In Chapter 5 we have seen that MAH, TN and WB emerge as the best performers in terms of TFP levels in the manufacturing sector. Out of these, TN and WB feature in the list of worst performers in terms of TFPG. The worst performers in terms of TFP levels are ORI, DEL and RAJ. Out of these, RAJ is one of the states with best performance in terms of TFPG. Thus, one can say that convergence of TFP is working favorably for RAJ and adversely for TN and WB. HAR, KAR, RAJ, AP and MP* are the states that have done well in terms of output growth, employment growth as well as in terms of TFPG34. BIH* and WB have performed very poorly in terms of growth of output and there have been severe job losses in these states. In the case of these states, productivity performance (as obtained from GAA) gets inflated due to job losses. Hence, these cases need to be interpreted with utmost caution, as this is not the desirable situation from a developmental perspective. MAH tops in the list of states in terms of TFP levels. However, over the years, its position has been deteriorating, as it features in the list of states in which output growth and employment growth has been lower than those witnessed at all India level. In the case of Maharashtra, the TFPG measured with GAA is much lower than that measured by the PFA (Table 6.1, Figure 6.1A). As against it, TFPG for Bihar* is negative if measured by PFA and highest, if measured by GAA. It appears that the estimates of TFPG obtained by the two methodologies differ for states demonstrating the polar situations. For the organised MFG, TFPG measured by GAA is lower and almost half of that measured by the PFA approach. In brief, TFPG estimates are sensitive to the application of alternative methodologies. Bihar* and West Bengal are the states with the lowest rate of growth of output and also with falling employment levels. UP* too witnessed fall in employment, but it growth rate has been fairly comparable to the national average. Haryana, which demonstrated highest rate of growth of output, yields a rather low TFPG as measured by PFA. Though the estimates of TFPG obtained by GAA seem to be convincing, as low growth rate of output coupled with fall in employment can give inflated estimates of TFPG, the estimates obtained by PFA seem to be helpful in the consistency check. The estimates of contribution of productivity growth to growth of output of manufacturing sector range from about 13 to 25 per cent, as a result of application of alternative methodologies.
It can be seen from Figure 6.1B and Figure 6.1C, GUJ, HAR, KAR, KER and WB witnessed increase in growth rates of output during the postreform period. However, WB saw increase in output growth from an extremely low rate that it witnessed during the pre-reform period. It had witnessed the lowest growth rate of output among all the states. Rest of the states witnessed either lower or same growth rates of output during the postreform period. In other words, though the second bout of reforms in the nineties did not result in acceleration of growth of output of the manufacturing sector for India as a whole, it did accelerate growth rates of output of states like GUJ, HAR, KAR and KER. Besides these states, all other states witnessed either stagnant employment or deceleration in employment. Except for HAR, no other state witnessed acceleration in TFPG (GAA). AP, MP*, ORI, RAJ and WB did not see any acceleration/deceleration in TFPG (GAA), whereas, all the remaining states witnessed deceleration in TFPG (GAA) during the post-reforms period. However, there is an improvement of productivity growth at the aggregate level during 2000-04 period. Policy reforms may delay end results for a number of reasons like economic/political uncertainties, external crisis, etc., Understanably, the better placed states such as Gujarat would reap the benifits earlier than the backward states. Of late, many backward states are growing at a higher rate.
6.1.2: Industry-wise Analysis of Performance of Manufacturing Sector In Table 6.2, we provide a synoptic view of the Industry-wise performance of India’s manufacturing during 1980-81 to 2003-04. It can be seen from this Table that the industries that pulled up the growth rate of output of manufacturing sector were primarily, CHEM and MTE industries. Though leather industry recorded the highest growth rate of output, it has rather low weightage in the manufacturing output. FBT, TEX and METAL recorded lowest rates of growth of output and of these, FBT witnessed falling employment and TEX witnessed the lowest rate of growth of employment. TFPG measured by GAA is negative for the former. For the latter it is positive, but lowest among the remaining industries. Similar positioning of these industries can be seen in terms of the contribution of TFPG (GAA) to growth of output (Og). The estimates of TFPG from PFA seem to be rather high for TEX industry and hence also its contribution to growth of output is the highest across industries. A cross-check provided to the above results is from the empirical analysis of efficiency estimates obtained for the private limited manufacturing companies carried out in Chapter 5. The mean efficiency estimates of Food and Beverages industry obtained by both Cobb-Douglas specification and Translog specifications of SFPF and also the TFPG obtained by using Malmquist index (see Table 5.27) are the lowest across industries. In view of this, there seems to be confirmation of the fact that this industry is the worst performing industry as regards both TFPG and also in terms of growth of employment generation. 6.2 Unorganised versus Organised Manufacturing Sector Given the problem of compilation of capital stock for the unorganised manufacturing sector, we do not overambitiously estimate TFPG, but have rather confined ourselves to examining the broad trends in labour productivity, as is also done by Goldar et al (forthcoming). In this section we provide a comparison of findings of our results which are based on the unit level data for unorganised manufacturing sector with those of Goldar et al (forthcoming), which also includes the 2005-06 data for unorganised manufacturing sector and 2004-05 data for organised manufacturing. One of the differences in estimation of labour productivity between our study and that of Goldar et al (forthcoming) is that the latter uses RVASD as a proxy for output. We have already noted in section 5.4 of this study that labour productivity in both organised and unorganised sector has increased over time. Labour productivity in various industries of organised manufacturing sector ranged between 1.6 to 2.2 times in 2000-01 as compared to that in 1989-90. The respective range for the unorganised sector was 1.7 to 2.8 times. In other words, as regards growth of labour productivity in the unorganised sector, it has increased more or less in tandem with that in the organised sector. However, the disparity in the level of labour productivity between the organised and unorganised sectors seems to have somewhat widened in 2000-01. As indicated earlier, the ratio of labour productivity of various industries in organised manufacturing sector to their counterparts in unorganised manufacturing sector ranged between 6.9 to 13.5 times in 1989-90 and this range widened to 7.5 to 14.8 in 2000-01. Figure 6.2A, 6.2B and 6.2C provide a comparison between unorganised and organised sectors during the period 1989-90 to 2004- 05/2005-06 (organised/unorganised) manufactuing sector.
As regards textiles and leather, metal products and machinery and equipments, real value added in unorganised sector has increased faster than in the organised manufacturing sector (Figure 6.2A). In all other industries, real value added has grown at a faster rate in the organised sector. However, at aggregate level, the real value added has increased at a slower rate in unorganised manufacturing sector (4.0 pcpa) vis-à-vis organised manufacuring sector (7.1 pcpa). As regards the employment growth in organised and unorganised sector, we observe that it has been higher in the former than in the latter (Figure 6.2B). However, this is not true across industries. Textiles and leather, paper, basic metals and transport equipment industries witnessed highter growth rates of employment as compared to the organised sector. In most of the remaining industries, organised manufacturing performs better than the unorganised sector. As regards labour productivity growth rate, organised manufacturing sector faired better than unorganised sector, as can be seen from (Figure 6.2C). Again, in Textiles and leather, non-metallic mineral products, metal products and machinery and equipments industries, labour productivity growth has been higher in the unorganised manufacturing sector than in the organised manufacturing sector. In other sectors, the performance of organised sector has been better. Our findings about the ranking of the industries according to labour productivity growth rates also broadly coincide with that of Goldar et al (forthcoming).
6.3: Determinants of TFPG in the Organised Manufacturing Sector In this section, we have used the estimates of productivity growth obtained from GAA35 and tried to relate them to some of the determinants of TFPG as discussed in the literature review in Section 3. These are: tariff liberalization, export orientation, investment, availability of infrastructure constraint (proxied by growth rate of electricity consumption) and agricultural growth (demand). The time-path of these variables has been shown in Figures 6.3A to 6.3D. We also regress TFPG on its various determinants so as to take an overall view of the same.
As can be seen from Figure 6.3A, TFPG (GAA) witnessed large fluctuations with steep decline until the mid-eighties and thereafter reversed. During this period, the protectionism as measured by tariff barriers (TB), ratio of import duties to import payments (in percentage terms) was on the rise, almost until 1987-88. Thereafter, there has been consistent decline in protectionism, but the TFPG has risen since the end of the nineties. Thus, if we view the entire span of the study, trade barriers do not seem to be a determinant of TFPG. It is, therefore, not surprising that the various studies come up with different conclusions regarding impact of trade reforms on productivity, depending on the time-period under consideration. Investment adds to capital stock and various studies, including Utchikawa (2006) have shown that during the periods of high investment, there is lower capacity utilisation. Though higher investment may be beneficial for higher growth, its does not get reflected in higher TFPG due to lower capacity utilisation. Also the concern of Krugman (2004) and Young (1995) that increasing investment may result in diminishing returns and hence intensification of capital may not lead to sustainable growth and TFPG, seems to be valid under the Indian context. In view of this, we examine the role of real capital formation on productivity in manufacturing sector (Figure 6.3B). We see that until the 1993-94, capital formation in manufacturing sector increased steadily and slowly. There was a spurt in the mid-nineties after which it stabilised and thereafter again wide fluctuations can be seen in capital formation. Though, we do not see any contemporaneous relationship between annual TFPG and capital formation in manufacturing sector, we have examined the effect of lagged investment on TFPG later in this section. Inadequate growth of infrastructure is often viewed as one of the main constraints on productivity growth. In view of this, we use the rate of growth of electricity conusmption as the proxy for availability of infrastrucutre. We also presume that the rate of growth of electricity used for manufacturing sector would be in the same direction as the use of electricity for all other purposes. In Figure 6.3C, we present the timepath of the TFPG and yearly growth rate of electricity consumption (ECg). From this Figure, it is difficult to infer that higher (lower) growth rate of electricity consumption is associated with higher (lower) TFPG of organised manufacturing sector.
One of the determinants of TFPG is said to be the demand factor. Earlier studies, such as, Ahluwalia (1991) have examined the agricultural growth constraint on the manufacturing sector. The logic underlying this argument is that unless the agriculutral sector feeds raw material inputs to the manufacturing sector and absorbs the output of manufacturing sector both in terms of intermediate products and final consumer goods. Low rate of growth of agriculture can cause unutilised capacities in manufacturing sector and will have a negative impact on TFPG of the manufacturing sector. Moreover, since agriculture employs a large proportion of working force, unless the growth rate of agricultural sector improves, it will not be possible to have a sizeable positive impact on demand for manufacturing goods. In view of this the growth of agricultural sector or generation of purchasing power in agricultural sector could hold the key to increase in TFPG of manufacturing sector. However, it is also possible to argue that it is not the proportion of population in agriculture, but the income generated in agricultural sector, that is consequential to demand and in boosting growth of manufacturing sector. In view of the fact that agricultural sector’s share in national income has declined over the years, manufacturing sector is more likely to find its buyers from services and manufacturing sectors rather than from agricultural sector.
In Figure 6.3D, we present the time-path of agricultural growth rate (Ag) and that of TFPG in organised manufacturing sector. Here as well, a discernible correlation between the two variable seems to be elusive. It is very often hypothesised that increasing compulsions to compete in the global market could provide an impetus to improvement in productivity. In view of this, one may find a positive correlation between exports growth (EXg) and TFPG. Given the predominance of manufactured exports in India’s merchandise exports, we provide a synoptic view of the relationship between TFPG and EXg (measured as per cent change over the previous year in exports in million US $) in Figure 6.3E.
In order to examine the impact of above-mentioned factors on TFPG, we have regressed the annual TFPG of the organised manufacturing sector on growth rate of agriculture (Ag), growth rate of electricity consumption (ECg). Trade Barriers (TB), rate of growth of exports (EXg) and real gross capital formation (RGCF,t-t3, average of current and the previous three years, so as to allow for gestation period). We also attempted several combinations of the explanatory variables and we report the empirical estimates of the best regression equation (with robust standard errors) in Table 6.3. It can be seen from Table 6.3 that TFPG of manufacturing sector is negatively related to the trade barriers which implies that declining trade barriers have had a positive impact on TFPG. The coefficient of RGCF,t-t3 is negative and statistically significant. The impact of investment is rather difficult to model due to the problem of identification of appropriate lags. As regards the growth of agricultural income (Ag), it does not emerge as a significant explanatory variable for TFPG of organised manufacturing sector. This should not be interpreted as though it does not matter for the growth of total manufacturing sector. It may be kept in mind that due to data limitations, we have excluded unorganised manufacturing sector from the analysis on determinants of TFPG. Moreover, even if Ag is not very crucial for increasing TFPG of manufacturing sector, its role in providing demand for manufacturing sector cannot be denied, as it holds the key to growth with equity. As regards electricity consumption growth and its relationship with TFPG, we find that it is highly correlated with the real gross capital formation and hence, we retained the RGCF, t-t3 variable and dropped ECg in the final regression result. 6.4: Competitiveness and Productivity: An Inter-State Perspective The recent data on the components of competitiveness that are available state-wise have been reported in Table 6.4. Competitiveness of a state is suppose to depend upon the various characteristics, such as, Factor conditions (FC), Demand conditions (DC), Strategic context (SC), Supporting conditions (SP) and their components. We use the overall score for the state and try to examine if there is any systematic relationship between the competitiveness of a state and the productivity of its organised manufacturing sector. In Table 6.5 we provide an overview of the empirical results of TFPG, Competitivenss Scores (CS) and the various charactersitics of states identified in the literature, including the investment climate (IC) rank and category.
It can be seen from Table 6.5 that Maharashtra and Tamil Nadu top the list of CS and Bihar is at the bottom of this list. This correlates better with the TFPG obtained by PFA approach rather than by GAA approach. Maharashtra and TN are coastal state with best and good investment climate, respectively and Bihar* is a land-locked state. Maharashtra and TN had a worker friendly environment. Correlation between competitivenss score and TFPG obtained by PFA is about 0.55. The correlation between TFPG obtained by the GAA and competitivness score is about -0.73. In other words, we could not find a neat relationship between competitivenss scores of states and TFPG, as the latter themselves are sensitive to the methodology used in its estimation. 6.5 Conclusions and Implications for Policy The study notes that the estimates of productivity are sensitive to the methodology used, even if the dataset used reamains the same. In view of this, the alternative methodologies can provide the range within which the estimates of productivity could be expected to lie. In this study, we obtained the range of TFPG (1980-81 to 2003-04) for organised manufacturing sector as a whole, between 0.92 and 1.81 pcpa, from GAA and PFA methods respectively, yielding the contribution of TFPG to output growth ranging from about 13 per cent to 25 per cent. We also note that it is not only the TFPG differentials across states that are starking, but also growth performance of states have been quite varied. State like Bihar* and West Bengal have shown very poor performance in terms of both growth of output and employment in the organised maufacturing sector. Given the fact that economically poorer states have a larger proportion of unorganised labour in their manufacturing sector and that the labor productivity in the unorganised manufactuing sector in 2000-01 was about 1/14th of that in the organised manufacturing sector, regionally balanced development is the need of the hour. This is particularly needed for manufacturing sector, as it can generate employment for skilled, semi-skilled and non-skilled workers. As regards industries, FBT and Textiles industries have displayed a poorer performance in terms of growth, productivity and also employment generation. The major problems faced by the agro-processing units are36: (a) low capacity utilisation; (b) poor recovery of the finished product from the raw materials; (c) problems of inadequate working capital and its management; (d) low product quality; and, (e) unreliable assured power supply. The Ministry of Food Processing Industries, Government of India 37 is also aware of the problems facing this sector, which are identified as follows: (i) poor infrastructure in terms of cold storage, warehousing, etc.; (ii) inadequate quality control and testing infrastructure; (iii) inefficient supply chain and involvement of middlemen; (iv) high transportation and inventory carrying cost; (v) affordability, cultural and regional preference of fresh food; (vi) high taxation; and, (vii) high packaging cost. As regards the bottlenecks to better performance of textiles industry identified38 are: i) structural weaknesses in weaving and processing; ii) fragmented and technologically backward textile processing sector; iii) fragmented garment industry; iv) rigid labour laws; v) inadequate capacity of the domestic textile machinery manufacturing sector; vi) inadequate training facilities in textile sector; and, vii) infrastructural bottlenecks in terms of power, utility, road transport, etc. The problems confronted by the Chemical industry in India are39: (a) high prices of basic feed stock; (b) SSI reservation/fragmented nature of industry; (c) low R&D levels; (d) low level of infrastructure; (e) low level of ICT interface; (f) environmental regulations; (g) low level of brand development; and (h) dumping/import competition. As against these industries, metal industry has performed rather well. Some of the reasons for this are that in the post-reform period, this industry seems to have benefitted due to the backward linkages it has with other industries/sectors. Booming automobile industry in India has provided the metal industry the demand linkage and growing interest of global players in automobile industry is also related to the better performance of metal industry. Besides this, the growth of infrastructure and construction sector in India in the recent years seemed to have provided the metal industry the much needed impetus for its growth. Privatization and globalization of metal industry also seems to be related to its better performance in the post-reform era. As regards the TFPG in the organised manufacturing is concerned, we do find the post-reform period has witnessed deceleration in TFPG in all the industries (except metal) in many states. However, the post 1990s decade does present evidence of rising TFP indices and revival of TFPG, except metal industry. Hashim et al (2009) interprete it as an evidence of ‘J-curve’ effect’ of the reforms. We also wish to state that though TFPG has not increased during the post-reform period, it does not mean that reforms have caused this. Certainly, the dynamics of the global and domestic markets have played a crucial role in influencing the industry and regional performance. We also have demonstrated with empirical evidence that some of the components of policy reforms, such as, reduction in trade barriers have led to improvement in productivity growth. Further,we cannot rule out the impact of other determinants of TFPG at industry and state levels even if we are unable to link them at aggregate levels. Though reforms may have provided the broad liberalised policy framework, the reforms dealing with micro-foundations for each industry are yet to be formulated and implemented. Regarding the sustainability of growth of manufacturing sector, two factors seem to be the causes for concern. First is the high resource intensity mantufacturing sector and the second is the intra-sectoral disparity, between organised and unorganised segments of the manufacturing sector, that seems to be getting more widened. On the whole, it is the supply constraint, in the form of technological upgradation, organisational and institutional constraints that seems to be the problem with the Indian manufacturing sector rather than the demand constraint emanating from low growth of agricultural sector, especially for organised manufacturing sector. Atomistic markets, such as, food industry, leather, chemical and textiles are in need of institutional mechanisms, which will provide them with key inputs including technology for their improved performance. As regards the empirical evidence emerging from the use of micro level data, we would like to exercise much caution in interpretation of the results emanating from the ASI unit level data, due to the problems associated with compilation of series on capital stock for each of these units. The empirical results, therefore, need to be interpreted with much caution in light of data and methodlogical limitations. However, the RBI company level data provides us with rather convincing results. The mean efficiency levels estimated by SFPF display more variation across industries as compared to those computed by using the DEA. Food & Beverages and Textiles industry show the maximum inefficiency which is also corroborated with the TFPG estimates obtained by the growth accounting estimates for the organised segment of this industry and also measured by the Malmquist index. These are the industries where unorganised sector predominates in terms of employment. Thus, if the welfare of the masses is to be improved, it is necessary to make these industries globally competitive and this may also take care of the unbalanced regional development of the states.
Annexure 4.3: Estimation of Capital Stock Series for ASI Industry-State Level Data The measurement of capital stock has been a controversial issue both in theoretical and in empirical literature. There is no universally accepted method for its measurement and several methodologies are used in estimation of capital stock. We have used the Perpetual Inventory Accumulation Method (PIAM) for generating the series on capital stock. The PIAM requires the estimates of capital stock for a benchmark year and investment in the subsequent years. This method has been followed by other researchers as well ((Ahluwalia [1991] and Balakrishnan and Pushpangadan [1994]) The time-series on capital stock at current prices has been generated by using equations (A.1). Notations used in these equations are as follows. I is the net fixed capital formation. K is the stock of capital at current prices. Subscript‘t’ has been used to denote time. Data on fixed capital stock available in ASI is the historical data on book value and it is inappropriate to use this data as it does not reflect the replacement cost. In order to circumvent this problem, we have used the data on capital stock for 1980-81 (from CSO, 1990). The proportion of capital stock for each state has been obtained from the ASI fixed capital and then these proportions have been applied to the CSO data on capital stock. The assumption of proportionality was further extended for apportioning the state level capital stock estimates to the industry level capital stock. Though we recognise that this involves the assumption of proportionality which is not easy to check with the reality, any other method of constructing capital stock series at disaggregated industry levels for each state would have also involved some rules of thumb in the absence of appropriate data. Capital stock for each of the industry in the subsequent years has been arrived at by adding the net fixed capital formation figures to the stock of capital of the previous year (using equation A4.1). In a few cases, such as metal industry in Andhra Pradesh, leather industry in Gujarat and Rajasthan, we had to use gross fixed capital formation/gross capital formation, as the data on negative figures on net fixed capital formation were so high that even after adding them to the stock of capital of the previous years, these yielded negative signs for the stock of capital. As it is not possible to obtain the logarithm of negative numbers, we could not use the data on net fixed capital formation in these cases and hence, gross investment figures have been used only for the above-mentioned cases. The stock of nominal capital series so obtained has then been deflated by the investment deflator series. Investment deflator series has been obtained by deflating the series on gross capital formation at current prices by the gross capital formation at 1993-94 prices which is published by the CSO. The base of this series has then been shifted arithmetically to 1981-82. This was to retain the consistency of a single base year for all the price indices. Annexure 4.4: RBI Data on Company Finances The disaggregated annual data is culled out from the audited annual accounts of non-Government non-financial public limited companies by the Reserve Bank of India to study the finances of these companies form the base data. For the purpose of this study, data on companies engaged in manufacturing activity have been selected. A balanced panel data of 449 companies for 12 years period starting from 1993-94 to 2004-05 have been taken for the purpose of the present study. To have comparable data for all the years, the data on companies, which have undergone mergers and acquisitions during the period under study have been excluded from the sample. Six industries are selected for the purpose of the industry-wise study. A company is classified into a particular industry, if it has earned more than 51 per cent income from that particular activity in 2004-05. The industries (with number of companies) selected for the purpose of the industry-wise study are Machinery and transport equipments (116 companies), Chemicals and chemical products (78 companies), Food and Beverages (60 companies), Textiles and textile products (53 companies) and Metals and metal products (47 companies). Variables used Inputs: The input cost is measured as the material input (including raw material and components consumed, stores and spares consumed, power and fuel and other manufacturing expenses) and the cost of non-industrial services (like royalty, technical know-how, selling commission, small repairing work of buildings and machinery, advertisement expenses, insurance expenses, auditor’s remuneration and other expenses). However, the cost of machinery (i.e., depreciation provision), cost of borrowing (i.e., interest payments), dividend payments, rent and tax payments have been excluded. Indices for inputs specific to selected industry were derived using the input-output table for the purpose of calculating real input. Output: Output is measured as the value of the output of the industry during the year. For calculating real output, WPI indices (Base 1993-94 = 100) were used for the specific industries. Labour Cost (Wages): Wages comprises remuneration paid to the employees in the form of salaries/ wages, bonus, provident fund, employees’ welfare expenses and managerial remunerations. Number of employees: The number of employees is estimated using the ASI data. The per capita remuneration in each industry was derived from the ASI data and applied to this dataset for want of any other better proxy for the same. Capital Stock (at replacement cost) in the base year: It may be noted that the capital stock reported in the annual accounts are generally at book value at historic costs. While there may be cases where the capital stocks are reported in the books after proper valuation, not all the assets are re-valued by the companies in each year. Thus, base year capital stock needs to be adjusted to get it at the replacement cost. We have adopted the method given by Srivastava (2000). It is assumed that no firm has any capital in the base year (1993-94) of the vintage earlier than 1980-81. For companies incorporated after 1980- 81, it is assumed that the earliest vintage of capital in their capital mix dates to the year of incorporation. Further, it is assumed that the price of capital has changed at a constant rate and the investment has increased at a constant rate for all companies from 1980-81 or the date of incorporation of the firm (whichever is later) up to 1993-94 (initial year in the study). National Accounts data series on gross fixed capital formation at current prices and at constant prices (Base year 1999-2000) are used for calculating this constant rate of growth in prices and investments. The annual growth rates of prices are obtained from the price deflators for gross fixed capital formation and the annual growth rates for investment are obtained from the gross fixed capital formation at constant prices series. The constant rate of growth is calculated as the averages of annual growth rates for the period 1980-81 to 1993-94 for companies having year of incorporation 1980 or before. For companies incorporated after 1980-81, the average growth rate from the year of incorporation to 1993-94 are used as the constant growth rate for all such companies. If average annual growth in investment and prices for a firm are denoted by GI and GPR, then the capital stock in the base year at replacement cost is calculated as [((1+GI)*(1+GPR)-1)/ (GI*(1+GPR))]*[Capital stock at book value at historic cost]. Average Depreciation Rate: The average depreciation rate (DELTA) has been calculated separately for each of the selected industry using the information contained in the data. It is assumed that all firm’s capital stock has useful life (Lt) at the time t, companies use straight line depreciation and depreciation rate is 2/Lt (Salinger and Summers, 1981). The useful life Lt at time t is calculated as (Total gross fixed asset (stock) at time t)/ (Accumulated Depreciation up to time t – Accumulated depreciation till time t-1). As our data starts from 1993-94 onwards, useful life of gross fixed assets (stock) was obtained for the period from 1994-95 to 2004-05. The arithmetic average of Lt (for t from 1994-95 to 2004-05) (say L) was used to calculate the average depreciation rate DELTA (=2/L). It is assumed that this depreciation rate was same for all the companies in the industry and it remained constant for the whole period under study. Gross Fixed Capital Formation: The gross fixed capital formation in a particular year is calculated as the increase in capital stock during the year at book value, adjusted for revaluation/ devaluation of asset during the year, if any. Capital Stock in the current year (subsequent to base year) is obtained as [(Capital stock in the previous year)*(1-DELTA)*(Change in the price during the year) + (Gross Fixed Capital Formation during the year)]. Annexure 4.5: Decomposition of Malmquist Index of Productivity Change
Aghion, Philippe, Robin Burgess, Stephen Redding and Fabrizio Zilibotti (2005), ‘The Unequal Effects of Liberalization: Evidence from Dismantling the License Raj in India’, available at http:// www.economics.harvard.edu/faculty/aghion/files/Unequal_ Effects.pdf. Ahluwalia, I. J. (1991), Productivity and Growth in Indian Manufacturing, Oxford University Press, Delhi. Ahluwalia, I.J. (1994), “TFPG in Manufacturing Industry”, Economic and Political Weekly, Vol. 29, p. 2836. Ahluwalia, Montek, S. [2000], “Economic Performance of States in Post- Reforms Period”, Economic and Political Weekly, Vol 35,No. 19, pp. 1637-48. Balakrishnan, P and K Pushpangadan (1998), “What Do We Know about Productivity Growth in Indian Industry”, Economic and Political Weekly, 33:2241-46. Balakrishnan, P and M Suresh Babu (2003): “Growth and Distribution in Indian Industry in the Nineties”, Economic and Political Weekly, 38: 3679-82. Balakrishnan, P, K Pushpangadan and M Suresh Babu (2000), “Trade Liberalisation and Productivity Growth in Manufacturing: Evidence from Firm-Level Panel Data”, Economic and Political Weekly, 35(41): 3679-82. Balakrishnan, P. and K. Pushpangadan (1994), “Total Factor Productivity Growth in Manufacturing Industry: A Fresh Look” Economic and Political Weekly, Vol. 29, pp.2028-35. Balakrishnan, P. and K. Pushpangadan (1995), “Total Factor Productivity Growth in Manufacturing Industry” Economic and Political Weekly, Vol.30. Banga, Rashmi and Bishwanath Goldar (2007), “Contribution of Services to Output Growth and Productivity in Indian Manufacturing: Pre- and Post-Reforms”, Economic and Political Weekly, pp 2769-77. Besley, Timothy J. and Robin Burgess (2002), “Can Labour Regulation Hinder Economic Performance? Evidence from India,” CEPR Discussion Papers 3260, Centre of Economic and Policy Research. Bhaumik, Sumon Kumar; Shubhashis Gangopadhyay and Shagun Krishnan, 2006, “Reforms, Entry and Productivity: Some Evidence from the Indian Manufacturing Sector,” IZA Discussion Papers 2086, Institute for the Study of Labor (IZA). Bosworth, Barry; Susan M. Collins and Arvind Virmani (2007), “Sources of Growth in the Indian Economy”, NBER Working Paper No. W12901, National Bureau of Economic Research. Brahmananda, P. R. (1982), Productivity in the Indian Economy: Rising Inputs for Falling Outputs, Himalaya Publishing House, Mumbai. Bruno, M. (1984), “Raw Materials, Profits, and the Productivity Slowdown” Quarterly Journal of Economics, Vol XCIX, pp. 1-29. China Statistical Yearbook (2009), National Bureau of Statistics of China, available on www.stats.gov.cn/english. Das, Deb Kusum (2003): “Manufacturing Productivity under Varying Trade Regimes: India in the 1980s and 1990s”, Working Paper, No. 107, Indian Council for Research on International Economic Relations, New Delhi. Dholakia, B. H. and R. H. Dholakia (1994), “Total Factor Productivity Growth in Indian Manufacturing”, Economic and Political Weekly, Vol.30, pp. 3342-44. Das, Dipika, Regional Variation of the Productivity Performance in Indian Manufacturing Industries (July 28, 2008). Available at SSRN: http:/ /ssrn.com/abstract=1263848 Export-Import Bank of India (2007), Indian Chemical Industry: A Sector Study, Occasional Paper, No. 117, Quest Publications, available at http://www.eximbankindia.com/op/op%20117% 20chemical % 20industry %20%5bfull%20report%5d.pdf Gangopdhyay, S. and W. Wadhwa (1998), “Economic Reforms and Labour”, Economic and Political Weekly, Vol. 33. Goldar, B.N. (1986), Productivity in Indian Industry, Allied Publishers Private Limited, New Delhi. Goldar, Bishwanath (2000), Productivity Growth in Indian Manufacturing in the 1980s and 1990s, paper presented at conference on Centre for Development Economics, Delhi School of Economics, ‘Industrialisation in a Reforming Economy: A Quantitative Assessment’, New Delhi, December 20-22. Goldar, Bishwanath (2002), “TFP Growth in the Indian Manufacturing in the 1980s”, Economic and Political Weekly, 37(49): 4966-68. Goldar, Bishwanath and Anita Kumari (2003), “Import Liberalisation and Productivity Growth in Indian Manufacturing Industries in the 1990s”, Developing Economies, December, 41(4): 436-60. Goldar, Bishwanath and Arup Mitra (2002): “Total Factor Productivity Growth in Indian Industry: A Review of Studies” in B S Minhas (ed), National Income Accounts and Data Systems, Oxford University Press, New Delhi. Government of India (2006), Report of the Working Group on Textiles & Jute Industry for the Eleventh Five Year Plan: (2007-2012), Ministry of Textiles, available at http://www.planningcommission.gov.in/ aboutus/committee/wrkgrp11/wg11_textiles.pdf Gupta, Abhay (2008), “Looking beyond the methods: Productivity Estimates and Growth Trends in Indian Manufacturing”, at http://mpra.ub.unimuenchen. de/14482/. Grilliches, Z (1994), “Productivity, Research and Development, and the Data Constraint”, American Economic Review, 84, 1-23. Hall, R (1988), “The Relation between Price and Marginal Cost in US Industry”, Journal of Political Economy, 96, 921-47. Hashim, D.A; Ajay Kumar and Arvind Virmani (2009), “Impact of Major Liberalisation on Productivity: the J Curve Hypthesis”, Working Paper No. 5/2009-DEA, Ministry of Finance, Government of India. Hulten, Charles and Sylvia Srinivasan (1999), “Indian Manufacturing Industry: Elephant or Tiger? New Evidence on the Asian Miracle”, NBER Working Paper, No. 7441. Iarossi, Giuseppe (2009), “The Investment Climate in 16 Indian States”, Policy Research Working Paper No. 4817, Africa Region, Finance and Private Sector Development Group The World Bank, Washington DC. International Labour Office (2005), World Employment Report: 2004-05, Employment, Productivity and Poverty Reduction, International Labour Office, Geneva. Jayadevan, C.M.(1996), “Inter-state Variations in Total Factor Productivity Growth Rates: A Case Study of Organised Industry in India”, Man & Development, Vol. , pp 97-108. Jeemol Unni, N. Lalitha and Uma Rani (2001) “Economic Reforms and Productivity in Indian Manufacturing”, Economic and Political Weekly, Vol. 36, No. 41, October 13-19. Kachru, R. P. (undated), Agro-Processing Industries in India- Growth, Status and Prospects http://agricoop.nic.in/ Farm%20Mech.%20PDF/05024-06.pdf Kathuria, V, Rajesh Ra,j S. N. and Kunal Sen (2010), “Organised versus Unorganised Manufacturing Performance in the Post-Reform Period”, Economic and Political Weekly, Vol. XLV, No. 24. Kochhar, Kalpana, Utsav Kumar, Raghuram Rajan, Arvind Subramanian, and Ioannis Tokatlidis, 2006, “India’s Pattern of Development: What Happened, What Follows?”, IMF Working Paper, No. WP/06/22, Research Department, International Monetary Fund, Washington DC. Kohli, Atul (2006), “Politics of Economic Growth in India, 1980-2005, Part I: The 1980s,” Economic and Political Weekly, pp. 1251-1259. Kohli, Atul (2006a), Politics of Economic Growth in India, 1980-2005, Part II: The 1990s and Beyond, Economic and Political Weekly, pp. 1361-1370. Krishna, K. L. (1987), ‘Industrial Growth and Productivity in India’ in P.R. Brahmananda and V.R. Panchmukhi (eds), The Development Process of the Indian Economy, Himalaya Publishing House, New Delhi. Krishna, Pravin, and Devashish Mitra (1998) “Trade Liberalization, Market Discipline and Productivity Growth: New Evidence from India,” Journal of Development Economics, 56, No. 2: 447–62 Krugman, Paul (1994), ‘The Myth of Asia’s Miracle’, Foreign Affairs, Vol 73, pp. 62-78. Kumar, Surender (2004) A Decomposition of Total Factor Productivity Growth: A Regional Analysis of Indian Industrial Manufacturing Growth, NIPFP Working paper No:22, available at http:// www.nipfp.org.in/working_paper/ wp04_nipfp_022.pdf Levinsohn, James and Amil Petrin (2003), Estimating Production Functions Using Inputs to Control for Unobservables, The Review of Economic Studies, Vol. 70, No. 2, pp. 317-341. Majumdar, Sumit K.(1996), “Fall and Rise of Productivity in Indian Industry”, Economic and Political Weekly, Vol. 31, pp. M46-M53. Mohan Rao, J. (1996), “Manufacturing Productivity Growth: Method and Measurement”, Economic and Political Weekly, November 2, 31:2927- 36. Mohan Rao, J. (1996a), “Indices of Industrial Productivity Growth: Disaggregation and Interpretation”, Economic and Political Weekly, Vol. 32, 7th Dec., pp. 3177-88. Mohanty, D. (1992), “Growth and Productivity in The Indian Economy”, Reserve Bank of India Occasional Papers, Vol 13, No.2, pp. 55-80. Mukherjee, K. and S.C. Ray (2004), “Technical Efficiency and Its Dynamics in Indian Manufacturing: An Inter-State Analysis”, Working Paper No.2004-18, Department of Economics Working Paper Series, University of Connecticut. Nadiri, M. Ishaq (1970), “Some Approaches to the Theory and Measurement of Total Factor Productivity: A Survey”, Journal of Economic Literature, Vol. VIII, pp. 1137-77. Olley, G. Steven and Ariel Pakes (1996), The Dynamics of Productivity in the Telecommunications Equipment Industry, Econometrica, Vol. 64, No. 6. pp. 1263-1297. Organisation for Economic Co-operation and Development (1996), Industry Productivity: International Comparison and Measurement Issues, OECD Proceedings, Paris. Organisation for Economic Co-operation and Development (2001): OECD Productivity Manual: A Guide to the Measurement of Industry-Level and Aggregate Productivity Growth, Statistics Directorate, Directorate for Science, Technology and Industry, OECD, Paris. Pradhan, G. and K. Barik (1998), “Fluctuating Total Factor Productivity: Evidence from Selected Polluting Industries”, Economic and Political Weekly, Vol. 33, pp M-25-30. Pradhan, G. and K. Barik (1999), “Total Factor Productivity Growth in Developing Economies: A Study of Selected Industries in India”, Economic and Political Weekly, Vol. 34, pp M-92-105. Raj Rajesh, S.N. and Malathy Duraisamy (2006), Productivity Growth, Technical Progress and Efficiency Change in the Unorganised Manufacturing Sector During Reforms Period: Insights from Major States in India, In Debi, S. and Annigeri, V. B. (eds.) Sustainable Development and the Indian Economy, Serial Publications, New Delhi, 2006 (pp. 116-134). Raj, Rajesh S N and Mihir K. Mahapatra (2009), On Measuring Productivity Growth in Indian Industry: Analysis of Organised and Unorganised Sector in Selected Major States, in Productivity, Efficiency, and Economic Growth in the Asia-Pacific Region, Contributions to Economics,Physica-Verlag HD, http://www.springerlink.com/ content/978-3-7908-2071-3. Ray, Subhash C. (2002), “Did India’s Economic Reforms improve Efficiency and Productivity? A Nonparametric Analysis of the Initial Evidence from Manufacturing”, Indian Economic Review, Vol. 37, No. 1, January- June 2002. Ray, Subhash (2004), Data Envelopment Analysis: Theory and Techniques for Economics and Operations Research, Cambridge University Press, Cambridge. Reddy, Y.V. (2005), “Importance of Productivity in India”, Inaugural address by the Governor, Reserve Bank of India, at the Annual Conference of Indian Economic Association held on December 27at Andhra University, Visakhapatnam. Rodrik, Dani, and Arvind Subramanian (2005), “From ‘Hindu Growth’ to Productivity Surge: The Mystery of the Indian Growth Transition,” IMF Staff Papers, Vol. 52, No. 2, pp. 193-228. Sastry, D.U. (1995), “TFPG in Manufacturing Industry” Economic and Political Weekly, Vol. 30, p. 123. Sivadasan, J. (2007), “Productivity Consequences of Product Market Liberalization: Microevidence from Indian Manufacturing Sector Reforms”, Working Paper. Ann Arbor, MI: University of Michigan. Solow, R.M.(1957), “Technical Change and the Aggregate Production Function”, The Review of Economics and Statistics, Vol. 39, No. 3. (Aug., 1957), pp. 312-320. Srivastava, Vivek (1996): “Liberalisation, Productivity and Competition: A Panel Study of Indian Manufacturing”, Oxford University Press, Delhi. Srivastava, Vivek (2000), “The Impact of India’s Economic Reforms on Industrial Productivity, Efficiency and Competitiveness”, Draft of the report Submitted to the National Council of Applied Economic Research, New Delhi. Sunil Kumar (2003), “Inter-temporal and Inter-State Comparisons of Total Factor Productivity in Indian Manufacturing Sector: An Integrated Growth Accounting Approach”, Artha Vijnana, VOL. XLV, pp. 161- 184. Tata Services Limited (2003), “Total Factor Productivity of Tata Companies vis-a-vvis other Manufacturing Firms and Manufacturing Sector”, Tata Services Limited, Mumbai. Topalova, Petia (2004), “Trade Liberalisation and Firm Productivity: The Case of India”, IMF Working Paper, No. WP/04/28. Trivedi, P, A Prakash and D Sinate (2000), “Productivity in Major Manufacturing Industries in India: 1973-74 to 1997-98”, Development Research Group Study, No 20, Department of Economic Analysis and Policy, Reserve Bank of India, Mumbai. Trivedi, Pushpa (2004), “An Inter-State Perspective on Manufacturing Productivity in India: 1980-81 to 2000-01”, Indian Economic Review, Vol. 39. Trivedi, Pushpa (2003), “Growth and Productivity in Selected Manufacturing Industries in India: A Regional Perspective”, Visiting Research Fellow Series, No. 375, Institute of Developing Economies, Japan External Trade Organization, Chiba, Japan. Tata Services Limted, TSL (2003), Reforms and Productivity Trends in Indian Manufacturing Sector, Department of Economics and Statistics, Tata Services, Mumbai. Unel, Bulent (2003), “Productivity Trends in India’s Manufacturing Sectors in the Last Two Decades”, IMF Working Paper, No. WP/03/22. Veeramani, C and Bishwanath Goldar, “Manufacturing Productivity in Indian States: Does Investment Climate Matter?”, Economic and Political Weekly, June 11, 2005. Virmani, Arvind (2004), “Sources of India’s economic growth: trends in total factor productivity”, ICRIER Working Papers No.131, Indian Council for Research on International Economic Relations, New Delhi, India. World Economic Forum (2009), The Global Competitiveness Report: 2008– 2009, Switzerland. Young, A. (1995), “The Tyranny of Numbers: Confronting the Statistical Realities of the East Asian Growth Experience” Quarterly Journal of Economics, Vol 110, pp. 641-80.
# Dr. Pushpa Trivedi is a Professor at Indian Institute of Technology Bombay. Shri L. Lakshmanan, Dr. Rajeev Jain and Dr. Y. K. Gupta are Assistant Advisers in the Internal Debt Management Department, the Department of Economic and Policy Research and the Department of Statistics and Information Management, respectively in the Reserve Bank of the Bank. 1 Though at times, industry is equated with manufacturing sector, the former is a broader term and in the Indian context, it includes manufacturing, mining and quarrying and electricity sectors, as can be seen from the composition of Index of Industrial Production (IIP). Needless to maintain that this study deals only with manufacturing sector. 2 In this study, we have used the word ‘estimation’ in a rather loose sense and it connotes measurement through both parametric and non-parametric methods. 3 Decision making units are generally firms, but the concept of competitiveness is also applied at industry levels across countries and across countries in the global markets. 4 The United States has the second highest score of 5.59 and Burundi had the lowest score of 2.58. The GCIR and GCRS (separated by commas) for some of the emerging economies are provided in brackets: China (29, 4.74), Malaysia (24, 4.87), South Korea (19, 5.00), Taiwan (12, 5.20), Israel (27, 4.80), South Africa (45, 4.34) and Thailand (36, 4.56). Refer World Economic Forum (2009) for more details. 7 The share of manufacturing sector in China’s GDP was 34 per cent in 2007, as compared with 16.1 per cent for India in 2009-10. 8 Nominal output has been deflated by the WPI for manufacturing sector in order to obtain real output, whereas, nominal wages and emoluments have been deflated by CPI for industrial workers, CPIiw (brought to the base 1980-81, using the data on inflation as measured for the CPIiw, from the various series with different base years) for conversions of nominal wages and employments into their real counterparts. 9Source: Calculation based on data sourced for Germany from http://www.euklems.net/ 10 For 1995-96, there is a gap in the unit level data as the ASI data was not available for this year. 11 It may be noted that food, beverages and tobacco (FBT) industries do not feature in the list of exporting industries. 12 Studies published during 1962 to 1998 have been covered in their review. 13 Some studies have also considered mid-eighties as the reform period. (See Srivastava 1996). 14 Mohanty (1992) derived annual estimates of labour inputs for inter censual years by linear interpolation of the 1970-71 and 1980-81 census workforce data, whereas, for the eighties, he assumes growth rate of employment to be 0.387 and 6.005 per cent for the registered and unregistered manufacturing sectors, respectively. 15 We have not included Goldar et al (forthcoming) in Table 3.2, as it deals only with partial productivity measures. We have retained this study in Table 3.1, as it is one of the few studies that provide the latest trends in India’s unorganised manufacturing sector. 16 Some researchers have also used variants of capital stock, such as, fixed (FK) and working capital (WK). 17 A more detailed discussion on methodologies used in this study has been provided in Section 4 of this study. 18 The word estimation is used in a rather loose sense. It means estimation of productivity with both parametric and non-parametric methods. 19 As mentioned earlier, we have also used Input-Output tables 2003-04 and 2006-07 for computing input price index for the Total organised manufacturing sector for India. 20 The abbreviations used for the various states (see the list of abbreviations) by the first three letters of the respective states. 21 A few researchers do not consider post-reform as the appropriate description of the period of liberalised policy regime. Ideally, it could also be called as the reform period rather than post-reform period. However, in view of the fact that majority of researcher have referred to it as the post-reform period, we also follow this tradion. 22 See justification for this in Trivedi (2004). 23 Total inputs comprises total value of fuels and materials consumed as well as expenditures such as cost of contract and commission work done by others on materials supplied by the factory, cost of materials consumed for repair and maintenance of factory’s fixed assets including cost of repairs and maintenance work done by others to the factory’s fixed assets, inward freight and transport charges, rates and taxes (excluding income tax), postage, telephone and telex expenses, insurance charges, banking charges, cost of printing and stationery and purchase value of goods sold in the same condition as purchased. 24 See Coelli (1996), http://www.uq.edu.au/economics/cepa/frontier.htm 25 See Coelli et al (2005) for more elaboration. 26 http://www.uq.edu.au/economics/cepa/deap.htm 27 Caves, Christensen, and Diewert (1982), Fare, Grosskopf, Norris and Zhang (1994). 28 For decomposition of Malmquist index, see Annexure 4.5. 29 As we have discussed only ‘organised’ manufacturing sector in section 5.1, we will keep referring to it simply as ‘manufacturing’ sector in this section. In other sections where we compare it with other datasets, we will be more specific. 30 It may be noted that we have extended the post-reform period only for manufacturing sector for period up to 2007-08. 31 The states excluded are: Punjab (chemical), Rajasthan, Kerala, Gujarat, Bihar* (leather) and Andhra Pradesh (metal). 32 Various Appendix Figures (Figure A5.1 to A5.15) provide the industry-wise movement of TFP indices for each of the 15 selected states of India. 33 DEAP Version 2.1 provided by Tim Coelli at http://www.uq.edu.au/economics/cepa/deap.htm 34 Some of the studies such as, Das (2008), have found the convergence of overall technical efficiency across states during 1979-80 to 2003-04. Kumar, (2004) concludes that there was a tendency of convergence in TFPG among Indian states during the post-reform period, but only for the states that were technically efficient at the beginning of the reform. 35 We get a single estimate of TFPG with the production function approach and hence, in order to capture the year to year variation in TFP and relate it to its determinants, we have used TFPG obtained by applying GAA methodology for the organised manufacturing sector. As mentioned earlier, we have not estimated TFPG for the unorganised manufacturing sector due to problem of non-availability of the required data for obtaining reliable estimates of TFPG. 36 It may be mentioned here that the food processing industry is closely linked to the food manufacturing. For the problems faced by the agro-processing industries, see Kachru (undated). 37 Reported at http://mospi.nic.in/ContentPage.aspx?CategoryId=122 38 Government of India (2006), Report of the Working Group on Textiles & Jute Industry, Ministry of Textiles. |
|||||||||||||||||||||||||||||||||||||||||||||||||||||||||||||||||||||||||||||||||||||||||||||||||||||||||||||||||||||||||||||||||||||||||||||||||||||||||||||||||||||||||||||||||||||||||||||||||||||||||||||||||||||||||||||||||||||||||||||||||||||||||||||||||||||||||||||||||||||||||||||||||||||||||||||||||||||||||||||||||||||||||||||||||||||||||||||||||||||||||||||||||||||||||||||||||||||||||||||||||||||||||||||||||||||||||||||||||||||||||||||||||||||||||||||||||||||||||||||||||||||||||||||||||||||||||||||||||||||||||||||||||||||||||||||||||||||||||||||||||||||||||||||||||||||||||||||||||||||||||||||||||||||||||||||||||||||||||||||||||||||||||||||||||||||||||||||||||||||||||||||||||||||||||||||||||||||||||||||||||||||||||||||||||||||||||||||||||||||||||||||||||||||||||||||||||||||||||||||||||||||||||||||||||||||||||||||||||||||||||||||||||||||||||||||||||||||||||||||||||||||||||||||||||||||||||||||||||||||||||||||||||||||||||||||||||||||||||||||||||||||||||||||||||||||||||||||||||||||||
கடைசியாக புதுப்பிக்கப்பட்ட பக்கம்:


