This article presents the survey findings of Industrial Outlook Survey conducted for July-September 2011 quarter, the 55th round in the series. It gives an assessment of business situation of companies in manufacturing sector, for the quarter July-September 2011, and their expectations for the ensuing quarter October-December 2011. The survey results signal further weakened business conditions in the Indian manufacturing sector for assessment quarter as well as expectation quarter. The Business Expectation Index, a measure that gives a single snapshot of the industrial outlook in each study quarter, dropped to 109.4 from 116.3 for assessment quarter and to 118.8 from 121.5 for expectation quarter; however, it still remains well above 100, the threshold that separates contraction from expansion.
Highlights
-
The demand conditions based on Production, Order books, Capacity Utilisation, Imports and Exports showed signs of further moderation during the assessment quarter as well as expectation quarter as compared to the previous round of the survey as well as the corresponding quarter of previous year. This is reflected in decline in net response2 in favour of higher Production, Order books, Capacity Utilisation, Imports and Exports.
-
Moderation in demand conditions anticipated by manufacturing sector during expectation quarter of the previous survey round is well reflected in assessment quarter of the current survey round.
-
Financial condition showed a lower optimism in both the assessment and expectation quarters. Net responses for availability of finance further declined. The cost of external finance is perceived to rise further. The pressure from cost of raw materials which mounted in the last few quarters continued, as majority of respondents expected cost of raw material to rise. Net responses on selling price and profit margin further declined in both the quarters under review which indicates decline in pricing power of the manufacturing sector.
-
Industry-wise analysis shows that majority of the industry groups especially Cement and Textiles reported lower optimism on demand conditions. Cement and Textiles industries also expressed lowest optimism in Overall Financial situation.
-
Size-wise analysis shows that demand conditions turned less optimistic across all size classes which was more pronounced in case of smaller size companies’ (Production < ` 100cr.) Similar trend was observed for financial conditions.
-
About half of the respondents expressed Production Constraints for attaining normal production level during July-September 2011.
I. Introduction:
The Reserve Bank of India has been conducting the Industrial Outlook Survey (IOS) on a quarterly basis since 1998. The Survey gives insight into the perception of the public and private limited companies engaged in manufacturing activities about their own performance and prospects. The assessment of business sentiments for the current quarter and expectations for the ensuing quarter are based on qualitative responses on 20 major parameters covering overall business situation, financial situation, demand indicators, price, profit margins and employment situation. The survey provides useful forward-looking inputs for policymakers, analysts and business alike.
II. Data Coverage and Methodology3
II.1 Sample Size
The sample covers a panel of about 2,000 public and private limited companies, mostly with paid-up capital above ` 50 lakh in the manufacturing sector. The fieldwork for the survey was carried out by an agency during the three-month period ending September 2011. The panel of respondents is kept uniform to the extent possible with periodic updating in the case of addition of new companies or exclusion of closed/merged companies. The sample is chosen so as to get a good representation of size and industry.
II.2 Response to the Survey
The survey elicited response from 1528 (response rate 76%) manufacturing companies.
II.3 Survey Schedule
The survey schedule consists of qualitative questions containing five blocks (Annex) and the target respondents are senior management personnel or finance heads of the companies.
III. Survey Findings:
III.1 Demand conditions
The survey collects perceptions of the Indian manufacturers about prominent demand-related parameters, namely, Production, Order Books, Capacity Utilisation, Inventory, Exports and Imports.
III.1.1 Production
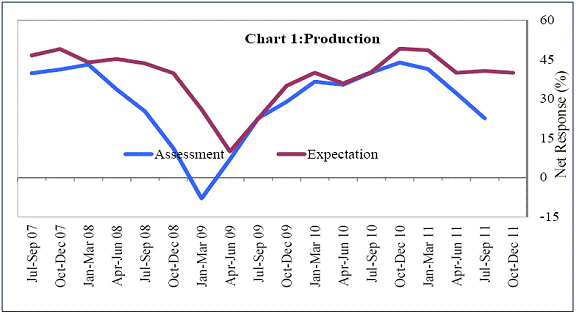
The net response favouring higher production registered a decline from 32.1 per cent to 22.6 per cent for the assessment quarter and from 40.6 per cent to 39.9 per cent for the expectation quarter (Table 1 and Chart 1).
III.1.2 Order Books
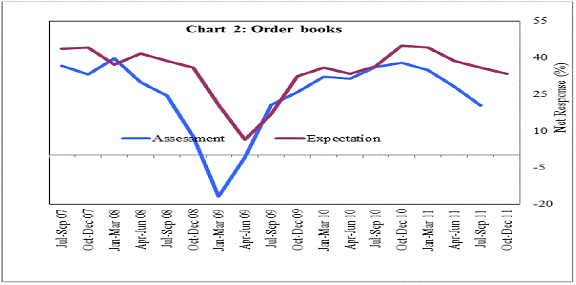
The order books position of the manufacturing companies has also shown similar trend with moderation of the net responses for the assessment and expectation quarter. (Table 2 and Chart 2).
III.1.3 Pending order
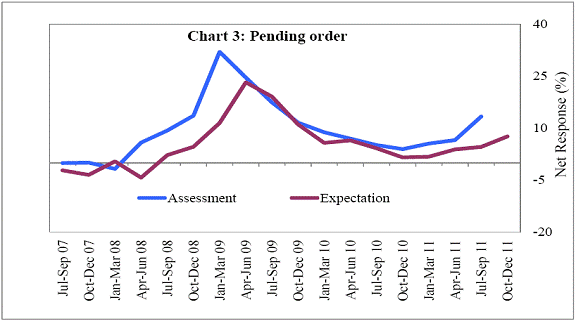
The pending order position has improved for both the quarters under review, as some companies shifted their responses from ‘above normal’/’normal’ to ‘below normal’ category. (Table 3 and Chart 3).
III.1.4 Capacity Utilisation
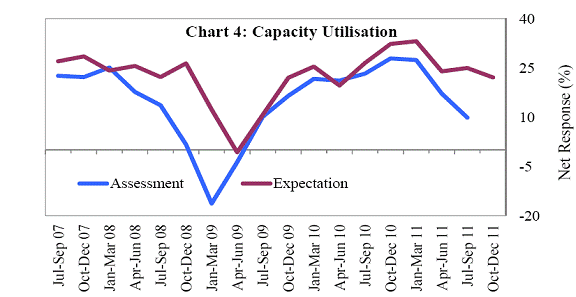
The survey collects views of manufacturing companies on change in capacity utilisation level (increase/decrease / no change) for the main product, level of capacity utilisation compared to the average in the last four quarters (above normal/ below normal/ normal); and assessment of production capacity with regard to expected demand in the next six months (more than adequate/less than adequate/ adequate). While 57 per cent of the respondents reported no change in the capacity utilisation of their main product, there is a moderation in capacity utilisation level over previous quarter on net response basis during both the quarters under review (Table 4 and Chart 4).
III.1.5 Inventory of Raw Materials & Finished Goods
Majority of the respondents (80-84 per cent) reported to have maintained the average level of inventory of raw materials for the assessment as well as expectation quarters. Similar trend is observed for the inventory of finished goods (Table 5). Around 14 per cent of the respondents assessed their raw material inventory levels to be above average during the assessment quarter. This proportion is marginally lower in the expectation quarter.
III.1.6 Exports and Imports
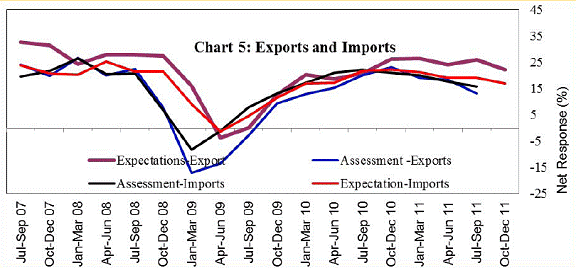
The survey reveals lower optimism of the manufacturing sector in terms of growth in exports and imports. The net response for exports declined from 18.2 per cent to 13.1 per cent whereas, for imports it declined from 17.6 per cent to 15.7 per cent in the assessment quarter. Similar decline in net response for exports and imports was observed for the expectation quarter (Table 6 ,Table 7 and Chart 5).
III.1.7 Employment Situation
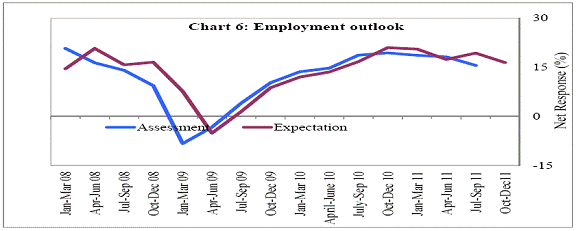
About 70 per cent of the respondents reported ‘no change’ in their labour force. Net response for expectation quarter declined to 16.5 per cent from 19.4 per cent. (Table 8 and Chart 6).
III.2 Financial Parameters
The survey assesses sentiments about financial conditions based on the parameters, viz., overall financial situation, working capital finance requirement (excluding internal sources of funds), availability of finance (both internal and external sources), cost of external finance, cost of raw material, selling price and profit margin.
III.2.1 Overall Financial Situation
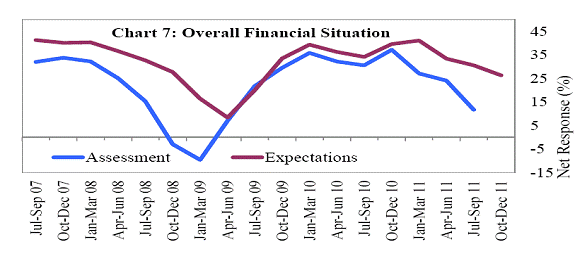
Overall financial situation has shown a further decline in optimism in the assessment quarter. The net response for better financial situation in assessment quarter decreased to 11.7 per cent from 24.1 per cent. The manufacturers also foresee decline in overall financial situation for the expectation quarter as the net response declined to 26.3 per cent from 30.6 per cent a quarter ago (Table 9, Chart: 7).
III. 2.2 Working Capital Finance requirement and Availability of Finance
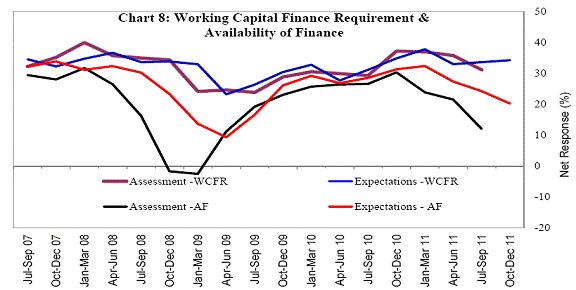
The sentiment for working capital finance requirement (excluding internal source of funds) in the assessment quarter has moderated with net response declining from 35.7 per cent to 31.1 per cent. However, marginal improvement is anticipated for the expectation quarter (Table 10).
The survey shows that lower percentage of respondents assesses/expects Availability of Finance to improve in the current/ensuing quarter. This is reflected in the lower net response for both the quarters under review (Table 11, Chart 8).
III. 2.3 Cost of External Finance
Increasingly a larger number of respondents perceived rise in the cost of funds in recent rounds of the survey. 53.7 per cent of the respondents feel that the cost of external funds have raised further during July-September2011 (Table 12). One quarter ahead outlook also signals similar sentiment.
III.2.4 Cost of Raw Material
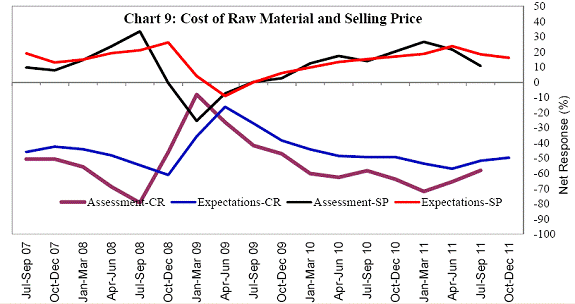
63.3 per cent of respondents have reported a further increase in cost of raw material in the assessment quarter, though the pessimism (increase in cost of raw material) has marginally declined from the previous round. A similar scenario is reported in the expectation quarter (Table 13, Chart 9).
III.2.5 Selling price
The survey seeks responses on change in selling prices (ex-factory unit prices) of the manufactured products on aggregate basis. Net response for selling price has dropped in both the quarters under review, indicating the marginal softening of output prices (Table 14, Chart 9).
III.2.6 Profit margin
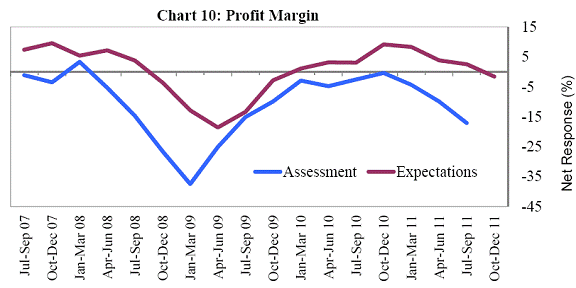
The survey seeks opinion of manufacturing companies on changes in profit margin (gross profits as percentage to net sales). While more than half of the respondents perceive no change in the profit margin, net response on profit margin declined in both the quarters under review (Table 15 and Chart 10) indicating a fall in pricing power in the manufacturing sector.
III.3 Overall Business Situation
III.3.1 Overall Business Situation
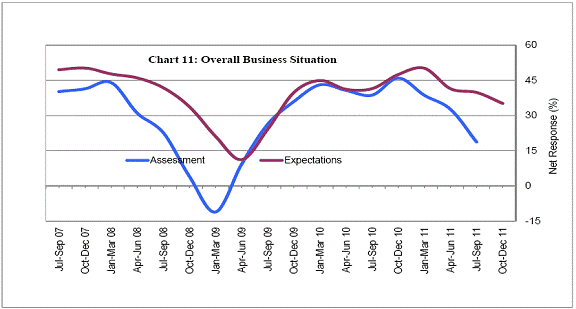
The overall business situation is a parameter that captures the overall confidence of manufacturing companies. The net response of the overall business situation for assessment quarter shows marked decline to 18.7 per cent from 32.6 per cent in the previous quarter. The net response for expectation quarter has also shown similar trend (Table 16, Chart 11).
III.3.2 Business Expectation Index (BEI)
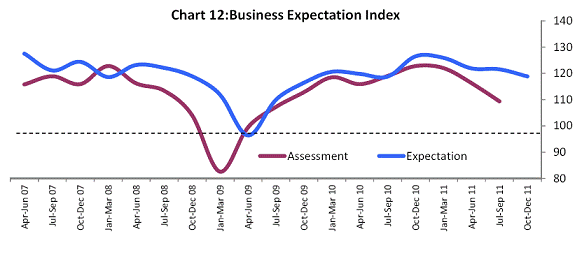
The Business Expectation Index gives a single snapshot of the industrial outlook in each quarter. This index is computed as the weighted average of net responses from all the industries on nine select performance parameters where the weights are the industry’s share in Gross Value Added (GVA). The selected parameters are Overall Business Situation, Production, Order Books, Inventory of Raw Materials, Inventory of Finished Goods, Profit Margin, Employment, Exports and Capacity Utilisation. The methodology for compilation of the BEI is given in the article Quarterly Industrial Outlook Surveys: Trends since 2001 published in October 2009 Bulletin.
BEI has declined considerably to 109.3 from 116.3 for assessment quarter and to 118.8 from 121.5 for the expectation quarter which indicates continued slowdown of the economy (Table17 Chart 12).
III.3.3 Industry-wise and Size-wise Analysis
The industry-wise analysis shows that majority of the industry groups, more visibly ‘Cement’ and’ Textiles’ are less optimistic on demand conditions. These industries also expressed lowest optimism in overall financial situation. On cost of finance, pessimism was observed in all the industries and more visibly in ‘Cement’ and ‘Basic metals’ industries.
On Size-wise analysis, demand conditions were less optimistic across all size classes (Table18), which was more pronounced for smaller companies (Annual Production < ` 100 cr). Similar trend was observed for financial conditions as well. However, some optimism was expressed by bigger companies (Annual Production of ‘` 100 Crore and above’) in availability of finance.
III.3.5 Constraints for attaining the normal production level
About 50 per cent of companies reported Production Constraints for attaining the normal production level during the quarter July-September 2011. Major constraints reported are lack of domestic demand, Shortage of power, shortage of raw material, shortage of working capital finance and lack of export demand. Industry-wise break-up reveals that companies in the industry groups, viz, Textiles, Basic metals, Cement, Fertilisers and Transport equipment reported more production constraints (Table 19).
III.3.6 Survey Results and Official Statistics
Chart 13 show the movements of annual growth rates of quarterly GDP-Manufacturing, IIP-Manufacturing (Base 2004-05) and the BEI based on assessment and expectations. It is observed that BEI has captured most of the turning points of the official statistics.
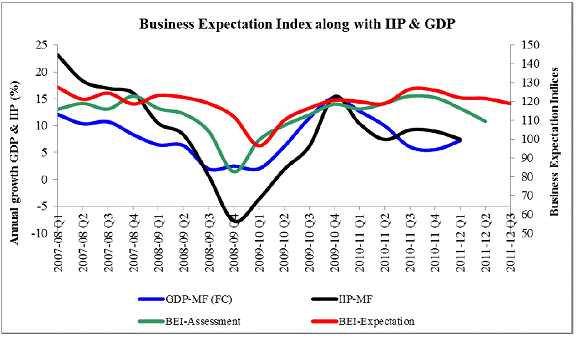 |
Table 1 : Assessment & Expectations for Production |
(Percentage responses)# |
Survey Quarter |
Total response |
Assessment for Current Quarter |
Expectation for Next Quarter |
Increase |
Decrease |
No change |
Net response |
Increase |
Decrease |
No change |
Net response |
Apr-Jun 09 |
1242 |
33.1 |
26.2 |
40.6 |
6.9 |
32.5 |
22.6 |
44.9 |
9.9 |
Jul-Sep 09 |
1180 |
40.9 |
18.3 |
40.8 |
22.6 |
38.5 |
16.1 |
45.5 |
22.4 |
Oct-Dec 09 |
1256 |
44.0 |
15.2 |
40.8 |
28.9 |
46.0 |
11.0 |
43.0 |
35.0 |
Jan-Mar 10 |
1079 |
49.0 |
12.5 |
38.5 |
36.5 |
48.8 |
8.8 |
42.3 |
40.0 |
Apr-Jun 10 |
1092 |
48.4 |
13.0 |
38.6 |
35.4 |
45.8 |
9.9 |
44.3 |
35.9 |
Jul-Sep 10 |
1403 |
51.6 |
11.6 |
36.8 |
40.0 |
49.7 |
9.4 |
40.9 |
40.2 |
Oct-Dec 10 |
1561 |
53.9 |
10.0 |
36.0 |
43.9 |
55.9 |
6.8 |
37.3 |
49.1 |
Jan-Mar 11 |
1524 |
52.1 |
10.7 |
37.1 |
41.4 |
55.4 |
6.8 |
37.7 |
48.6 |
Apr-Jun 11 |
1504 |
47.8 |
15.7 |
36.5 |
32.1 |
49.1 |
9.1 |
41.8 |
40.0 |
July-Sep 1 |
1528 |
40.8 |
18.3 |
40.9 |
22.6 |
49.6 |
9.0 |
41.5 |
40.6 |
Oct-Sep 11 |
|
|
|
|
|
49.5 |
9.5 |
41.0 |
39.9 |
# Due to rounding off percentage may not add up to 100. this is applicable throughout the article . |
Table 2: Assessment & Expectations for Order books |
(Percentage responses)# |
Survey Quarter |
Total response |
Assessment for Current Quarter |
Expectation for Next Quarter |
Increase |
Decrease |
No change |
Net response |
Increase |
Decrease |
No change |
Net response |
Apr-Jun 09 |
1242 |
28.4 |
29.3 |
42.3 |
-0.9 |
31.0 |
24.6 |
44.4 |
6.4 |
Jul-Sep 09 |
1180 |
38.2 |
17.7 |
44.1 |
20.5 |
35.5 |
18.7 |
45.8 |
16.8 |
Oct-Dec 09 |
1256 |
39.5 |
13.6 |
46.8 |
25.9 |
43.5 |
11.2 |
45.3 |
32.3 |
Jan-Mar 10 |
1079 |
43.5 |
11.6 |
44.9 |
31.9 |
44.8 |
9.1 |
46.1 |
35.8 |
Apr-Jun 10 |
1092 |
41.8 |
10.5 |
47.7 |
31.3 |
42.3 |
8.9 |
48.8 |
33.4 |
Jul-Sep 10 |
1403 |
45.4 |
9.3 |
45.3 |
36.1 |
44.4 |
8.1 |
47.5 |
36.3 |
Oct-Dec 10 |
1561 |
46.9 |
9.1 |
44.0 |
37.9 |
49.8 |
5.1 |
45.1 |
44.8 |
Jan-Mar 11 |
1524 |
44.8 |
10.1 |
45.2 |
34.7 |
49.6 |
5.6 |
44.8 |
44.0 |
Apr-Jun 11 |
1504 |
42.5 |
14.4 |
43.0 |
28.1 |
45.9 |
7.5 |
46.6 |
38.4 |
July-Sep 11 |
1528 |
37.9 |
17.6 |
44.5 |
20.3 |
45.4 |
9.4 |
45.2 |
35.9 |
Oct-Dec 11 |
|
|
|
|
|
43.5 |
10.1 |
46.4 |
33.4 |
Table 3: Assessment & Expectations for Pending Orders |
(Percentage responses) # |
Survey Quarter |
Total response |
Assessment for Current Quarter |
Expectation for Next Quarter |
Below Normal |
Above Normal |
Normal |
Net response |
Below Normal |
Above Normal |
Normal |
Net response |
Apr-Jun 09 |
1242 |
29.1 |
4.5 |
66.5 |
24.6 |
28.0 |
4.8 |
59.4 |
23.2 |
Jul-Sep 09 |
1180 |
21.1 |
3.7 |
75.2 |
17.4 |
22.9 |
3.8 |
73.4 |
19.1 |
Oct-Dec 09 |
1256 |
17.1 |
5.6 |
77.3 |
11.6 |
15.2 |
4.2 |
80.6 |
11.0 |
Jan-Mar 10 |
1079 |
15.5 |
6.7 |
77.8 |
8.8 |
12.2 |
6.5 |
81.3 |
5.7 |
Apr-Jun 10 |
1092 |
14.3 |
7.4 |
78.3 |
6.9 |
12.9 |
6.4 |
80.7 |
6.5 |
Jul-Sep 10 |
1403 |
12.0 |
6.9 |
81.1 |
5.1 |
11.4 |
7.3 |
81.3 |
4.2 |
Oct-Dec 10 |
1561 |
11.6 |
7.6 |
80.8 |
3.9 |
8.8 |
7.3 |
83.9 |
1.5 |
Jan-Mar 11 |
1524 |
12.5 |
6.9 |
80.6 |
5.5 |
9.8 |
8.1 |
82.1 |
1.7 |
Apr-Jun 11 |
1504 |
13.3 |
6.7 |
80.0 |
6.5 |
10.4 |
6.6 |
83.0 |
3.9 |
Jul-Sep 11 |
1528 |
18.0 |
4.7 |
77.3 |
13.3 |
11.8 |
7.2 |
81.0 |
4.5 |
Oct-Dec 11 |
|
|
|
|
|
13.6 |
6.0 |
80.4 |
7.6 |
| Pending Orders ‘Below Normal’ is optimistic |
Table 4: Assessment & Expectations for Capacity Utilisation |
(Percentage responses)# |
Parameter |
Options |
Assessment for Quarter |
Expectations for Quarter |
Apr-June 2011 |
July-Sep 2011 |
July-Sep 2011 |
Oct-Dec 2011 |
Capacity Utilisation (main product) |
Increase |
30.5 |
26.4 |
33.9 |
32.1 |
No Change |
56.2 |
57.0 |
57.2 |
57.9 |
Decrease |
13.3 |
16.5 |
8.9 |
10.0 |
Net Response |
17.2 |
9.9 |
25.0 |
22.2 |
Level of Capacity Utilisation (compared to the average in last 4 quarters) |
Above normal |
13.8 |
10.8 |
14.3 |
12.7 |
Normal |
71.7 |
72.0 |
75.7 |
75.0 |
Below Normal |
14.5 |
17.2 |
10.0 |
12.3 |
Net Response |
-0.7 |
-6.4 |
4.3 |
0.3 |
Assessment of Prod. Capacity (with regard to expected demand in next 6 months) |
More than adequate |
11.8 |
13.2 |
11.2 |
14.2 |
Adequate |
80.8 |
78.8 |
82.8 |
79.1 |
Less than adequate |
7.4 |
8.0 |
5.9 |
6.7 |
Net Response |
4.3 |
5.2 |
5.3 |
7.4 |
Table 5: Assessment & Expectations for level of Inventory (Raw material and Finished goods) |
(Percentage responses) # |
Parameter |
Options |
Assessment for Quarter |
Expectations for Quarter |
Apr-June 2011 |
July-Sep 2011 |
July-September 2011 |
Oct-Dec 2011 |
Inventory of raw material |
Below average |
6.6 |
6.9 |
5.7 |
5.4 |
Average |
81.1 |
79.6 |
85.8 |
84.0 |
Above average |
12.3 |
13.5 |
8.5 |
10.6 |
Net Response |
-5.7 |
-6.6 |
-2.9 |
-5.2 |
Inventory of Finished goods |
Below average |
6.7 |
6.3 |
6.2 |
5.1 |
Average |
79.5 |
77.9 |
84.5 |
83.4 |
Above average |
13.8 |
15.8 |
9.3 |
11.5 |
Net Response |
-7.0 |
-9.5 |
-3.1 |
-6.5 |
| Inventory of raw material and finished goods ‘Below average’ is optimistic |
Table 6: Assessment & Expectations for Exports |
(Percentage responses)# |
Survey Quarter |
Total response |
Assessment for Current Quarter |
Expectation for Next Quarter |
Increase |
Decrease |
No Change |
Net Response |
Increase |
Decrease |
No Change |
Net Response |
Apr-Jun 09 |
1242 |
17.4 |
30.9 |
51.7 |
-13.5 |
19.5 |
23.3 |
57.3 |
-3.8 |
Jul-Sep 09 |
1180 |
20.9 |
23.8 |
55.3 |
-2.9 |
20.6 |
20.5 |
59 |
0.1 |
Oct-Dec 09 |
1256 |
27.3 |
18.1 |
54.6 |
9.2 |
27.0 |
14.5 |
58.5 |
12.5 |
Jan-Mar 10 |
1079 |
28.9 |
16.2 |
54.9 |
12.7 |
31.2 |
11.0 |
57.8 |
20.2 |
Apr-Jun 10 |
1092 |
29.1 |
13.7 |
57.2 |
15.3 |
30.0 |
11.5 |
58.5 |
18.5 |
Jul-Sep 10 |
1403 |
31.8 |
11.8 |
56.5 |
20.0 |
30.8 |
10.1 |
59.1 |
20.7 |
Oct-Dec 10 |
1561 |
34.4 |
11.4 |
54.2 |
23.1 |
34.4 |
8.3 |
57.3 |
26.1 |
Jan-Mar 11 |
1524 |
32.1 |
13.2 |
54.7 |
18.9 |
34.4 |
8.1 |
57.5 |
26.3 |
Apr-Jun 11 |
1504 |
31.8 |
13.6 |
54.6 |
18.2 |
33.4 |
9.4 |
57.1 |
24.0 |
July-Sep 11 |
1528 |
28.7 |
15.7 |
55.6 |
13.1 |
35.1 |
9.2 |
55.7 |
25.8 |
Oct-Dec 11 |
|
|
|
|
|
32.7 |
10.6 |
56.8 |
22.1 |
Table 7: Assessment & Expectations for Import |
(Percentage responses)# |
Survey Quarter |
Total response |
Assessment for Current Quarter |
Expectation for Next Quarter |
Increase |
Decrease |
No Change |
Net Response |
Increase |
Decrease |
No Change |
Net Response |
Apr-Jun 09 |
1242 |
17.1 |
18.4 |
64.5 |
-1.3 |
14.9 |
16.3 |
68.8 |
-1.4 |
Jul-Sep 09 |
1180 |
21.8 |
14.0 |
64.2 |
7.8 |
17.0 |
12.4 |
70.6 |
4.6 |
Oct-Dec 09 |
1256 |
23.3 |
10.3 |
66.5 |
13.0 |
21.3 |
9.8 |
68.9 |
11.5 |
Jan-Mar 10 |
1079 |
25.5 |
8.4 |
66.1 |
17.1 |
23.4 |
6.5 |
70.1 |
16.9 |
Apr-Jun 10 |
1092 |
27.7 |
6.8 |
65.6 |
20.9 |
22.9 |
5.9 |
71.2 |
17.1 |
Jul-Sep 10 |
1403 |
28.6 |
6.6 |
64.7 |
22.0 |
27.0 |
5.4 |
67.6 |
21.7 |
Oct-Dec 10 |
1561 |
27.3 |
6.4 |
66.3 |
20.9 |
27.3 |
5.1 |
67.6 |
22.2 |
Jan-Mar 11 |
1524 |
27.0 |
7.1 |
65.8 |
19.9 |
26.7 |
5.4 |
67.9 |
21.3 |
Apr-Jun 11 |
1504 |
25.0 |
7.4 |
67.6 |
17.6 |
25.1 |
6.2 |
68.6 |
18.9 |
July-Sep 11 |
1528 |
23.3 |
7.6 |
69.2 |
15.7 |
25.1 |
6.1 |
68.9 |
19.0 |
Oct-Dec 11 |
|
|
|
|
|
23.1 |
6.2 |
70.7 |
16.9 |
Table 8: Assessment & Expectations for Employment Outlook |
(Percentage responses) # |
Survey Quarter |
Total response |
Assessment for Current Quarter |
Expectation for Next Quarter |
Increase |
Decrease |
No Change |
Net Response |
Increase |
Decrease |
No Change |
Net Response |
Apr-Jun 09 |
1242 |
11.9 |
15.2 |
72.9 |
-3.3 |
10.5 |
15.6 |
74.0 |
-5.1 |
Jul-Sep 09 |
1180 |
14.2 |
10.1 |
75.7 |
4.1 |
11.5 |
10.0 |
78.6 |
1.5 |
Oct-Dec 09 |
1256 |
18.2 |
7.9 |
73.9 |
10.3 |
15.8 |
7.0 |
77.2 |
8.8 |
Jan-Mar 10 |
1079 |
21.0 |
7.3 |
71.7 |
13.7 |
18.2 |
6.1 |
75.6 |
12.1 |
Apr-Jun 10 |
1092 |
21.7 |
7.0 |
71.3 |
14.7 |
19.5 |
5.9 |
74.7 |
13.6 |
Jul-Sep 10 |
1403 |
25.1 |
6.3 |
68.6 |
18.7 |
21.8 |
5.1 |
73.1 |
16.8 |
Oct-Dec 10 |
1561 |
24.8 |
5.4 |
69.9 |
19.4 |
24.7 |
3.6 |
71.7 |
21.0 |
Jan-Mar 11 |
1524 |
24.3 |
5.6 |
70.1 |
18.7 |
25.0 |
4.3 |
70.7 |
20.6 |
Apr-Jun 11 |
1504 |
24.3 |
6.1 |
69.6 |
18.2 |
23.0 |
5.6 |
71.4 |
17.4 |
July-Sep 11 |
1528 |
22.7 |
7.1 |
70.2 |
15.6 |
24.0 |
4.6 |
71.5 |
19.4 |
Oct-Dec 11 |
|
|
|
|
|
21.7 |
5.2 |
73.1 |
16.5 |
Table 9: Assessment & Expectations for Overall Financial Situation |
(Percentage responses)# |
Survey Quarter |
Total response |
Assessment for Current Quarter |
Expectation for Next Quarter |
Better |
Worsen |
No change |
Net response |
Better |
Worsen |
No change |
Net response |
Apr-Jun 09 |
1242 |
26.4 |
19.4 |
54.2 |
7.0 |
27.8 |
19.4 |
52.7 |
8.4 |
Jul-Sep 09 |
1180 |
34.3 |
12.5 |
53.2 |
21.8 |
32.8 |
12.8 |
54.4 |
20.0 |
Oct-Dec 09 |
1256 |
38.8 |
9.3 |
51.8 |
29.5 |
40.5 |
7.0 |
52.5 |
33.5 |
Jan-Mar 10 |
1079 |
42.3 |
6.5 |
51.3 |
35.8 |
44.3 |
5.0 |
50.6 |
39.3 |
Apr-Jun 10 |
1092 |
39.1 |
6.9 |
54.0 |
32.2 |
41.6 |
5.3 |
53.1 |
36.3 |
Jul-Sep 10 |
1403 |
38.7 |
8.1 |
53.2 |
30.6 |
39.7 |
5.6 |
54.8 |
34.1 |
Oct-Dec 10 |
1561 |
42.8 |
5.7 |
51.5 |
37.1 |
44.9 |
5.3 |
49.7 |
39.6 |
Jan-Mar 11 |
1524 |
35.7 |
8.6 |
55.8 |
27.1 |
45.5 |
4.4 |
50.1 |
41.1 |
Apr-Jun 11 |
1504 |
34.5 |
10.4 |
55.0 |
24.1 |
38.6 |
5.2 |
56.1 |
33.4 |
July-Sep 11 |
1528 |
27.8 |
16.0 |
56.2 |
11.7 |
37.4 |
6.8 |
55.7 |
30.6 |
Oct-Dec 11 |
|
|
|
|
|
35.5 |
9.2 |
55.3 |
26.3 |
Table 10: Assessment & Expectations for Working Capital Finance Requirement |
(Percentage responses)# |
Survey Quarter |
Total response |
Assessment for Current Quarter |
Expectation for Next Quarter |
Increase |
Decrease |
No Change |
Net Response |
Increase |
Decrease |
No Change |
Net Response |
Apr-Jun 09 |
1242 |
57.0 |
24.6 |
9.2 |
24.6 |
31.1 |
7.9 |
61.0 |
23.2 |
Jul-Sep 09 |
1180 |
31.2 |
7.4 |
61.4 |
23.8 |
32.3 |
6.0 |
61.7 |
26.3 |
Oct-Dec 09 |
1256 |
35.2 |
6.4 |
58.4 |
28.8 |
34.7 |
4.3 |
61.0 |
30.4 |
Jan-Mar 10 |
1079 |
35.8 |
5.3 |
58.9 |
30.5 |
36.8 |
4.0 |
59.2 |
32.7 |
Apr-Jun 10 |
1092 |
34.7 |
4.8 |
60.5 |
29.9 |
31.9 |
4.3 |
63.8 |
27.7 |
Jul-Sep 10 |
1403 |
35.6 |
6.3 |
58.1 |
29.3 |
35.2 |
4.1 |
60.7 |
31.1 |
Oct-Dec 10 |
1561 |
41.3 |
4.1 |
54.6 |
37.1 |
38.4 |
3.6 |
58.0 |
34.8 |
Jan-Mar 11 |
1524 |
41.0 |
4.1 |
54.9 |
36.9 |
40.7 |
3.0 |
56.3 |
37.8 |
Apr-Jun 11 |
1504 |
41.1 |
5.4 |
53.5 |
35.7 |
37.4 |
4.4 |
58.2 |
32.9 |
July-Sep 11 |
1528 |
36.8 |
5.7 |
57.4 |
31.1 |
38.7 |
5.1 |
56.3 |
33.6 |
Oct-Dec 11 |
|
|
|
|
|
38.4 |
4.2 |
57.5 |
34.2 |
Table 11: Assessment & Expectations for Availability of Finance |
(Percentage responses)# |
Survey Quarter |
Total response |
Assessment for Current Quarter |
Expectation for Next Quarter |
Improve |
Worsen |
No Change |
Net Response |
Improve |
Worsen |
No Change |
Net Response |
Apr-Jun 09 |
1242 |
24.8 |
13.6 |
61.6 |
11.2 |
23.8 |
14.5 |
61.7 |
9.3 |
Jul-Sep 09 |
1180 |
28.0 |
8.8 |
63.2 |
19.2 |
27.0 |
10.4 |
62.6 |
16.6 |
Oct-Dec 09 |
1256 |
30.3 |
7.2 |
62.5 |
23.0 |
31.7 |
5.6 |
62.7 |
26.1 |
Jan-Mar 10 |
1079 |
32.1 |
6.4 |
61.5 |
25.7 |
33.7 |
4.5 |
61.8 |
29.2 |
Apr-Jun 10 |
1092 |
32.3 |
5.9 |
61.8 |
26.4 |
31.2 |
4.4 |
64.4 |
26.8 |
Jul-Sep 10 |
1403 |
32.6 |
6.0 |
61.4 |
26.6 |
32.9 |
4.4 |
62.7 |
28.5 |
Oct-Dec10 |
1561 |
35.9 |
5.6 |
58.4 |
30.3 |
35.3 |
4.0 |
60.6 |
31.3 |
Jan-Mar 11 |
1524 |
32.1 |
8.3 |
59.6 |
23.8 |
36.4 |
4.0 |
59.6 |
32.3 |
Apr-Jun 11 |
1504 |
30.2 |
8.7 |
61.1 |
21.5 |
32.6 |
5.3 |
62.2 |
27.3 |
July-Sep11 |
1528 |
24.0 |
12.0 |
64.4 |
12.1 |
30.0 |
5.8 |
64.2 |
24.2 |
Oct-Dec 11 |
|
|
|
|
|
28.7 |
8.5 |
62.7 |
20.2 |
Improvement in Availability of finance is optimism |
Table 12: Assessment & Expectations for Cost of External Finance |
(Percentage responses)# |
Survey Quarter |
Total response |
Assessment for Current Quarter |
Expectation for Next Quarter |
Decrease |
Increase |
No Change |
Net Response |
Decrease |
Increase |
No Change |
Net Response |
Oct-Dec 09 |
1256 |
9.0 |
23.8 |
67.2 |
-14.7 |
|
|
|
|
Jan-Mar 10 |
1079 |
7.7 |
23.6 |
68.7 |
-15.9 |
6.8 |
25.1 |
68.1 |
-18.3 |
Apr-Jun 10 |
1092 |
7.0 |
28.9 |
64.0 |
-21.9 |
6.1 |
26.8 |
67.1 |
-20.6 |
Jul-Sep 10 |
1403 |
5.0 |
33.2 |
61.8 |
-28.3 |
5.7 |
29.0 |
65.3 |
-23.3 |
Oct-Dec10 |
1561 |
4.0 |
37.9 |
58.1 |
-33.9 |
3.8 |
32.1 |
64.2 |
-28.3 |
Jan-Mar 11 |
1524 |
3.5 |
46.0 |
50.6 |
-42.5 |
3.7 |
35.0 |
61.3 |
-31.3 |
Apr-Jun 11 |
1504 |
3.5 |
52.5 |
44.1 |
-49.0 |
3.9 |
38.9 |
57.1 |
-35.0 |
July-Sep 11 |
1528 |
3.5 |
53.7 |
42.9 |
-50.2 |
4.0 |
43.7 |
52.4 |
-39.7 |
Oct-Dec 11 |
|
|
|
|
|
3.4 |
44.4 |
52.2 |
-41.0 |
Cost of external finance ‘Decrease’ is optimistic |
Table 13: Assessment & Expectations for Cost of Raw Material |
(Percentage responses)# |
Survey Quarter |
Total response |
Assessment for Current Quarter |
Expectation for Next Quarter |
Decrease |
Increase |
No Change |
Net Response |
Decrease |
Increase |
No Change |
Net Response |
Apr-Jun 09 |
1242 |
14.3 |
40.6 |
45.1 |
-26.3 |
14.3 |
30.5 |
33.7 |
-16.2 |
Jul-Sep 09 |
1180 |
8.1 |
49.8 |
42.1 |
-41.7 |
8.7 |
35.8 |
55.5 |
-27.1 |
Oct-Dec 09 |
1256 |
6.3 |
53.4 |
40.3 |
-47.1 |
5.0 |
43.4 |
51.6 |
-38.4 |
Jan-Mar 10 |
1079 |
2.2 |
62.3 |
35.5 |
-60.2 |
3.6 |
47.9 |
48.5 |
-44.3 |
Apr-Jun 10 |
1092 |
2.5 |
65.2 |
32.3 |
-62.7 |
2.2 |
50.8 |
47.0 |
-48.6 |
Jul-Sep 10 |
1403 |
3.5 |
61.8 |
34.7 |
-58.3 |
2.7 |
52.0 |
45.2 |
-49.3 |
Oct-Dec 10 |
1561 |
2.4 |
66.3 |
31.3 |
-63.9 |
3.3 |
52.6 |
44.1 |
-49.3 |
Jan-Mar 11 |
1524 |
1.7 |
73.7 |
24.6 |
-71.9 |
2.3 |
55.9 |
41.8 |
-53.6 |
Apr-Jun 11 |
1504 |
4.5 |
70.0 |
25.6 |
-65.5 |
2.5 |
59.5 |
38.0 |
-57.0 |
July-Sep 11 |
1528 |
5.3 |
63.3 |
31.4 |
-58.1 |
4.8 |
56.6 |
38.6 |
-51.7 |
Oct-Dec 11 |
|
|
|
|
|
3.7 |
53.4 |
42.9 |
-49.7 |
Cost of raw material ‘Decrease’ is optimistic |
Table 14: Assessment & Expectations for Selling Price |
(Percentage responses)# |
Survey Quarter |
Total response |
Assessment for Current Quarter |
Expectation for Next Quarter |
Increase |
Decrease |
No Change |
Net Response |
Increase |
Decrease |
No Change |
Net Response |
Apr-Jun 09 |
1242 |
17.0 |
24.4 |
58.0 |
-7.4 |
14.5 |
23.6 |
61.9 |
-9.1 |
Jul-Sep 09 |
1180 |
19.4 |
19.2 |
61.4 |
0.2 |
17.2 |
17.2 |
65.6 |
0 |
Oct-Dec 09 |
1256 |
18.6 |
15.9 |
65.5 |
2.6 |
19.2 |
13.2 |
67.6 |
6.0 |
Jan-Mar 10 |
1079 |
24.6 |
12.2 |
63.2 |
12.4 |
20.7 |
10.9 |
68.4 |
9.8 |
Apr-Jun 10 |
1092 |
29.3 |
12.0 |
58.6 |
17.3 |
22.4 |
9.1 |
68.5 |
13.3 |
Jul-Sep 10 |
1403 |
28.0 |
14.2 |
57.8 |
13.8 |
24.4 |
9.2 |
66.3 |
15.2 |
Oct-Dec 10 |
1561 |
30.2 |
10.0 |
59.8 |
20.2 |
25.7 |
8.7 |
65.5 |
17.0 |
Jan-Mar 11 |
1524 |
35.7 |
9.2 |
55.1 |
26.5 |
26.7 |
8.1 |
65.2 |
18.6 |
Apr-Jun 11 |
1504 |
35.0 |
13.4 |
51.6 |
21.5 |
30.6 |
7.0 |
62.4 |
23.7 |
July-Sep 11 |
1528 |
27.3 |
16.6 |
56.1 |
10.7 |
29.1 |
10.7 |
60.2 |
18.3 |
Oct-Dec 11 |
|
|
|
|
|
26.8 |
10.8 |
62.4 |
16.0 |
Selling price ‘Increase’ is optimistic |
Table 15: Assessment & Expectations for Profit Margin |
(Percentage responses) # |
Survey Quarter |
Total response |
Assessment for Current Quarter |
Expectation for Next Quarter |
Increase |
Decrease |
No Change |
Net Response |
Increase |
Decrease |
No Change |
Net Response |
Apr-Jun 09 |
1242 |
13.4 |
38.5 |
48.1 |
-25.1 |
15.4 |
34.0 |
50.6 |
-18.6 |
Jul-Sep 09 |
1180 |
16.9 |
32.0 |
51.1 |
-15.1 |
16.0 |
29.4 |
54.5 |
-13.4 |
Oct-Dec 09 |
1256 |
18.1 |
28.0 |
54.0 |
-9.9 |
20.2 |
23.0 |
56.8 |
-2.8 |
Jan-Mar 10 |
1079 |
21.7 |
24.6 |
53.9 |
-2.9 |
21.1 |
20.1 |
58.8 |
1.1 |
Apr-Jun 10 |
1092 |
20.2 |
25.0 |
54.9 |
-4.8 |
22.1 |
18.9 |
59.0 |
3.2 |
Jul-Sep 10 |
1403 |
21.3 |
23.9 |
54.8 |
-2.5 |
22.2 |
19.1 |
58.7 |
3.1 |
Oct-Dec 10 |
1561 |
22.7 |
23.1 |
54.2 |
-0.4 |
25.2 |
16.1 |
58.7 |
9.2 |
Jan-Mar 11 |
1524 |
20.8 |
25.1 |
54.1 |
-4.3 |
25.6 |
17.2 |
57.2 |
8.3 |
Apr-Jun 11 |
1504 |
18.2 |
28.1 |
53.6 |
-9.9 |
22.2 |
18.4 |
59.4 |
3.8 |
Jul-Sep 11 |
1528 |
15.2 |
32.3 |
52.5 |
-17.1 |
22.0 |
19.5 |
58.5 |
2.5 |
Oct-Dec 11 |
|
|
|
|
|
20.3 |
21.9 |
57.8 |
-1.6 |
Increase in Profit margin is optimism |
Table 16: Assessment & Expectations of Overall Business Situation |
(Percentage responses) # |
Survey Quarter |
Total response |
Assessment for Current Quarter |
Expectation for Next Quarter |
Better |
Worsen |
No Change |
Net Response |
Better |
Worsen |
No Change |
Net Response |
Apr-Jun 09 |
1242 |
30.7 |
21.4 |
47.9 |
9.3 |
31.8 |
20.6 |
47.6 |
11.2 |
Jul-Sep 09 |
1180 |
39.3 |
13.0 |
47.7 |
26.3 |
38.8 |
14.6 |
46.7 |
24.2 |
Oct-Dec 09 |
1256 |
46.0 |
10.1 |
43.9 |
36.0 |
47.2 |
7.4 |
45.4 |
39.8 |
Jan-Mar 10 |
1079 |
50.5 |
7.4 |
42.1 |
43.1 |
50.4 |
5.5 |
44.2 |
44.9 |
Apr-Jun 10 |
1092 |
47.8 |
7.1 |
45.0 |
40.7 |
47.3 |
6.1 |
46.6 |
41.2 |
Jul-Sep 10 |
1403 |
46.7 |
8.0 |
45.3 |
38.7 |
47.6 |
6.2 |
46.2 |
41.5 |
Oct-Dec 10 |
1561 |
51.4 |
5.5 |
43.1 |
45.9 |
52.5 |
5.1 |
42.4 |
47.4 |
Jan-Mar 11 |
1524 |
46.0 |
7.4 |
46.6 |
38.6 |
54.2 |
4.1 |
41.8 |
50.1 |
Apr-Jun11 |
1504 |
42.8 |
10.1 |
47.1 |
32.6 |
47 |
5.6 |
47.4 |
41.4 |
Jul-Sep 11 |
1528 |
34.1 |
15.4 |
50.5 |
18.7 |
46.6 |
6.8 |
46.6 |
39.8 |
Oct-Dec 11 |
|
|
|
|
|
43.1 |
8.0 |
48.9 |
35.2 |
Overall Business Situation ‘Better’ is optimistic |
Table-17: Business Expectation Index based on Assessment and Expectations |
Quarter |
ASSESSMENT |
EXPECTATIONS |
Index |
Change over previous quarter |
Change over previous
year |
Index |
Change over previous quarter |
Change over previous
year |
Jan-Mar 00 |
122.8 |
- |
- |
|
- |
- |
Apr-Jun 00 |
115.2 |
-7.6 |
- |
125.5 |
- |
- |
Jul-Sep 00 |
116.1 |
0.9 |
- |
126.1 |
0.6 |
- |
Oct-Dec 00 |
113.9 |
-2.2 |
- |
124.4 |
-1.7 |
- |
Jan-Mar 01 |
115.2 |
1.3 |
-7.6 |
122.5 |
-1.8 |
- |
Apr-Jun 01 |
109.9 |
-5.3 |
-5.3 |
120.7 |
-1.8 |
-4.8 |
Jul-Sep 01 |
108.7 |
-1.3 |
-7.4 |
118.9 |
-1.8 |
-7.2 |
Oct-Dec 01 |
100.7 |
-8.0 |
-13.2 |
119.5 |
0.6 |
-4.9 |
Jan-Mar 02 |
108.4 |
7.7 |
-6.8 |
105.3 |
-14.2 |
-17.3 |
Apr-Jun 02 |
110.8 |
2.4 |
0.9 |
112.3 |
7.0 |
-8.5 |
Jul-Sep 02 |
113.2 |
2.4 |
4.5 |
116.7 |
4.4 |
-2.2 |
Oct-Dec 02 |
113.8 |
0.6 |
13.1 |
121.2 |
4.6 |
1.7 |
Jan-Mar 03 |
118.4 |
4.6 |
10.0 |
119.7 |
-1.6 |
14.4 |
Apr-Jun 03 |
109.8 |
-8.6 |
-1.0 |
117.8 |
-1.8 |
5.6 |
Jul-Sep 03 |
114.3 |
4.5 |
1.1 |
117.2 |
-0.7 |
0.5 |
Oct-Dec 03 |
119.8 |
5.4 |
5.9 |
122.1 |
4.9 |
0.8 |
Jan-Mar 04 |
121.4 |
1.7 |
3.0 |
122.2 |
0.2 |
2.6 |
Apr-Jun 04 |
118.4 |
-3.0 |
8.6 |
121.5 |
-0.7 |
3.7 |
Jul-Sep 04 |
116.9 |
-1.5 |
2.6 |
120.0 |
-1.5 |
2.9 |
Oct-Dec 04 |
122.0 |
5.1 |
2.2 |
121.5 |
1.5 |
-0.6 |
Jan-Mar 05 |
122.5 |
0.5 |
1.1 |
123.2 |
1.7 |
1.0 |
Apr-Jun 05 |
117.5 |
-5.0 |
-0.9 |
120.7 |
-2.5 |
-0.8 |
Jul-Sep 05 |
114.9 |
-2.6 |
-2.0 |
119.6 |
-1.1 |
-0.4 |
Oct-Dec 05 |
124.3 |
9.4 |
2.3 |
122.7 |
3.1 |
1.2 |
Jan-Mar 06 |
120.7 |
-3.6 |
-1.8 |
125.7 |
3.0 |
2.5 |
Apr-Jun 06 |
121.8 |
1.1 |
4.3 |
120.5 |
-5.2 |
-0.2 |
Jul-Sep 06 |
120.7 |
-1.1 |
5.8 |
126.5 |
6.0 |
6.9 |
Oct-Dec 06 |
123.9 |
3.2 |
-0.4 |
125.3 |
-1.2 |
2.6 |
Jan-Mar 07 |
127.7 |
3.8 |
7.0 |
126.5 |
1.2 |
0.8 |
Apr-Jun 07 |
115.8 |
-11.9 |
-6.0 |
127.5 |
1.0 |
7.0 |
Jul-Sep 07 |
118.9 |
3.1 |
-1.8 |
121.1 |
-6.4 |
-5.4 |
Oct-Dec 07 |
115.9 |
-3.0 |
-8.0 |
124.4 |
3.3 |
-0.9 |
Jan-Mar 08 |
122.8 |
6.9 |
-4.9 |
118.6 |
-5.8 |
-7.9 |
Apr-Jun 08 |
116.2 |
-6.6 |
0.4 |
123.2 |
4.6 |
-4.3 |
Jul-Sep 08 |
113.4 |
-2.8 |
-5.5 |
122.1 |
-1.1 |
1.0 |
Oct-Dec 08 |
104.1 |
-9.3 |
-11.8 |
118.9 |
-3.2 |
-5.5 |
Jan-Mar 09 |
82.6 |
-21.5 |
-40.2 |
111.9 |
-7.0 |
-6.7 |
Apr-Jun 09 |
99.4 |
16.8 |
-16.8 |
96.4 |
-15.5 |
-26.8 |
Jul-Sep 09 |
107.2 |
7.8 |
-6.2 |
109.9 |
13.5 |
-12.2 |
Oct-Dec 09 |
112.8 |
5.6 |
8.7 |
116.4 |
6.5 |
-2.5 |
Jan-Mar 10 |
118.5 |
5.7 |
35.9 |
120.6 |
4.2 |
8.7 |
Apr-Jun 10 |
115.9 |
-2.6 |
16.5 |
119.8 |
-0.8 |
23.4 |
Jul-Sep 10 |
119.0 |
3.1 |
11.8 |
118.8 |
-1.0 |
8.9 |
Oct-Dec 10 |
122.8 |
3.8 |
10.0 |
126.5 |
7.7 |
10.1 |
Jan-Mar 11 |
122.0 |
-0.8 |
3.5 |
125.9 |
-0.6 |
5.3 |
Apr-Jun 11 |
116.3 |
-5.7 |
0.4 |
121.9 |
-0.6 |
5.3 |
Jul-Sep 11 |
109.4 |
-6.93 |
-9.67 |
121.5 |
-0.4 |
2.7 |
Oct-Dec 11 |
|
|
|
118.8 |
-2.69 |
-7.66 |
Table 18: Size-wise analysis: Annual Production and Paid-up Capital (PUC) |
Net Response (%) for October-December 2011 |
Parameter |
PUC-wise |
Production-wise |
Small |
Medium |
Big |
Small |
Medium |
Big |
Round 54 |
Round 55 |
Round 54 |
Round 55 |
Round 54 |
Round 55 |
Round 54 |
Round 55 |
Round 54 |
Round 55 |
Round 54 |
Round 55 |
Overall business situation |
32.1 |
20.7 |
40.7 |
36.9 |
36.3 |
36.3 |
35.7 |
33.6 |
43.2 |
36.4 |
42.4 |
42.4 |
Overall Financial situation |
22.2 |
16.4 |
31.3 |
27.6 |
31.1 |
31.1 |
26.6 |
23.7 |
34.6 |
28.6 |
30.2 |
27.1 |
Working Capital Finance Requirement |
24.6 |
22.0 |
34.4 |
34.9 |
33.0 |
33.0 |
29.1 |
28.9 |
36 |
37.4 |
42.1 |
32.2 |
Availability of Finance |
14.7 |
7.9 |
25.9 |
21.9 |
14.3 |
14.3 |
21 |
16.9 |
28 |
23.4 |
21.7 |
33.3 |
Cost of external finance |
-29.5 |
-30.1 |
-40.4 |
-41.7 |
-42.2 |
-42.2 |
-31.5 |
-34.5 |
-44.7 |
-45.5 |
-52.3 |
-43.1 |
Production |
34.3 |
26.9 |
41.6 |
41.2 |
40.4 |
40.4 |
35.4 |
37.2 |
45.1 |
41.5 |
43.3 |
37.9 |
Order Books |
24.6 |
27.0 |
37.4 |
33.9 |
37.3 |
37.3 |
32.1 |
32.5 |
39.1 |
33.9 |
38 |
27.8 |
Pending Orders, if applicable |
9.5 |
14.7 |
4.4 |
7.1 |
7.2 |
7.2 |
7.4 |
10.5 |
2.5 |
5.6 |
0.7 |
-2.0 |
Cost of raw materials |
-54.5 |
-56.7 |
-51.9 |
-48.8 |
37.4 |
37.4 |
-53.2 |
-54.7 |
-50.8 |
-45.6 |
-49.4 |
-47.5 |
Inventory of raw materials |
-5.5 |
-4.9 |
-2.8 |
-5.1 |
0.0 |
0.0 |
-1.8 |
-1.8 |
-3.5 |
-8.0 |
-4.4 |
-1.8 |
Inventory of Finished Goods |
-3.1 |
-3.7 |
-2.9 |
-6.4 |
2.2 |
2.2 |
-1.6 |
-4.1 |
-4.4 |
-7.8 |
-3.8 |
-10.3 |
Capacity utilisation |
14.7 |
6.7 |
26 |
23.3 |
26.4 |
26.4 |
22.9 |
18.0 |
27.3 |
24.3 |
23.7 |
23.7 |
Level of capacity utilisation |
6.6 |
-1.8 |
3.6 |
0.0 |
-7.7 |
-7.7 |
1.7 |
-4.9 |
5.8 |
3.9 |
8.8 |
0.0 |
Assessment of the production capacity |
4.9 |
6.2 |
4.8 |
7.6 |
11.0 |
11.0 |
4.2 |
4.3 |
6.2 |
9.9 |
6.4 |
10.3 |
Employment in the company |
14 |
6.7 |
20.6 |
16.7 |
7.7 |
7.7 |
14.2 |
7.4 |
23.1 |
19.6 |
25.2 |
1.7 |
Exports, if applicable |
11 |
9.8 |
27.6 |
23.3 |
26.0 |
26.0 |
18.1 |
14.0 |
29.8 |
27.9 |
38.7 |
30.8 |
Imports, if any |
4.7 |
6.9 |
20.6 |
18.2 |
20.2 |
20.2 |
11.9 |
13.6 |
22.5 |
19.7 |
29.9 |
18.5 |
Selling prices |
11 |
14.2 |
19.4 |
16.0 |
21.8 |
21.8 |
16.3 |
13.5 |
19.5 |
17.7 |
21.9 |
25.9 |
If increase expected in selling prices, rate of such increase |
18 |
13.6 |
13.1 |
17.4 |
5.5 |
5.5 |
11.9 |
17.5 |
13.4 |
16.5 |
16.7 |
20.5 |
Profit Margin |
-11.1 |
-16.1 |
3.6 |
-0.7 |
5.6 |
5.6 |
-1.5 |
-7.4 |
5.5 |
2.0 |
7.2 |
-5.2 |
Smaller companies (annual production less than ` 100 crore/PUC less than ` 1 crore).
Medium companies (annual production between ` 100 crore to ` 1000 crore /PUC between `. 1 crore to ` 100 crore)
Big companies (annual production above ` 1000 crore/ PUC above ` 100 crore) |
Table 19: Constraints for attaining the normal production level Industry-wise |
|
Production Constraint |
NO |
YES |
Count |
% |
Count |
% |
FOOD PRODUCTS |
64 |
50.0% |
64 |
50.0% |
TEXTILES |
66 |
34.0% |
128 |
66.0% |
BASIC METALS AND METAL PRODUCTS |
81 |
37.0% |
138 |
63.0% |
ELECTRICAL MACHINERY |
50 |
50.0% |
50 |
50.0% |
OTHER MACHINERY AND APPARATUS |
114 |
59.1% |
79 |
40.9% |
TRANSPORT EQUIPMENT |
50 |
48.5% |
53 |
51.5% |
FERTILIZERS |
15 |
48.4% |
16 |
51.6% |
PHARMACEUTICAL AND MEDICINES |
55 |
65.5% |
29 |
34.5% |
BASIC CHEMICALS |
61 |
56.5% |
47 |
43.5% |
RUBBER AND PLASTIC PRODUCTS |
52 |
53.1% |
46 |
46.9% |
PAPER AND PAPER PRODUCTS |
23 |
48.9% |
24 |
51.1% |
CEMENT |
17 |
45.9% |
20 |
54.1% |
WOOD AND WOOD PRODUCTS |
12 |
75.0% |
4 |
25.0% |
DIVERSIFIED |
16 |
72.7% |
6 |
27.3% |
OTHER INDUSTRIES |
84 |
56.8% |
64 |
43.2% |
All companies |
760 |
49.7% |
768 |
50.3% |
|
 IST,
IST,


