 IST,
IST,
Quarterly Order Books, Inventories and Capacity Utilisation Survey (OBICUS) April - June 2012 (18th Round)
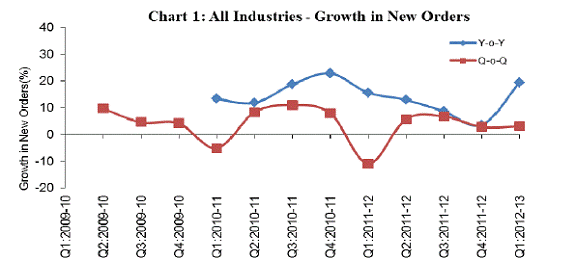
This article, fifth in the series, presents the findings of Order Books, Inventories and Capacity Utilisation Survey (OBICUS) conducted for Q1:2012-13. The survey results indicate that growth of new orders on y-o-y basis which was declining across the quarters of 2011-12, increased in Q1:2012-13 partly due to lower base. Capacity Utilisation (CU), however, moderated to the lowest level of the 13 quarters in Q1:2012-13. Finished goods inventory to sales ratio and raw material inventory to sales ratio increased in Q1:2012-13 over the previous quarter. Introduction: The Reserve Bank has been conducting the OBICUS on a quarterly basis. The survey is canvassed among 2,500 public and private limited companies in the manufacturing sector with a good size/industry representation. The survey captures the movements in order books, inventories and capacity utilisation which are important indicators of economic activity, inflationary pressures and overall business cycle. The information collected in the survey includes quantitative data on new orders received during the reference quarter, backlog orders at the beginning of the quarter, pending orders at the end of the quarter, total inventories with breakup of work-in-progress and finished goods inventories at the end of the quarter and item-wise production in terms of quantity and values during the quarter vis-à-vis the installed capacity from the targeted group. The level of CU is estimated from the above data as per the selected methodology1. Trend analysis is done to study the movements in order books, capacity utilisation and inventories based on a common set of companies in each round to facilitate better comparability of data over the reference quarters. In the current survey for Q1:2012-13 (18th Round), 1,154 manufacturing companies responded, of which 47 were Government companies, 817 were public limited companies and 290 were private limited companies2. The analysis is based on the data provided by these companies for the last 13 quarters i.e. Q1:2009-10 to Q1:2012-13. The data tables are given in Annex. I. Findings of Survey I.1 Order Books: Average new orders of 467 respondent companies increased by 2.8 per cent in Q1: 2012-13 over the previous quarter (Chart 1, Table 1). The year-on-year growth of new orders at 19.4 per cent was higher than that observed in the recent past and may partly be due to lower base. It was also observed that the pending orders increased possibly due to inability to fully meet the new orders.
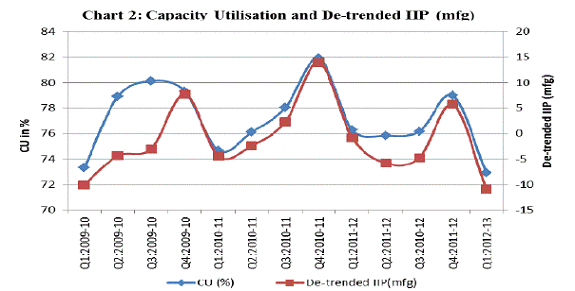
I.2 Capacity Utilisation (CU): CU level of the respondent companies declined from a high of 79 per cent recorded in Q4:2011-12 (partly reflecting seasonality) to 72.9 per cent in Q1: 2012-13. The current CU level is the lowest in last 13 quarters. The movement of CU is in line with de-trended Index of Industrial Production (IIP) for manufacturing sector (Chart 2, Table 2).
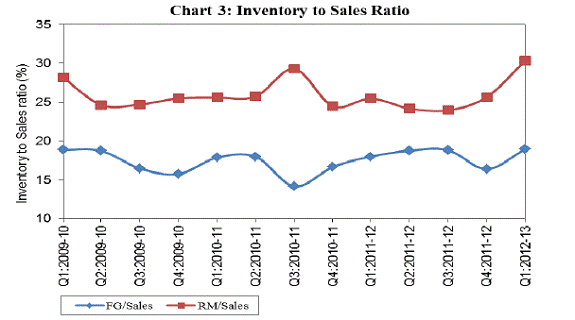
I.3 Inventories: Both the average finished goods (FG) inventory and average raw material (RM) inventory of 906 respondent companies grew at higher rates during Q1: 2012-13 as compared with those in the previous quarter. This has reversed the moderation in FG inventory to sales ratio observed during Q4:2011-12. RM inventory to sales ratio rose noticeably in Q1: 2012-13 (Chart 3, Table 3) which may be partly due to higher new order growth.
IV. Conclusion There is some evidence of pick-up in the new orders in the manufacturing sector. However, this has not been reflected in the level of capacity utilisation which remained at the lowest level in 13 quarters. Increase in pending order and higher RM to sales ratio could possibly be due to a lag in servicing the new orders during the quarter.
* Prepared in the Division of Enterprise Survey of Department of Statistics and Information Management. The previous article on the subject based on the 17th survey round (January-March 2012) was published in August 2012 Bulletin. 1 The survey schedule and methodology used for the analysis have been provided in the article Quarterly Order Books, Inventories and Capacity Utilisation Survey: April-June 2011 (Round 14) in December 2011 Bulletin. 2 The number of respondents for different segments varied as indicated against the parameter. |
||||||||||||||||||||||||||||||||||||||||||||||||||||||||||||||||||||||||||||||||||||||||||||||||||||||||||||||||||||||||||||||||||||||||||||||||||||||||||||||||||||||||||||||||||||||||||||||||||||||||||||||||||||||||||||||||||||||||||||||||||||||||||||||||||||||||||||||||||||||||||||||||||||||||||||||||||||||||||||||||||||||||||||||||||||||||||||||||||||||||||||||||||||||||
పేజీ చివరిగా అప్డేట్ చేయబడిన తేదీ:


