 IST,
IST,


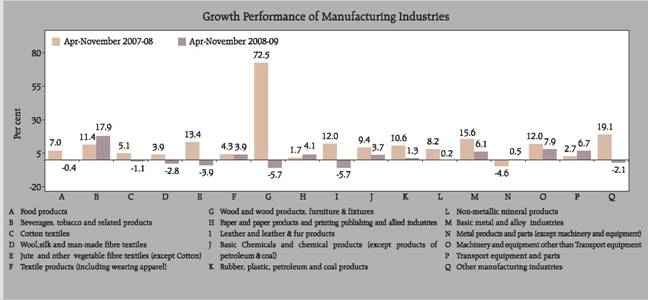
30: IIP - Seventeen Major Industry Groups of Manufacturing Sector (Base : 1993-94 = 100 )
Industry Group |
Industry |
Weight |
Annual |
Cumulative |
Monthly |
||||
2005-06 |
2006-07 |
2007-08 (P) |
April -November |
November |
|||||
2007-08 |
2008-09 P |
2007 |
2008 P |
||||||
1 |
2 |
3 |
4 |
5 |
6 |
7 |
8 |
9 |
10 |
Manufacturing Index |
79.36 |
234.2 |
263.5 |
287.2 |
276.7 |
287.9 |
278.9 |
285.7 |
|
20-21 |
Food Products |
9.08 |
170.6 |
185.2 |
198.2 |
149.6 |
149.0 |
166.6 |
172.9 |
22 |
Beverages, Tobacco and Related Products |
2.38 |
400.3 |
444.5 |
498.0 |
488.4 |
575.6 |
508.3 |
581.9 |
23 |
Cotton Textiles |
5.52 |
137.0 |
157.3 |
164.0 |
163.0 |
161.3 |
153.9 |
153.8 |
24 |
Wool, Silk and Man-made Fibre Textiles |
2.26 |
248.9 |
268.4 |
281.2 |
276.1 |
268.4 |
286.0 |
253.3 |
25 |
Jute and Other Vegetable Fibre Textiles (Except Cotton) |
0.59 |
107.7 |
90.7 |
120.7 |
119.1 |
114.5 |
114.6 |
120.5 |
26 |
Textile Products (Including Wearing Apparel) |
2.54 |
255.5 |
285.0 |
295.5 |
292.4 |
303.8 |
272.4 |
288.8 |
27 |
Wood and Wood Products, Furniture and Fixtures |
2.70 |
70.5 |
91.0 |
127.9 |
127.0 |
119.7 |
108.8 |
118.3 |
28 |
Paper and Paper Products and Printing, Publishing and Allied Industries |
2.65 |
228.6 |
248.6 |
255.3 |
251.7 |
262.0 |
255.8 |
256.2 |
29 |
Leather and Leather & Fur Products |
1.14 |
149.3 |
150.2 |
167.8 |
166.0 |
156.5 |
167.7 |
145.8 |
30 |
Chemicals and Chemical Products (Except Products of Petroleum and Coal) |
14.00 |
258.5 |
283.4 |
313.4 |
313.6 |
325.1 |
297.9 |
291.5 |
31 |
Rubber, Plastic, Petroleum and Coal Products |
5.73 |
200.5 |
226.3 |
246.4 |
243.1 |
246.2 |
241.3 |
315.4 |
32 |
Non-metallic Mineral Products |
4.40 |
271.1 |
305.8 |
323.2 |
320.1 |
320.8 |
304.9 |
311.9 |
33 |
Basic Metal and Alloy Industries |
7.45 |
227.0 |
278.9 |
312.7 |
304.7 |
323.4 |
307.1 |
324.2 |
34 |
Metal Products and Parts, Except Machinery and Equipment |
2.81 |
164.4 |
183.2 |
172.9 |
164.6 |
165.4 |
160.3 |
146.3 |
35-36 |
Machinery and Equipment Other Than Transport Equipment |
9.57 |
312.8 |
357.1 |
394.4 |
379.5 |
409.6 |
387.8 |
409.2 |
37 |
Transport Equipment and Parts |
3.98 |
319.7 |
367.7 |
378.4 |
369.4 |
394.3 |
389.7 |
355.1 |
38 |
Other Manufacturing Industries |
2.56 |
276.9 |
298.4 |
357.4 |
342.4 |
335.3 |
430.1 |
357.3 |
Source : Central Statistical Organisation, Government of India. |
|||||||||

এই পেজটি শেয়ার করুন:


রিজার্ভ ব্যাঙ্ক অফ ইন্ডিয়া মোবাইল অ্যাপ্লিকেশন ইনস্টল করুন এবং সাম্প্রতিক সংবাদগুলিতে দ্রুত অ্যাক্সেস পান!
আমাদের অ্যাপটি ইনস্টল করতে QR কোডটি স্ক্যান করুন


পেজের শেষ আপডেট করা তারিখ:


