RbiSearchHeader

Press escape key to go back

Past Searches

Theme
Theme
Text Size
Text Size
S2

RbiAnnouncementWeb

RBI Announcements
RBI Announcements

Asset Publisher

83126625

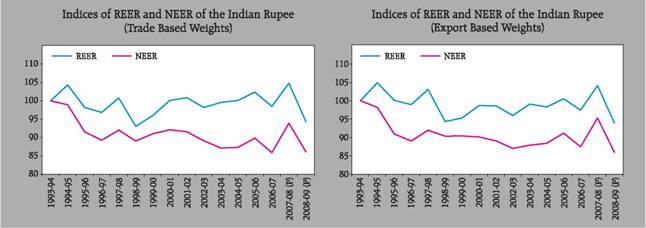
50. Indices of Real Effective Exchange Rate (REER) and Nominal Effective Exchange Rate (NEER) of the Indian Rupee

(36-Currency Export and Trade Based Weights) (Base: 1993-94=100)*


Year


Trade Based Weights

Export Based Weights


Year


Trade Based Weights

Export Based Weights

REER

NEER

REER

NEER

REER

NEER

REER

NEER

1

2

3

4

5

1

2

3

4

5

1993-94

100.00

100.00

100.00

100.00

2006-07

April

98.16

87.73

97.11

89.18


May

96.43

85.43

95.67

87.12

1994-95

104.32

98.91

104.88

98.18


June

96.60

85.11

95.61

86.61


July

95.75

84.22

94.80

85.74

1995-96

98.19

91.54

100.10

90.94


August

95.64

83.61

94.66

85.13


September

98.00

84.65

96.78

86.05

1996-97

96.83

89.27

98.95

89.03


October

99.96

86.18

98.64

87.53


November

100.35

86.50

99.31

88.12


December

99.14

85.89

98.25

87.68

1997-98

100.77

92.04

103.07

91.97


January

100.69

87.05

99.53

88.72


February

100.55

87.21

99.39

88.87


March

100.53

87.11

99.35

88.85

1998-99

93.04

89.05

94.34

90.34

2007-08

April

102.60

91.80

101.88

92.89


May

106.01

94.69

105.24

95.83

1999-00

95.99

91.02

95.28

90.42


June

105.92

94.97

105.03

96.07


July

105.99

94.84

105.19

96.08

2000-01

100.09

92.12

98.67

90.12


August

105.34

94.38

104.47

95.52


September

105.90

94.65

105.12

95.91

2001-02

100.86

91.58

98.59

89.08


October

106.09

95.29

105.35

96.73


November

104.63

94.27

104.01

95.83

2002-03

98.18

89.12

95.99

87.01


December

104.94

94.68

104.19

96.11


January

104.85

94.29

104.26

95.91


February

103.51

93.11

103.04

94.82

2003-04

99.56

87.14

99.07

87.89


March

101.94

90.01

101.72

91.92


2008-09 (P)

April

101.70

93.26

101.81

93.54

2004-05

100.09

87.31

98.30

88.41


May

97.57

89.04

97.50

89.20


June

97.60

87.65

97.63

87.85

2005-06

102.35

89.85

100.54

91.17


July

97.23

87.04

97.47

87.35


August

99.45

88.60

99.47

88.68

2006-07

98.48

85.89

97.42

87.46


September

95.76

85.42

95.55

85.34


October

92.12

83.23

91.61

82.91


November

92.43

84.69

91.59

84.21

2007-08 (P)

104.81

93.91

104.12

95.30


December

90.30

83.91

89.57

83.47


January

89.75

83.43

88.86

82.86

2008-09 (P)

94.36

86.10

93.94

85.94


February

90.68

84.98

89.68

84.45


March

87.70

81.92

86.48

81.38


2009-10 (P)

April

88.59

82.52

87.47

82.22

* : For “Note on Methodology” and time series data on the indices presented here, please see December 2005 issue of this Bulletin.


RbiTtsCommonUtility

PLAYING
LISTEN

Related Assets

RBI-Install-RBI-Content-Global

RbiSocialMediaUtility

Install the RBI mobile application and get quick access to the latest news!

Scan Your QR code to Install our app

RbiWasItHelpfulUtility

Was this page helpful?