 IST,
IST,


Census on Foreign Liabilities and Assets of Indian Direct Investment Companies: 2014-15
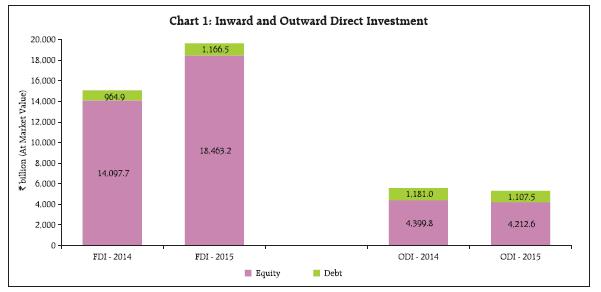
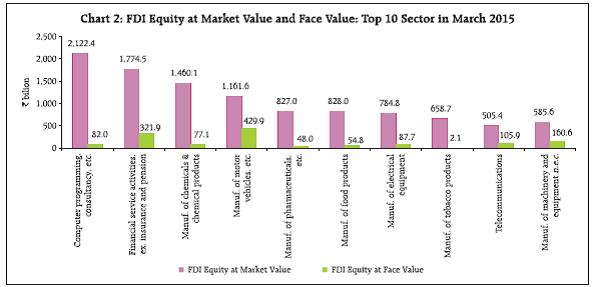
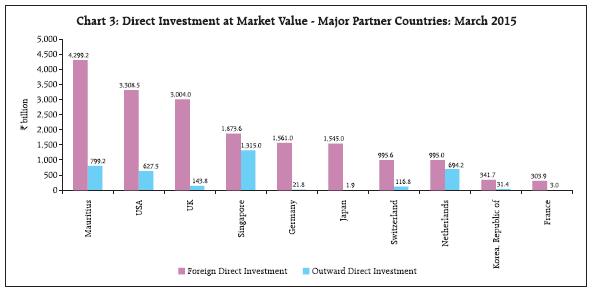
The Annual Census on Foreign Liabilities and Assets (FLA) covers Indian resident companies which received Foreign Direct Investment (FDI) and/or made Overseas Direct Investment (ODI). This article presents the major findings of 2014-15 round of FLA Census covering 16,242 companies, of which, 14,296 companies (including foreign subsidiaries) reported inward investment. The results include inward and outward direct investment position at face value and market value and country/sector profile of FDI in India. Sale/Purchase (both domestic and export/ import) under Foreign Affiliates Trade Statistics (FATS) at aggregate level for overseas subsidiaries of ODI companies and sector-wise for foreign subsidiary companies in India are also presented.1 I. Introduction Direct Investment (DI) is a core component of cross-border capital flows, where an investor resident in another economy has lasting management interest in an enterprise in the recipient economy, by making an investment that gives control (50 per cent or more equity share) or a significant degree of influence (10 per cent or more equity share) over the management of the enterprise. A direct investor can be an individual, a group of related individuals, an incorporated or unincorporated enterprise (public or private), a group of related enterprises, government, trusts or other organisations that own enterprise(s). From a country’s balance of payments (BoP) point of view, surplus/deficit in current account are financed by other transactions including FDI, which leads to net change in asset ownership for the nation. Large changes in cross-border assets/liabilities have potential to lead to global imbalances and financial stability issues arising out of quicker transmission of localised stress conditions. Accordingly, the International Monetary Fund (IMF) has focused efforts on improving the availability and timeliness of cross-border investment data. These data collection efforts include Coordinated Portfolio Investment Survey (CPIS) and Coordinated Direct Investment Survey (CDIS), which are designed to improve the availability and quality of comparable cross-border portfolio and direct investment data, both overall and by immediate counterpart economy. In 2011, the Reserve Bank prescribed the mandatory Annual Return on Foreign Liabilities and Assets (FLA)2 for the Indian companies which have received FDI and/or made direct investment overseas in the previous year(s) including the latest year. In case of a FDI/ODI subsidiary company (i.e., single foreign investor holding is more than 50 per cent of total equity), information on exports, imports, domestic sales and purchases are also collected as a part of Foreign Affiliates Trade in Services (FATS) statistics. FLA census data are used as input in compilation of BoP, CPIS, CDIS and International Investment Position (IIP) statistics. Detailed data on partner country-wise inward and outward direct investment (debt and equity), at market prices, are made available on IMF’s web-site http://data.imf.org/CDIS for the CDIS participating countries, including India. While FLA census data contain comprehensive information on market value of foreign liabilities and assets of Indian companies arising on account of FDI, ODI and other investments, changes in outstanding position would be different from BoP flows during a year, as the former would also include valuation changes due to price and exchange rate movements. II. Coverage For the 2014-15 round of FLA census, 17,642 companies responded3, of which 16,242 companies had outstanding FDI/ODI in their balance sheet in March 2015. Of these 16,242 companies, 84.2 per cent had only inward FDI, 11.9 per cent had only ODI and 3.9 per cent had bi-directional direct investment (Table 1). The previous annual article in the series covered 17,211 companies that submitted FLA return for 2013-14, of which 15,778 companies had reported outstanding FDI/ ODI4. Of the 14,296 companies, which reported inward direct investment, 13,968 were unlisted and 10,777 were Indian subsidiaries of foreign companies. As such, at the aggregate level, FDI share in total equity of reporting companies was high at 74.0 per cent (63.6 per cent for financial companies and 76.2 per cent for non-financial companies). III. FDI and ODI: Face Value and Market Value In the FLA census, companies report information on equity capital both at face value as well as at market value. In case of listed companies, shares are valued at market price on the closing date of the reference period (i.e., end-March). Nearly 98 per cent of the companies that reported inward direct investment were unlisted. They were advised to use the Own Fund of Book Value (OFBV) method for market valuation, described in IMF’s CDIS Guide 2010. OFBV of equity investment is the share of non-resident equity holding in the net worth of the company (i.e., sum of paid-up equity capital, participating preference shares, reserves and surplus). The market value of FDI stock of the reporting companies in India increased by ₹4,567.1 billion (including investment flows and valuation changes) during 2014-15 and stood at ₹19,629.7 billion in March 2015, of which nearly 94 per cent was held in equity. On the other hand, the stock of ODI decreased by ₹260.7 billion during the year to ₹5,320.1 billion. Thus, at market value, the ratio of outward to inward direct investment declined from 37.1 per cent in March 2014 to 27.1 per cent in March 2015 and the related gap increased from ₹9,481.8 billion to ₹14,309.6 billion over this period (Chart 1). Of the reported total FDI equity stake of ₹3,577.9 billion at face value, 84.7 per cent was in non-financial companies. The market-value to face value ratio of FDI companies’ equity stood at 5.2 in March 2015 at aggregate level, but it varied widely considerably across sectors (Chart 2). IV. Sector-wise Distribution of Inward Direct Investment At face value, the share of manufacturing sector (47.4 per cent) in total FDI equity stake of the 14,296 FDI companies was higher than services sector (42.3 per cent) (Table 2). Motor vehicles group in manufacturing sector and financial and insurance activities in services sector had high share at face value of investment. On the other hand, manufacturing sector accounted for more than half of the FDI at market value, which stood at ₹10,208.1 billion in March 2015. Within manufacturing sector chemicals and related products had highest share followed by pharmaceuticals and motor vehicles groups. ‘Information and communication services’ (18.1 per cent) and ‘financial and insurance activities’ (11.8 per cent) were the major FDI-attracting services activities. The top 10 FDI sectors, in terms of market value, accounted for 58.0 per cent of FDI equity at market value and 38.3 per cent of FDI equity at face value (Chart 2). It may be observed that the ratio of market value to face value is highly diverse even across these major sectors, the highest being for manufacturing of tobacco, etc., and lowest for motor vehicles manufacturing group. The major sector-wise break-up of FDI at market value is presented in Table 3. During 2014-15, inward FDI equity increased by 10.2 per cent at face value and 33.5 per cent in Rupee terms at market value. These changes in outstanding position consider inflows/outflows and exchange rate changes during the year for both face value and market value. In addition, the market value – as the name suggests – also includes market price valuation changes. The relatively big surge in FDI market value indicates large valuation gains during the year. (Table 4) Activity-wise FDI equity participation evidences that, in terms of face value, ‘Manufacture of machinery and equipment’ witnessed highest growth during the year. Other major activities showing significant growth in fresh investments include ‘Finance and Insurance Activities’, ‘Manufacture of coke and refined petroleum products’, ‘Information and communication’ and ‘Construction’. The surge in valuation gains was widespread as most of the sectors recorded a large increase in FDI Equity at market value. Mining and Tobacco sectors were the major sectors that recorded valuation losses. V. Source/Destination of Direct Investment The volume of direct investment by top ten source/ destination countries are presented in Chart 3 along with their amount of inward/outward investments, for instances where these were also investment destinations for Indian direct investors. Among the sources of inward DI, investors from Mauritius had the largest share (21.9 per cent) followed by the USA (16.9 per cent) and the UK (15.3 per cent). These ten countries accounted for 92.9 per cent in FDI and 70.6 per cent in ODI. Singapore was the major destination (24.7 per cent share) in ODI followed by Mauritius (15.0 per cent) and Netherlands (13.0 per cent). VI. Other Investment Direct investment companies also report their other financial liabilities and assets separately under ‘other investment’ in the FLA census. These include claims and liabilities in terms of trade credit, loans, currency and deposits and other receivable and payable accounts with unrelated (third party) non-resident entities, but exclude inter-company debt transactions (e.g., borrowing and lending of funds between direct investors and subsidiaries, associates, parent companies, sister companies and branches), which are included under direct investment. Loans include external commercial borrowings, financial leases and repurchase agreements, and other loans and advances. If the reporting DI company is bank, non-resident deposits as well as any credit balance in VOSTRO accounts and overdue in NOSTRO accounts are included against currency and deposits under the head ‘outstanding liabilities’. Credit balances in NOSTRO accounts and debit balances in VOSTRO accounts are treated similarly under the head ‘outstanding claims’. Miscellaneous receivables and payables (e.g., accounts relating to interest payments in arrears, loan payments in arrears, outstanding wages and salaries, prepaid insurance premium, outstanding taxes) are also included here. Such ‘other investment’ liabilities of reporting companies stood at ₹12,822 billion at end-March 2015 and corresponding overseas assets amounted to 33.4 per cent of these liabilities (35.0 per cent previous year). While the share of currency and deposits in other investment liabilities have increased to 19.7 per cent in 2014-15 (from 17.0 per cent last year), the share of loans declined to 41.3 per cent (47.6 per cent a year ago) and trade credits to 19.0 per cent (21.1 per cent a year ago). Among the corresponding overseas assets, the shares of loans, trade credit and currency and deposits stood at 37.4 per cent, 29.6 per cent and 12.6 per cent, respectively, in March 2015. 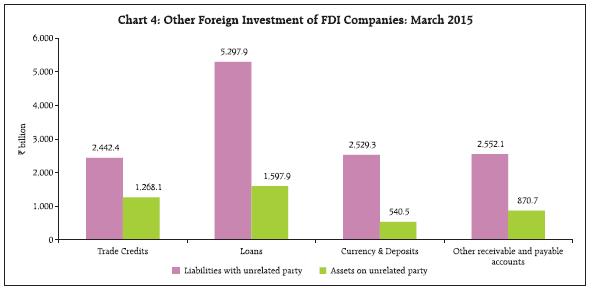 VII. Sale and Purchase of Subsidiary Companies Foreign Affiliates Trade Statistics measure the commercial presence abroad by selling goods and/or services through foreign affiliates in the local economy. While FDI statistics include all foreign interests amounting to 10 – per cent or more voting power, FATS comprise all affiliates that are foreign-controlled subsidiaries (i.e., single direct investor’s holding is more than 50 per cent of equity). Thus, FDI and FATS reflect two related aspects of the role of multinationals in the global economy. While FDI involves monetary value of investment flows and stocks in companies where foreign investor has lasting interest, FATS relates to economic activity (mainly sales, expenditures, exports and imports) of companies, where foreign investor has majority stake. Of the 2,573 Indian companies that reported outward direct investment, 2,129 companies had total 3,608 overseas subsidiaries, whose data were considered for outward FATS. Many of the subsidiary companies did not report sale/purchase/export/import, as they could be at incipient stage or other possible reasons. Exports amounted to 26.7 per cent of total sales whereas imports accounted for 46.7 per cent of total purchase of Indian subsidiaries during 2014-15 (Table 5). Inwards FATS data collected from 10,777 Indian subsidiaries among the 16,242 companies that reported inward direct investment indicate that, at the aggregate level, exports amounted to 34.0 per cent of total sales whereas imports accounted for 44.9 per cent of total purchases of these companies. Total sales, including exports, of 10,777 foreign subsidiaries increased by 11.8 per cent to ₹16,590.4 billion in 2014-15 (₹14,835.7 billion in 2013-14). The share of manufacturing sector in total sales moderated to 61.5 per cent from 63.6 per cent in the previous year, as the share of service sector increased to 35.6 per cent from 33.2 per cent over this period. ‘Information and communication services’ had highest share of 18.1 per cent in sales, of which, exports accounted for over three-fourths. Total purchase (including imports) of foreign subsidiaries, increased by 10.4 per cent to ₹10,465.6 billion in 2014-15 (₹9,480.3 billion in 2013- 14). In tandem with sales, the share of services sector in total purchase also increased, offsetting manufacturing sector’s share. The purchase-to-sales ratio remained around 63 per cent (Table 6). Aggregate exports of the foreign subsidiary companies increased by 15.2 per cent to ₹5,637.4 billion in 2014-15 (₹4,895 billion a year ago) (Table 7). ‘Information and communication services’ remained the major export-oriented sector, where exports accounted for 75.8 per cent in total sales, and this sector had 40.5 per cent share in total exports by reporting subsidiary companies during 2014-15. Share of exports in the sales of ‘Food products’ sector increased from 31.4 per cent in 2013-14 to 51.2 per cent in 2014-15, contributing to an increase in the export-to-sales ratio of manufacturing sector. Total imports of the subsidiary companies increased by 9.9 per cent to ₹4,695.2 billion in 2014-15 (₹4,274.5 billion a year ago). Major importing sectors in manufacturing sector included ‘coke & refined petroleum products’, ‘food products’ and ‘computer, electronic and optical products’. The import share in purchase of ‘Textiles’ and ‘Basic metals’ groups increased considerably. Among major groups, the share of imports in purchase by manufacturing companies was 49.7 per cent as compared with 36.9 per cent for services sector companies. VIII. Conclusions The FLA census results summarised here present interesting major facts relating to their various dimensions, such as, magnitude and divergence of face value and market value of investment, source/ destinations countries, sector-wise distribution of investment and related FATS statistics for subsidiary companies. Since an overwhelming majority of the reporting companies are unlisted, they estimated market value of their investment using the OFBV method. Market value of direct investment by foreign companies in India continued to rise during 2014-15 due to fresh net investment and valuation gains. The increase in Inward FDI was much faster than ODI growth during the year resulting in decline in the ratio of ODI to FDI at market value. At the aggregate level, the ratio of market value to face value of inward FDI equity stood at 5.2 in March 2015. This ratio widely varied across sectors and remained much higher for services sector than the manufacturing sector due to factors such as capital intensity, return on capital and future prospects. India’s trade integration in global village deepened further with the increased activities of cross-border subsidiaries. Sales/purchases of foreign subsidiaries recorded double-digit growth during 2014-15. Foreign trade had a substantial share in the business of both Indian and foreign subsidiary companies. Import share in purchase were broadly comparable for Indian subsidiaries abroad and foreign subsidiaries in India. Export share in sales were higher for foreign subsidiaries in India than for Indian subsidiaries abroad. Information and communication sector continued to be the largest export-oriented sector among foreign subsidiaries in India. * Prepared in the External Liabilities and Assets Statistics Division of the Department of Statistics and Information Management, Reserve Bank of India, Mumbai. The previous article with reference period 2013-14 was published in February 2015 issue of the Reserve Bank of India Bulletin. 1Detailed results relating to this census are released on RBI website (www.rbi.org.in) on December 11, 2015 in form of a Data-Release. 2 These data are collected as per the Reserve Bank’s A. P. (DIR Series) Circular No.45 dated March 15, 2011 under the Foreign Exchange Management Act (FEMA), 1999. The format of Annual Return on Foreign Liabilities and Assets is available on the RBI website (www.rbi.org.in → Forms category → FEMA Forms), and more details are given in the “Foreign Exchange” section under FAQs. 3 As some companies may still report, the results presented here are provisional. 4 Under each round of FLA census, DI companies report data for the preceding two financial years. Any dynamic comparison of the results over census rounds also needs to take into account the coverage across the rounds, which would change due to the following two factors in successive census rounds: (a) improvement in reporting compliance by existing companies and (b) addition/deletion of direct investment companies during the year. |

Share this page:


Install the RBI mobile application and get quick access to the latest news!
Scan the QR code to install our app


Page Last Updated on:


