
Central Government Finances (April-September 2009)* - RBI - Reserve Bank of India


Central Government Finances (April-September 2009)*
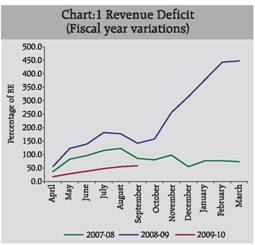
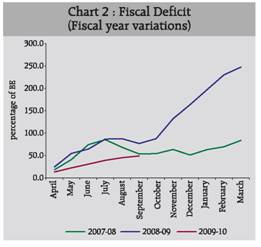
Central Government Finances (April-September 2009)* This article reviews the finances of the Central Government during the first half of 2009-10. The key deficit indicators in absolute terms as well as per cent of GDP were substantially higher than the corresponding period of previous year. However, as proportion of their respective budget estimates, the levels were much lower in the first half of current fiscal year than that of the previous year. The higher levels of budgeted deficits for the current fiscal year reflect fiscal stimulus measures to contain economic slowdown. Revenue receipts declined and lagged behind those of budget estimates due to lacklustre performance of tax revenues, while expenditure kept up with the momentum envisaged in the budget estimates. Finances1 of the Central Government during April-September 2009 indicate that all the key deficit indicators as per cent of GDP widened significantly over the corresponding period of the previous year. Revenue receipts declined while aggregate expenditure increased during the period. Growth in revenue receipts declined due to decline in tax revenue. The rate of growth of non-tax revenue was, however, higher due to larger dividend and profit transfer from government owned financial institutions. Capital expenditure grew at a much higher rate than corresponding period of previous year. Major Trends A. Deficit Indicators The Union Budget 2009-10 continued with the expansionary fiscal stance adopted by the Central Government since the second half of 2008-09 to contain the slowdown in the Indian economy emanating from the global financial crisis. This necessitated the deferment in attaining the FRBM targets during 2009-10 as well. Revenue deficit (RD) was budgeted to increase further by 0.2 per cent of GDP to Rs.2,82,735 crore (4.8 per cent of GDP) over the provisional accounts of 2008-09. During the first half of 2009-10, RD at Rs.1,64,983 crore formed 2.8 per cent of GDP, significantly higher than 1.5 per cent of GDP during April-September 2008. As per cent of budget estimates, RD at 58.4 per cent, however, was far lower than the corresponding period of previous year (Table 1). The trend in RD as per cent of budget estimates during the first-half also indicates that it was lower than the previous two years (Chart 1). Gross fiscal deficit (GFD) for 2009-10 was budgeted to increase further by 0.6 percentage points of GDP to Rs.4,00,996 crore over the provisional accounts of 2008-09. During the first half of 2009-10, GFD stood at Rs.1,97,775 crore and formed 3.4 per cent of GDP, higher than the corresponding period of previous year. However, as per cent of budget estimates, it formed 49.3 per cent and was markedly lower than the first-half of previous year. The trend in GFD as per cent of budget estimates during the first-half also indicates that it was lower than the previous two fiscal years (Chart 2).
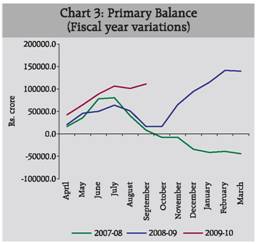
Gross primary deficit at Rs.1,11,106 crore (1.9 per cent of GDP) during April-September 2009 was much higher than the corresponding period of previous year at Rs.16,593 crore (0.3 per cent of GDP) (Chart 3). It formed 63.3 per cent of the budget estimates for 2009-10.
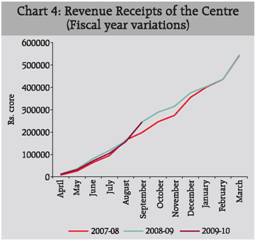
B. Revenue Position Reflecting the combined impact of economic slowdown and rate cuts in indirect taxes, on tax revenue, revenue receipts during April-September 2009 declined by 0.2 per cent to Rs.2,44,471 crore as against an increase of 23.7 per cent in the corresponding period of previous year. The decline was despite a marked improvement in the collection of non-tax revenue (Statement 1 and Chart 4).
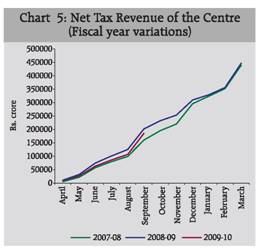
As per cent of budget estimates non-tax revenue, at 41.9 per cent, was lower than the first half of the previous year (44.5 per cent). Tax Revenue Gross tax revenue during April-September 2009 declined by 7.6 per cent to Rs.2,58,880 crore, in contrast to a high growth of 25.3 per cent during April-September 2008. As per cent of budget estimates, at 40.4 per cent, it was marginally lower than that of the first half of previous year. This largely reflected the expectation of high tax buoyancy in budget 2008-09, while a significant decline was expected in the same during 2009-10 due to tax cuts and lower economic growth. Taxes assigned to States/ UTs declined by 6.0 per cent as against the increase of 24.1 per cent in previous year. The net tax revenue to the Centre (adjusted of taxes assigned to States/UTs and surcharge for financing National Calamity Contingency Fund) declined by 8.2 per cent, while it grew by 26.0 per cent during the first-half of the previous year (Table 2, Chart 5 and Statement 2). All the major taxes either decelerated or declined during April-September 2009.
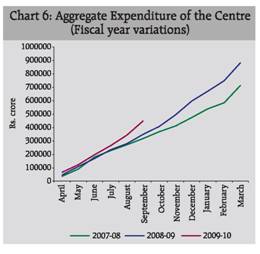
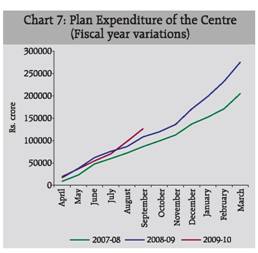
Economic slowdown and decline in the corporate profits led to deceleration in the collection of income tax and corporate tax to 2.9 per cent and 7.7 per cent from 30.7 per cent and 38.2 per cent, respectively during the first half of previous year. The rate cuts combined with lower industrial growth (though improving in the recent months) led to decline in collection in Union excise duties by 22.9 per cent as against an increase of 6.6 per cent in the first-half of previous year. Large scale decline in imports, both due to economic slowdown and fall in the prices of crude oil, led to decline in the collection of customs duties by 32.9 per cent, while it increased by 16.9 per cent in the corresponding period of previous year. Non-Tax Revenue Non-tax revenue, on the other hand, increased by 37.9 per cent to Rs.58,802 crore, significantly higher than the growth of 13.9 per cent in the corresponding period of previous year. The improvement in non-tax revenue collection was on account of larger dividend and profit transfers from the government owned financial institutions. C. Non-Debt Capital Receipts Non-debt capital receipts comprising recovery of loans and other receipts at Rs.6,602 crore was much higher than the previous year, despite the budget estimates for 2009-10 being significantly lower than that of 2008-09. Thus, non-debt capital receipts during April-September 2009 exceeded the budget estimates for the full year (123.5 per cent), as against 10.4 per cent in the previous year. D. Expenditure Pattern Aggregate expenditure during the first half of 2009-10 at Rs.4,48,848 crore registered a growth of 28.6 per cent on top of an increase of 23.6 per cent in the first half of 2008-09 (Chart 6). In view of the much higher budget estimates for 2009-10 than 2008-09, aggregate expenditure as per cent of budget estimates, however, was lower in the first half of 2009-10 than the first half of 2008-09. Plan Expenditure Plan expenditure at Rs.1,26,778 crore, however, increased at a lower rate of 16.9 per cent than that of 25.0 per cent in the first half of 2008-09 (Chart 7). As per cent of budget estimates, at 39.0 per cent, it was lower than 44.6 per cent in the preceding year. This was mainly due to rural development on which the budgetary allocation for 2009-10 was nearly doubled but the utilisation rate up to the first half was substantially lower than the previous year. The plan expenditure under rural development, agriculture, women and child development, road transport and health and family welfare however increased while that of drinking water supply declined during the period April-September 2009 as compared with the corresponding period of previous year.
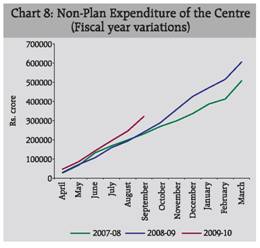
The deceleration in plan expenditure was on account of revenue component which increased by 15.4 per cent to Rs.1,08,163 crore, against the much higher increase of 31.0 per cent in the previous year. The increase in plan revenue expenditure was mainly due to increase in expenditure on social services. The capital component, however, increased by 26.4 per cent to Rs.18,615 crore in contrast with a decline of 3.0 per cent in the previous year. However, because of the much higher envisaged plan expenditure for 2009-10 than in 2008-09, both the components of plan expenditure as per cent of budget estimates were lower during the first half 2009-10 than in the first half of 2008-09 (Table 4 and Statement 1). Non-Plan Expenditure Non-plan expenditure at Rs.3,22,070 crore during April-September 2009 registered a substantially higher growth of 33.8 per cent as compared with 23.0 per cent in the corresponding period of previous year (Chart 8). As per cent of budget estimates, it formed 46.3 per cent, lower than 47.4 in the previous year. The higher growth in non-plan expenditure was observed in both the revenue and capital components, but the growth in the latter was much higher than in the former. The increase in non-plan revenue expenditure was mainly accounted for by pension (growth of 73.7 per cent) and defence (growth of 50.2 per cent), which are the expenditures related to the implementation of Sixth Pay Commission award (Table 4).
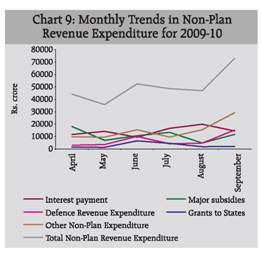
Interest payments and subsidies are the major items under non-plan revenue expenditure (Chart 9). Interest payments increased marginally by 0.7 per cent to Rs.86,669 crore during April-September 2009 over the corresponding period of previous year. Major subsidies increased by 20.2 per cent to Rs.66,013 crore. The share of interest payments and subsidies in non-plan revenue expenditure declined substantially to 50.7 per cent from 61.4 per cent during the corresponding period of the previous year.
Capital Outlay Capital outlay during the first half of 2009-10 increased substantially by 65.8 per cent to Rs.34,331 crore, as against the increase of 13.3 per cent in first half of the previous year. The increase was mostly in defence capital outlay, which increased by 111.8 per cent. Non-defence capital outlay also increased by 34.5 per cent as against a decline of 2.1 per cent during the first half of previous year (Table 4). E. Financing of Gross Fiscal Deficit The front loading of market borrowing programme of the Central Government for 2009-10 during the first half of 2009-10 meant that the net market borrowings far exceeded gross fiscal deficit. Net market borrowings constituted 146.5 per cent of the GFD. There were also net inflow of resources on account of state provident funds, national small savings fund and external assistance to finance the GFD. On the other hand, the contributions from 14-day Treasury Bills and other capital receipts were negative. However, due to the surplus net market borrowings, there was substantial accumulation of funds in the investment of surplus cash account and the cash balances account together amounting to 34.2 per cent of GFD. Gross market borrowings this year as on November 23, 2009 stood at Rs.4,06,369 crore (including 28,000 crore towards de-sequestering of MSS cash account) (82.8 per cent of BE) as against Rs.1,63,904 crore (47.8 per cent of BE) during the corresponding period of the previous year. The corresponding net market borrowings were Rs.3,45,376.crore (86.8 per cent of BE) and Rs.97,816 crore (36.7 per cent of BE). Cash Management During 2009-10 (upto November 21, 2009), the Central Government took recourse to ways and means advances for 76 days as compared with 20 days during the corresponding period of 2008-09. Commencing the year with a surplus cash balance of Rs.16,319 crore (end-March 2009), the Central Government used up these balances to meet its expenditure needs and resorted to the WMA between April 4, 2009 and June 15, 2009; between July 6th and 7th 2009; and on July 9, 2009. Out of this period, Government resorted to overdraft on 44 days. The daily average utilisation of overdraft till November 21, 2009 stood at Rs.1,995 crore. With the inflow of indirect taxes and surplus transferred from the Reserve Bank, the cash balances turned into surplus between June 16, 2009 and July 5, 2009. The average daily utilisation of WMA by the Central Government (up to November 21, 2009) was Rs.5,351 crore as compared with Rs.462 crore in the corresponding period of the preceding year. There was no overdraft in corresponding period of last year.
Concluding Observations and Broad Assessment Finances of the Central Government during the first half of 2009-10 show that the key deficit indicators as a ratio to GDP were much larger than in the corresponding period of previous year. This was, however, expected as the envisaged deficit targets for 2009-10 were at least three times higher than those envisaged in the Budget for 2008-09. The deficit indicators as a proportion of the budget estimates during the first half of 2009-10 were, however, markedly lower than those during the first half of 2008-09. Revenue receipts remained subdued, in fact declined, due to the combined impact of continued economic slowdown and cuts in indirect tax rates. Thus, so far, revenue receipts have lagged behind those envisaged in the budget estimates. However, the pace of deceleration/decline in tax collections has moderated over the months of the first half of 2009-10, reflecting gradual pickup in economic activity. Expenditure, on the other hand, maintained a rising momentum and grew faster than what was envisaged in the Budget. It thus appears that if the envisaged deficit indicators are to be met, the revenue collections, in particular taxes, need to improve substantially in the second half. This would crucially hinge on the revival of the economy.
* Prepared in the Division of Central Finances, Department of Economic Analysis and Policy, Reserve Bank of India. 1 The review in this article is based on the provisional data on Union Government Accounts for April-September 2009, received from the Controller General of Accounts, Ministry of Finance, Government of India. |
|||||||||||||||||||||||||||||||||||||||||||||||||||||||||||||||||||||||||||||||||||||||||||||||||||||||||||||||||||||||||||||||||||||||||||||||||||||||||||||||||||||||||||||||||||||||||||||||||||||||||||||||||||||||||||||||||||||||||||||||||||||||||||||||||||||||||||||||||||||||||||||||||||||||||||||||||||||||||||||||||||||||||||||||||||||||||||||||||||||||||||||||||||||||||||||||||||||||||||||||||||||||||||||||||||||||||||||||||||||||||||||||||||||||||||||||||||||||||||||||||||||||||||||||||||||||||||||||||||||||||||||||||||||||||||||||||||||||||||||||||||||||||||||||||||||||||||||||||||||||||||||||||||||||||||||||||||||||||||||||||||||||||||||||||||||||||||||||||||||||||||||||||||||||||||||||||||||||||||||||||||||||||||||||||||||||||||||||||||||||||||||||||||||||||||||||||||||||||||||||||||||||||||||||||||||||||||||||||||||||||||||||||||||||||||||||||||||||||||||||||||||||||||||||||||||||||||||||||||||||||||||||||||||||||||||||||||||||||||||||||||||||||||||||||||||||||||||||||||||||

Share this page:


Install the RBI mobile application and get quick access to the latest news!


