 IST,
IST,


Changing Dynamics of India’s Remittances – Insights from the Sixth Round of India’s Remittances Survey
|
by Dhirendra Gajbhiye, Sujata Kundu, Alisha George, Omkar Vinherkar, Yusra Anees and Jithin Baby^ This article analyses results of the sixth round of India’s remittances survey conducted for 2023-24. Key findings suggest that the share of advanced economies in India’s inward remittances has risen, surpassing the share of Gulf economies, reflecting a shift in migration pattern towards skilled Indian diaspora. Maharashtra, followed by Kerala and Tamil Nadu continue to be the dominant recipient states. The cost of sending remittances to India is lower than the global average cost, driven by digitalisation but remains higher than the SDG target of 3 per cent for US$ 200. Furthermore, fintech companies offer affordable cross-border remittance services, fostering competition among different remittance service providers. Introduction India’s remittances have more than doubled from US$ 55.6 billion in 2010-11 to US$ 118.7 billion in 2023-24. While financing around half of India’s merchandise trade deficit1, net remittance receipts have been an important absorber of external shocks during this period. Moreover, India’s remittance receipts have generally remained higher than India’s gross inward foreign direct investment (FDI) flows, thus establishing their importance as a stable source of external financing. Furthermore, following a pandemic-induced contraction of 3.6 per cent during 2020-21, remittances to India in the post pandemic period (2021-22 to 2023-24) recorded a resurgence with an average annual growth of 14.3 per cent. Against this backdrop, this article presents the results of the sixth round of the survey on India’s inward remittances conducted for 2023-24.2 It captures various dimensions of inward remittances to India – country-wise source of remittances, state-wise destination of remittances, transaction-wise size of remittances, prevalent modes of transmission, cost of sending remittances to India and share of remittances transmitted through the digital modes vis-à-vis cash. The survey results are based on responses received from 30 authorised dealer (AD) banks (covering around 99 per cent of the total value of inward remittances reported under family maintenance and savings3). The survey also covered two major Money Transfer Operators (MTOs)4 and two fintech companies5 operating in cross-border remittances business. This round of survey has the following enhancements over the previous rounds to improve the coverage and data quality: (i) expanding the coverage of source countries; (ii) classifying the coverage of Rupee Drawing Arrangement (RDA) into exchange houses/MTOs and fintechs; (iii) expanding the range and number of remittance size brackets; (iv) covering cash/digital transfers undertaken by MTOs; and v) including two leading fintech companies providing cross-border remittance services to assess the growing impact of digitalisation. Globally, inward remittances represent the flow of cross-border household income, arising from the temporary or permanent movement of people to foreign economies. Moreover, as defined by the International Monetary Fund (IMF, 2009), two items in an economy’s balance of payments (BoP) statistics relate to remittances – compensation of employees under primary income account and personal transfers under secondary income account. In the case of India, personal transfers, primarily comprising inward remittances for family maintenance from Indian workers residing abroad, and local withdrawals from non-resident deposit accounts, form the major portion of cross-border inward remittances. The rest of the article is organised as follows – Section II presents the stylised facts on global and India’s inward remittances. Section III describes the different channels of receiving remittances in India. Section IV details the findings of the sixth round of the survey. Section V concludes the article with some policy suggestions. World remittances are estimated to reach US$ 905 billion in 2024, with low-and middle-income countries (LMICs) receiving more than 75 per cent (around US$ 685 billion) [Ratha et al., 2024]. According to the World Bank, India has continued to remain the top recipient of remittances since 2008, with its share in world remittances rising from around 11 per cent in 2001 to about 14 per cent in 2024. Going forward, remittances to India are likely to remain elevated and are projected to increase to around US$ 160 billion in 2029 (RBI, 2024).6 Other major recipients of remittances include Mexico, China, Philippines, France, Pakistan, and Bangladesh (Chart 1). While the flow of remittances to India remained resilient albeit with some year-on-year contraction during the pandemic year 2020-21, its resurgence since then has been driven by a recovery in employment conditions in the advanced economies (AEs). 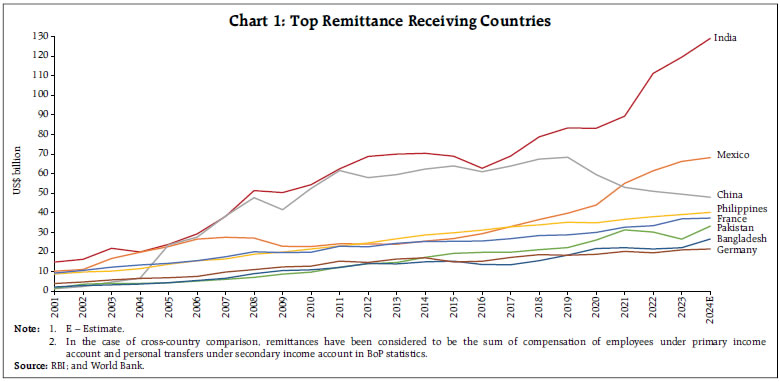 India’s stock of international migrants has tripled from 6.6 million in 1990 to 18.5 million in 2024, with its share in global migrants rising from 4.3 per cent to over 6 per cent during the same period.7 Indian migrants in the Gulf Cooperation Council (GCC) countries account for around half of the total Indian migrants in the world (Chart 2a). Following the competitive edge and the penetration of Indian IT services overseas at the start of the century, the number of skilled emigrants to AEs, especially to the US, has risen significantly (Chakravorty et al., 2016; Khanna and Morales, 2023). Thus, besides GCC countries, AEs have also emerged as a major source of inward remittances to India over the years, reflecting the changing dynamics of India’s diaspora. As India’s working age population is expected to rise till 2048, India would be the world’s leading supplier of labour (RBI, 2024). Thus, the continuous upskilling and reskilling of the workforce would be crucial to leverage its potential. As a ratio to GDP, India’s remittances have hovered around 3 per cent of GDP since 2000, while in the case of China, the ratio has remained below 0.3 per cent (Chart 2b). Philippines, on the other hand, has received much higher remittances as a percentage of GDP during the last ten years. With the increased flow of labour across countries, remittances have become a major source of foreign earnings for many developing countries, especially for small countries where they comprise a large share of their GDP (Ratha et al., 2024). As indicated earlier, in the case of India, inward remittances fund a significant per cent of the merchandise trade deficit (Chart 3a). Further, inward remittances have generally surpassed India’s gross inward FDI since the beginning of the century, and has therefore, emerged as a stable source of foreign earnings (Chart 3b). Cost of Remittances The cost of a remittance transaction includes two elements – the fees charged at any stage of the transaction and the exchange rate conversion from local currency to the currency of the recipient country (World Bank and BIS, 2007). Given the fact that inward remittances are largely for family maintenance, the cost of sending cross-border remittances has socio-economic impact and therefore, reducing this cost has been a crucial policy agenda globally for over a decade. The World Bank’s Remittance Prices Worldwide (RPW) database monitors more than 350 corridors to measure the progress towards the sustainable development goals (SDG) target.8 The global average cost of sending US$ 200 witnessed a secular decline from 9.67 per cent in Q1:2009 to 6.65 per cent in Q2:2024, however, it continues to be higher than both the initial G20 objective (5 per cent) and SDG target (3 per cent) [World Bank, 2024]. However, in the case of India, it is pertinent to mention that with a 4.9 per cent cost of sending US$ 200 in 2023, the cost of sending remittances to India is not only below the world average cost, but has also met the initial G20 target9 reflecting the changing dynamics of remittance costs. Moreover, India continues to remain one of the low-cost countries for sending US$ 200. 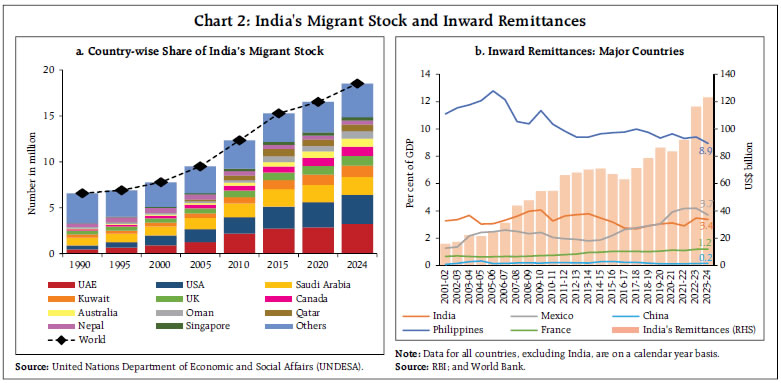 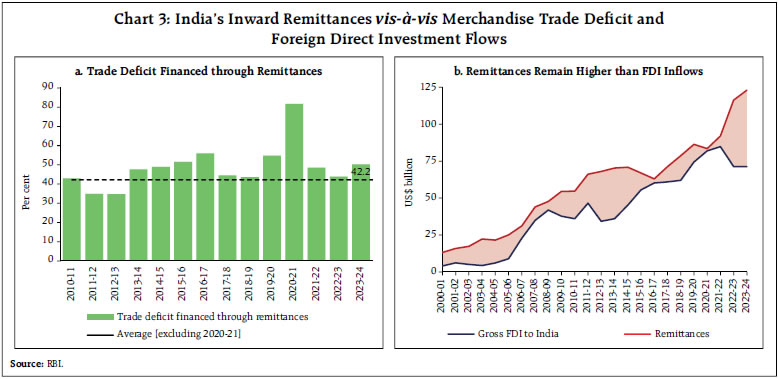 Cash and Digital Transfers The World Bank definition of digital remittances encompasses all such transactions wherein the payment is made online or in self-assisted manner and received into a transaction account (bank or non-bank deposit taking institution), mobile money or e-money account. The proliferation of digital remittances has been rapid over the past few years especially after the COVID-19 pandemic. The MTOs have further enabled digital funding and disbursement. Mobile money-enabled international remittance transfers gained traction during the pandemic period globally, and the Global System for Mobile Communications Association (GSMA) estimated that their value more than doubled from US$ 8 billion in 2019 to US$ 17 billion in 2021, and stood at US$ 29 billion in 2023 (GSMA, 2024). Globally, it has been observed that the average cost of receiving US$ 200 through remtechs10 is significantly lower than that of the banks (RBI, 2024). The cost of digital remittance transfers, which accounted for 30 per cent of the total transactions in the RPW database during Q2:2024, was 5.3 per cent, 136 basis points lower than the global average cost (Chart 4). Similarly, the cost of digital remittances in India was 4.0 per cent as of Q2:2024, around 100 basis points lower than the average cost of 5.0 per cent for India, reflecting the rising role of digitalisation in optimising remittance costs. This underscores the importance of leveraging digital public infrastructure in home and host countries. India has been at the forefront of the efforts to enhance cross-border payments with multiple bilateral arrangements for interlinking India’s Unified Payments Interface (UPI) with other fast payment systems (FPSs) across the world and its participation in Project Nexus to facilitate multilateral linkage of FPSs of four ASEAN Nations (Malaysia, Philippines, Singapore and Thailand) [RBI, 2025]. 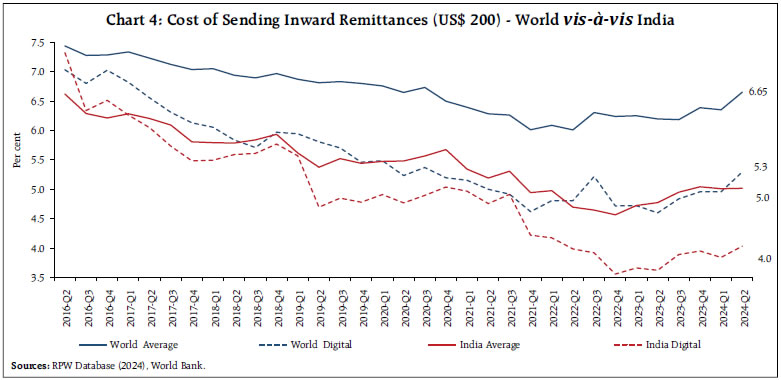 III. Different Channels of Transmitting Inward Remittances to India The remitting country can transfer remittances to India through three channels - (i) overseas banks; (ii) MTOs; and (iii) fintechs (also known as remtechs or digital only MTOs11) [Chart 5]. The overseas banks may either maintain a NOSTRO account of the correspondent bank or open a VOSTRO account with their partner bank in India. The instruction to transfer remittances may be sent using the Society for Worldwide Interbank Financial Telecommunication (SWIFT) messaging service or the bank’s own application programming interface (API). The funds received by the correspondent bank / partner bank can be further sent to the beneficiaries’ account via various payment arrangements such as National Electronic Funds Transfer (NEFT), Immediate Payment Service (IMPS) and Bharat Bill Payment System (BBPS). MTOs transfer funds to India via two schemes – Money Transfer Service Scheme (MTSS)12 and Rupee Drawing Arrangement (RDA)13, while fintechs14 can operate only through the RDA channel.15 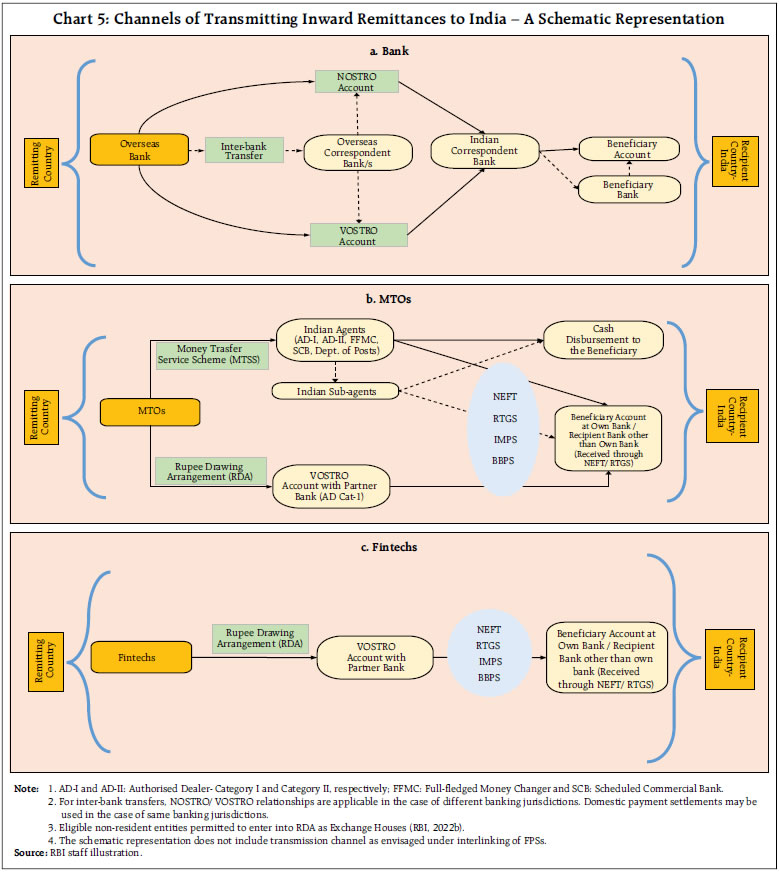 IV. India’s Inward Remittances: Insights from the Sixth Round of the Survey The sixth round of the survey on inward remittances16 for 2023-24 covered 30 AD banks (capturing around 99 per cent of the value of total inward remittances reported under the purpose of family maintenance and savings), two major MTOs, and two fintech companies operating in cross-border remittance business. With the growing digitalisation of remittances, technological innovation is changing the landscape of how remittances are transferred or received. Source of Remittances The results of the survey highlight the gradual shift in dominance of India’s remittances from the GCC countries to the AEs particularly the US, the UK, Singapore, Canada and Australia which together accounted for more than half of the remittances in 2023-24. The share of the US in India’s total remittances remained largest, rising to 27.7 per cent in 2023-24 from 23.4 per cent in 2020-21 (Table 1), reflecting a steady recovery in the US job market. In the US labour force, the percentage rise in the foreign-born workers stood at 6.3 per cent in 2022 from 0.7 per cent in the pre-pandemic year of 2019; however, in the case of native-born workers the share largely remained unchanged at 1.0 per cent.17 Furthermore, 78 per cent Indian migrants in the US are employed in high earning sectors such as management, business, science, and arts occupations (Greene and Batalova, 2024).18 The share of inward remittances received from the UK has also increased to 10.8 per cent in 2023-24 from 6.8 per cent in 2020-21, which may be attributed to the ‘Migration and Mobility Partnership’ (May 2021) between India and the UK.19 The number of Indians emigrating to the UK every year has more than tripled from 76,000 as on end-2020 to about 250,000 as on end-2023, of which about half were for work-related purpose.20 There was also a notable uptick in the share of remittances from Singapore (6.6 per cent), Canada (3.8 per cent) and Australia (2.3 per cent) in 2023-24, when compared especially with the pandemic year (2020-21). In recent years, Canada continues to remain a preferred destination for Indian students pursuing higher education abroad. As on January 2024, out of a total of 13.4 lakh Indian students studying abroad, the share of students studying in Canada stood at 32.0 per cent followed by the US (25.3 per cent), the UK (13.9 per cent) and Australia (9.2 per cent).21 United Arab Emirates (UAE) maintained its position as the second largest source of India’s remittances, with its share increasing from 18 per cent in 2020-21 to 19.2 per cent in 2023-24. UAE is the largest hub for Indian migrant workers engaged primarily in blue-collar jobs which are dominated by the construction industry followed by healthcare, hospitality, and tourism industry.22 This is in stark contrast to the US where Indian migrants are mainly employed in the white-collar jobs, thus explaining the higher remittances received from US despite the lower number of migrants as compared to the UAE. The GCC countries (UAE, Saudi Arabia, Kuwait, Qatar, Oman and Bahrain) together contributed 38 per cent to total remittances received by India in 2023-24, higher than its share recorded in 2020-21 (COVID-19 pandemic year).23 Lower remittances from the GCC region during the pandemic year was due to the mass return of contractual migrant workers from the region back to India. Destination of Remittances Turning to State-wise/Union Territory (UT)-wise destinations of remittances in 2023-24, Maharashtra received the largest share of 20.5 per cent, albeit lower than 2020-21 (35.2 per cent) [Table 2].24 Kerala followed closely with its share increasing to 19.7 per cent from about 10 per cent during the same period, followed by Tamil Nadu (10.4 per cent), Telangana (8.1 per cent), and Karnataka (7.7 per cent). Maharashtra, Telangana and Punjab accounted for the largest number of Indian students migrating abroad for education and staying back for employment opportunities, which is reflected in the increasing share of these states in India’s inward remittances. The Kerala Migration Survey highlights that there was a considerable rise in the number of students among the total emigrants from Kerala in 2023, reflecting a rising trend of younger individuals migrating overseas, especially for educational purpose (Rajan, 2024). Additionally, the report suggests that there has been a significant shift in student migration patterns, with a growing preference for non-GCC countries as destinations. Tamil Nadu and Karnataka also send a large number of students and workers abroad. Remittances: Mode and Size As described in Section III, banks may receive remittances through different modes, among which the RDA channel has the highest share, followed by direct Vostro transfers by overseas banks and the RDA channel operated by fintechs (Chart 6a). The choice of channel used by the sender depends on various factors including the penetration of formal banking channels, charges and speed of delivery (IMF, 2009). Another important factor is the implicit cost in the form of difference in exchange rates. In terms of value (size) of transactions, remittances amounting to more than ₹5 lakhs had the highest share of around 29 per cent in 2023-24 (Chart 6b). Conversely, the highest number of transactions were in the category of remittances size of less than US$ 200 and the share of larger remittances followed a decreasing trend thereon. Since the highest number of remittances are sent in lower values, the SDG goal of bringing down the average cost of sending US$ 200 to 3 per cent or less by 2030 is critical. 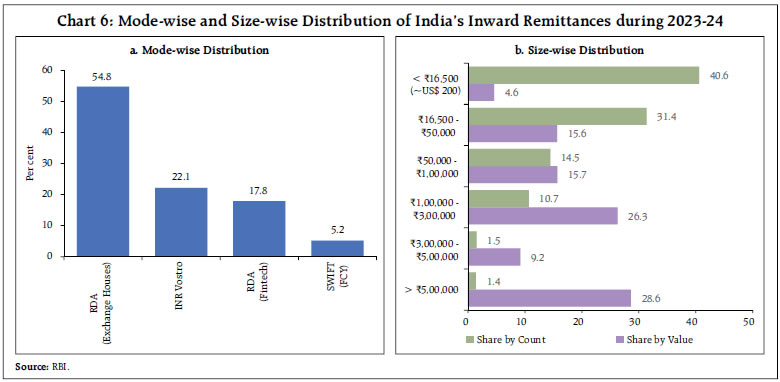 Cost of Inward Remittance As per the latest round of survey, it is found that the cost varies widely depending on the mode of transfer and the size of remittance (Chart 7). The weighted average cost of inward remittance to India stood at 4.6 per cent for transaction size of less than US$ 200 and 2.4 per cent for US$ 200-500 transaction brackets. The weighted average cost of remittance for amounts less than US$ 200 was highest amongst all the transaction brackets recorded in the survey. Furthermore, within the brackets, the cost was highest for foreign currency transactions through correspondent banks’ Nostro accounts, followed by INR transactions through Vostro accounts. The cost of remittances was the lowest through RDA (MTOs and fintechs), irrespective of the size of the remittance. The weighted average cost of remittance drops as the amount of remittance increases on account of lower fixed costs as a ratio to total cost. Fintech companies are found to offer affordable cross-border remittance services, thereby fostering competition among different remittance service providers. 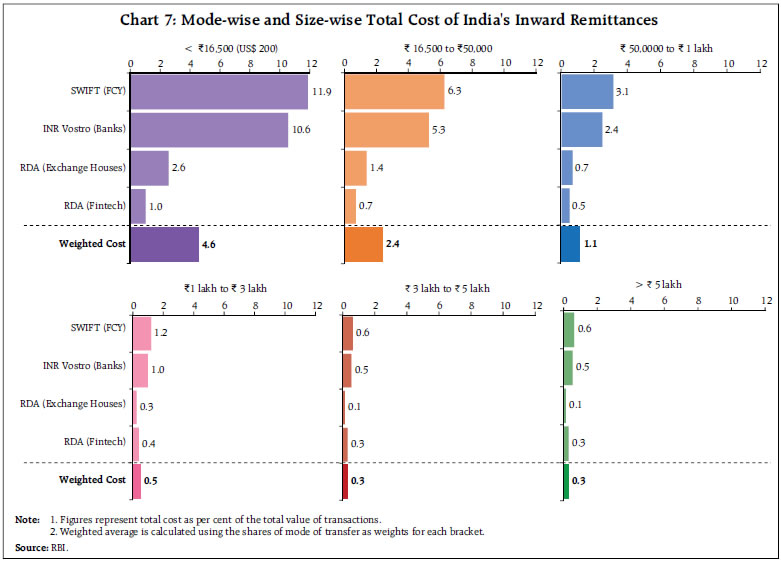 The current survey round also included the share of digital remittance transactions of MTOs, and it was found that, on an average, 73.5 per cent of total remittances were received through the digital mode during 2023-24 (Chart 8). The highest digital share of transactions was observed for remittances received from Saudi Arabia (92.7 per cent), followed by Australia (89.5 per cent), Qatar (76.2 per cent) and UAE (76.1 per cent). 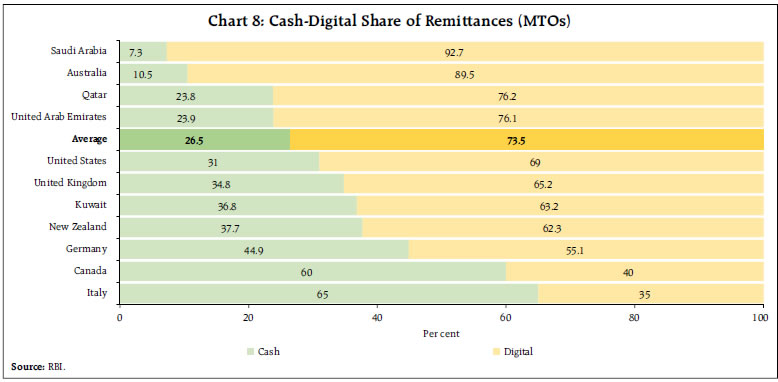 India’s remittances displayed a resurgence during the post-pandemic period, thereby providing a stable source of external financing. The results of the sixth round of the survey on India’s remittances for 2023-24 highlight the changing dynamics of India’s diaspora from the GCC countries as the pre-dominant source economies to the advanced economies. State-wise data revealed that Maharashtra remained the largest recipient, followed by Kerala, Tamil Nadu, Telangana and Karnataka. Furthermore, the RDA channel dominated the mode of transfer for banks. The cost of sending remittances varies widely depending on the mode of transfer and the transaction amount. It was found that the weighted average cost of sending remittances for amounts less than US$ 200 was the highest amongst all the transaction brackets recorded in the survey. Importantly, on an average, 73.5 per cent of total remittances received by the MTOs were through digital mode during 2023-24. This, alongside the lower cost of digital remittances vis-à-vis cash remittances, reflects the significance of the rising penetration of digital infrastructure globally in the remittance landscape. Moreover, the interlinking of cross-border fast payment systems may increase the ease and efficiency of such transactions. Although India’s performance with regard to the reduction in the cost of sending remittances is encouraging, achieving the SDG target would require an integrated policy focus on leveraging India’s digital public infrastructure. Additionally, in order to leverage the potential of the changing dynamics of Indian diaspora, there is a need for a continuous up-skilling and re-skilling of the growing Indian workforce. References Chakravorty, S., Kapur, D. and Singh, N. (2016). The Other One Percent: Indian’s in America. Oxford University Press. Greene, M. and Batalova, J. (2024). Indian Immigrants in the United States. Migration Policy Institute. GSMA. (2024). The State of the Industry Report on Mobile Money 2024. IMF. (2009). International Transactions in Remittances: Guide for Compilers and Users. International Monetary Fund. Khanna, G., and Morales, N. (2023). Did US Immigration Policy Influence India’s IT Boom? Economic Brief, No. 23-42. Federal Reserve Bank of Richmond. Rajan, S.I. (2024). Kerala Migration Survey 2023. Kerala Economy. Vol. 5, No. 3, pp 1-13. Ratha, D., Plaza, S., and Kim, E. J. (2024). In 2024, remittance flows to low- and middle-income countries are expected to reach $685 billion, larger than FDI and ODA combined. World Bank Blogs, December 18. RBI. (2018). Globalising People: India’s Inward Remittances. RBI Bulletin (November). RBI. (2022a). Headwinds of COVID-19 and India’s Inward Remittances. RBI Bulletin (July). RBI. (2022b). Master Direction - Opening and Maintenance of Rupee / Foreign Currency Vostro Accounts of Non-resident Exchange Houses (updated as on December 22, 2022). RBI (2024). Report on Currency and Finance (RCF) 2023-24: India’s Digital Revolution. RBI. (2025). Payment Systems Report. World Bank. (2024). Remittance Prices Worldwide: Issue 50 (June). World Bank and BIS (Committee on Payment and Settlement Systems). (2007). General principles for international remittance services. Bank for International Settlements. Annex
^ The authors are from the Department of Economic and Policy Research of the Reserve Bank of India (RBI). The views expressed in this article are those of the authors and do not represent the views of the RBI. The authors are grateful to Shri Muneesh Kapur and Dr. Sunil Kumar for their valuable comments and guidance. The authors are also grateful for the inputs received from the Authorized Persons and Remittances Division and the External Payments Division of the Foreign Exchange Department, Central Office, RBI. 1 India’s net remittance receipts have financed around 42.0 per cent of the merchandise trade deficit on an annual average basis during 2010-11 to 2023-24 (barring the pandemic year of 2020-21). 2 The fifth round of the survey conducted for 2020-21 was published in the July 2022 issue of the RBI Monthly Bulletin. Earlier survey results were published in November 2006, April 2010, December 2013 and November 2018 issues of the RBI Monthly Bulletin. 3 Pertaining to Foreign Exchange Transactions Electronic Reporting System (FETERS). 4 Western Union Financial Services Inc. and MoneyGram Payment Systems Inc. 6 Chapter 4 - Open Economy Digitalisation: Challenges and Opportunities, Report on Currency and Finance (RCF), 2023-24, RBI. 7 Department of Economic and Social Affairs Database (2024), United Nations. 8 The importance of low cost of remittances was reinforced with its inclusion in the SDG with a target to bring down the average cost of migrant remittances to 3 per cent or less by 2030, and to eliminate corridors where cost is higher than 5 per cent. The targeted indicator is the global average cost of sending US$ 200 (or equivalent in local sending currency) expressed as a per cent of amount sent. 9 The average cost of sending US$ 200 to India for Q1:2024 and Q2:2024 stood at 5.01 per cent and 5.02 per cent, respectively (World Bank, 2024). 10 Fintechs specialising in transferring remittances. 11 A digital-only MTO refers to money transfer operators that send remittances through digital channels (World Bank, 2024). 12 MTSS permits only personal remittances, with a cap of US$ 2,500 per transaction and 30 remittances per beneficiary annually. Transfers for trade, property purchases, investments, or charitable donations are prohibited. It involves tie-ups between overseas money transfer companies (overseas principals) and domestic entities (Indian agents) authorised by the RBI under the Payment and Settlement Systems Act, 2007. 13 RDA enables cross-border remittances through tie-ups between AD Category-I banks in India and non-resident exchange houses through their Rupee Vostro accounts in Gulf countries, Hong Kong, Singapore, Malaysia (for Malaysia only under Speed Remittance Procedure) and all other countries which are Financial Action Task Force (FATF) compliant (only under Speed Remittance Procedure). While such non-resident exchange houses could be fintechs too as per their classification in the remitting jurisdiction, fintechs as a specific category is not envisaged in the RDA scheme. RDA allows private remittances between individuals, with limited provisions for trade-related transactions capped at ₹15 lakh. Unlike MTSS, RDA has no limit on the amount or frequency of personal remittances and is exclusively for inward transfers. 14 Fintechs that hold valid licenses issued by the local monetary/supervisory authority concerned and have necessary authority/license to transact currency exchange/money transfer business. 15 More recently, the RBI is also exploring the interlinking of FPSs. For example, the UPI-PayNow linkage is a pertinent example of how Singapore and India have leveraged the open banking APIs to allow account holders of participating financial institutions in the respective countries to conduct seamless transactions using their individual FPSs. (RBI, 2024). 16 The details of the compilation methodology of inward remittances of top remittance receiving emerging economies along with their remittances surveys, if any, are mentioned in Annex Table A1. 17 Bureau of Labor Statistics, US Department of Labor. Foreign-Born Workers: Labor Force Characteristics. 18 https://datausa.io/profile/soc/management-business-science-arts-occupations 19 https://www.gov.uk/government/news/uk-india-agree-partnership-to-boost-work-visas-for-indian-nationals 20 https://www.ons.gov.uk/peoplepopulationandcommunity/populationandmigration/internationalmigration/bulletins/ 21 Data available from the Lok Sabha Unstarred Question No-894, Ministry of External Affairs, Government of India. 22 https://www.news18.com/business/indian-migrant-workers-middle-east-uae-saudi-arabia-oman-kuwait-jobs-8945228.html 23 Considering the common set of source countries across the surveys, AEs comprised 51.0 per cent of India’s inward remittances, while the share of GCC countries stood at 33.7 per cent in 2023-24. 24 Owing to the pandemic-led reverse migration to India, the share of the traditional remittance recipient states largely dependent on the GCC countries, such as Kerala, Tamil Nadu and Karnataka, almost halved in 2020-21, thereby causing a distributional shift in the state-wise share in remittances (RBI, 2022a). |
||||||||||||||||||||||||||||||||||||

Share this page:


Install the RBI mobile application and get quick access to the latest news!
Scan the QR code to install our app


Page Last Updated on:


