
Composition and Ownership Pattern of Deposits with Scheduled Commercial Banks: March 2013 - RBI - Reserve Bank of India


Composition and Ownership Pattern of Deposits with Scheduled Commercial Banks: March 2013
This article presents an analysis of pattern in composition and ownership of outstanding deposits with scheduled commercial banks (including regional rural banks) during 2006-2013. For this purpose, the data on ownership pattern of deposits as estimated from sample survey for the period from 2006-10 is used along with the census survey data as collected for end-March 2012 and 20131. The analysis brings out broad trends across type of deposit accounts, institutional sectors, population groups and bank groups over the period. Highlights
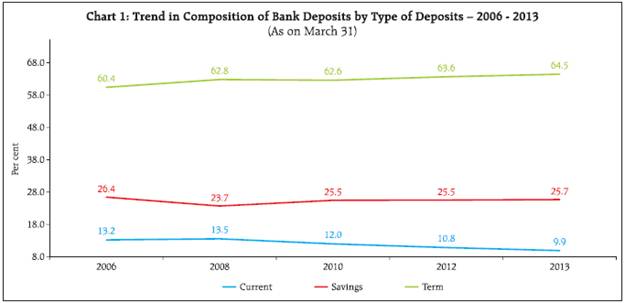
Introduction The statistics on ownership pattern of deposits are compiled from the branch level data reported by the scheduled commercial banks (SCBs) through Basic Statistical Return (BSR)-4. It captures the data on ownership of outstanding deposits as on March 31, classified according to type of deposit accounts namely, current, savings and term deposits as per different institutional categories of depositors (i.e., Household, Government, Private Corporate (Non-Financial, Financial and Foreign). These data also help to analyse the trends across population groups and major bank groups (public sector banks, private sector banks and foreign banks). 2. Since March 2012, the survey is being carried out on a census basis and the results are found to be in agreement with previous estimated trends since 2006. The branch-wise data on outstanding aggregate deposits are also validated against the similar data reported in the quarterly BSR-7 for March 31, 2013. 3. This article presents a brief review of the trends and pattern in type of deposit accounts (current, savings and term deposits). Ownership pattern of deposits by broad institutional sectors has been analysed followed by the section on the pattern of deposits according to population groups. Subsequently, bank-group wise analysis on preference of various institutional depositors is discussed. A brief on state-wise pattern in bank deposits as on March 31, 2013 is also described. Composition of Bank Deposits by Type of Deposits 4. Term deposits remained largest constituent with increasing share in total deposits. Composition of total deposits2 held with the scheduled commercial banks as on March 2013 indicates that the term deposits constituted around two-thirds share in total deposits, followed by savings deposits at around one-fourth share (Chart 1). 5. The share of savings deposits, which declined from 26.4 per cent in 2006 to 23.7 per cent in 2007 remained almost constant at around 25.5 per cent in the recent period. There was a moderate growth in the share of term deposits over the period. The share of current account balances declined from 2008 onwards, portraying somewhat economic environment in the country. 6. Though, the total deposits along with its components increased steadily during the period under review, the growth in total deposits decelerated 2008 onwards (Table 1). The deceleration in total deposits spread across all types of deposits accounts may be attributed to the deceleration in income growth. The growth and composition of deposits appear to have a correspondence with the prevailing term deposit rates. The growth in current deposits appears to be in sync with the growth in Index of industrial production.
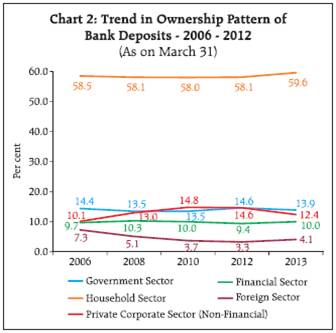
Ownership pattern of deposits by broad institutional sectors 7. Composition of deposits according to institutional ownership reflected dominance of households over the entire period, which contributed 59.6 per cent share in total deposits as on March 2013 (Chart 2). Share of government and non-financial private corporate sectors followed next constituting 13.9 per cent and 12.4 per cent share in total deposits, respectively. The shares of financial as well as foreign sector increased to 10.0 per cent and 4.1 per cent respectively, as on March 2013. 8. During the period of 2012-13, the increase of 1.5 per cent in the household sector’s share was mainly on account of higher growth in deposits of individuals (including Hindu Undivided Families-HUFs) (Table 2). Within households, individuals (including Hindu Undivided Families-HUFs) comprised largest share ranging 77-80 per cent of total household deposits. Proprietary and partnership firms (4.7-6.3 per cent) and trusts and associations (3.5-4.6 per cent) were other constituents of households’ deposits during the period 2006-2013. (For detailed data, refer RBI website (/en/web/rbi). Under the individual, deposits of farmers increased by 48.8 per cent during 2012-13, possibly on account of excess liquidity due to acceleration in minimum support price for most of the food and non food products during this period.
9. The deceleration in Government as well as non-financial private corporate sectors deposits was mainly on account of decline in deposits of corporate, possibly on account of lower business sentiments reflected by deceleration in industrial production and nominal GDP during 2012-13. 10. The institutional ownership composition of various types of deposits indicates that the households which is the largest holder of total deposits outstanding with SCBs, also held the largest shares across the three types of deposits, viz., current, savings and term deposits during 2012-13 (Table 3). More than 80 per cent of savings deposits, more than 50 per cent of term deposits and more than 40 per cent of current deposits are held by households. As regards current deposits, the non-financial private corporate sector was the second largest contributor followed by the Government sector during 2012-13. The share of non-financial private corporate, household and foreign sectors in total current deposits declined during 2012-13 mainly in favour of financial and government sectors. 11. Term deposits constituted major part of total deposits for all institutional sectors over the period 2006-2013. Savings deposits were the second major constituent in all sectors barring non-financial private corporate and financial sectors, wherein current deposits were significant as compared to savings deposits (Table 4). Ownership Pattern of Deposits across Population Groups6 12. Distribution of total deposits across population groups wherein bank branches were located indicated that metropolitan branches contributed maximum in total deposits (54-58 per cent during 2006-2013) followed by urban (20-22 per cent), semi-urban (13-14 per cent) and rural (8-11 per cent) branches (Table 5). The share of rural branches in total deposits, which declined during 2006-2009, had started recovering thereafter. Further, deceleration in total deposits during 2012-13 had been mainly on account of deceleration in deposits raised by metropolitan branches.
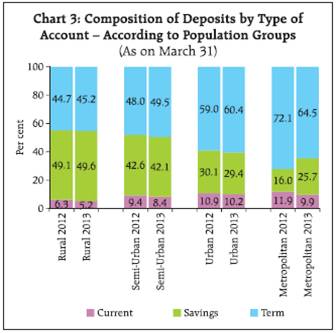
13. Term deposits remained dominant across metropolitan, urban and semi-urban population groups followed by savings deposits during 2012-13 (Chart 3). However, in respect of deposits raised by rural branches, savings deposits constituted largest share, followed by term deposits. 14. Institutional sector composition revealed dominance of households sector in all population groups. Within households, individuals (including Hindu Undivided Families - HUFs) constituted largest share across all the population groups. This sub-group accounted for more than 75 per cent of household deposits in rural and more than 60 per cent in semiurban centres, however, its share was comparatively lower at around 46 per cent in metropolitan areas. (For detailed data, refer RBI website (/en/web/rbi). Ownership Pattern of Deposits According to Bank Groups 15. Bank group wise, public sector banks (comprising SBI & its Associates and Nationalised Banks including IDBI Bank) comprised the largest share in total deposits, which had increased from 70.1 per cent as on March 31, 2007 to 74.3 per cent in March 2013 (Table 6). Domestic private sector banks comprised 3.6-4.7 times of the deposits held by foreign banks during 2006-2013. The Regional Rural Banks’ share in total deposits was the lowest at around 3 per cent during 2007-13.
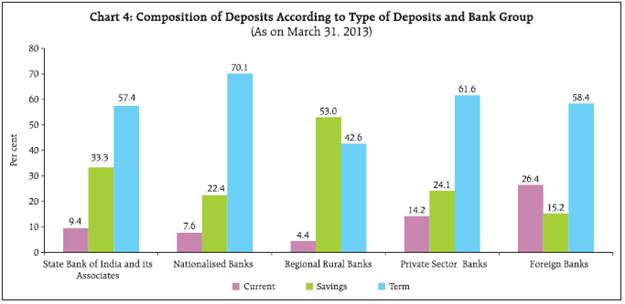
16. Distribution according to type of deposits in March 2013 was similar to earlier years. In 2013, SBI and its associates, nationalised banks and private sector banks followed the same pattern, where the term deposits had the largest share followed by savings deposits (Chart 4). In the case of foreign banks, term deposits constituted more than half of the total deposits followed by current deposits (more than one-fourth). In the case of RRBs, savings deposits accounted for more than half of the total deposits followed by term deposits (around two-fifth). 17. Institutional ownership of deposits as on March 31, 2013 indicated that the households accounted for the highest share in total deposits in all bank groups barring foreign Banks, in whose case non-financial private corporate sector held the largest deposits followed by household and foreign sectors deposits (Table 7). 18. Selection of bank groups by various institutional players appeared to be based on flexibilities required for their business as well as the customer oriented business strategies of banks. Around 90 per cent of the Government deposits were with public sector banks. More than 40 per cent deposits by non-financial private corporate sector were concentrated in foreign and private sector bank groups. Most of the household deposits, specially individuals (largest constituent of household sector) were with public sector banks, possibly on account of comparatively bigger branch network of these banks. Institutional Ownership of Deposits According to States / Union Territories7 19. The composition according to ownership deposits as at end March 2013 across different States/Union Territories (UTs) shows the dominance of households’ savings in bank deposits with different degrees of variations. The overall household share in total deposits in the Central Region was the highest at 73.3 per cent with the corresponding States/UT’s share varying in the range from 60 to 78 per cent, followed by the North Eastern States at 68.7 per cent (with the constituents’ share being ranged between 63 to 71 per cent), the Eastern Region at 68.2 per cent (59 to 75 per cent) and the Southern Region at 64.4 per cent (64 to 77 per cent). The share of households in total deposits was lower in the Northern Region at 60.4 per cent (45 to 84 per cent) and in Western Regions at 46.2 per cent (40 to 74 per cent), the variations being wider due to very low shares of Delhi (45 per cent) and Maharashtra (40 per cent), respectively. In respect of four States/UTs, the share of household in total deposits was below all-India level. Besides Maharashtra and Delhi, these States/UTs include Chandigarh (58.2 per cent) and Odisha (59.2 per cent). The contribution of households in total deposits was above 75 per cent in six States/UTs, namely Himachal Pradesh, Punjab, Rajasthan, Uttar Pradesh, Dadra & Nagar Haveli and Lakshadweep. 20. In 15 States/UTs, the share of Government entities in total deposits was less than the all-India level. These include all States/UTs of Wesetern and Southern regions barring Lakshadweep. The share of non-financial private corporate sector in total deposits in 6 states namely, Maharashtra, Delhi, Uttarakhand, Andhra Pradesh, Karnataka, and Tamil Nadu was higher than the all-India level. Of the total deposits by non-financial private corporates, 80.5 per cent were concentrated in 6 states, namely, Maharashtra (37.1 per cent), Delhi (15.5 per cent), Karnataka (8.6 per cent), Tamil Nadu (7.3 per cent), Andhra Pradesh (7.6 per cent) and West Bengal (4.4 per cent). The ‘Foreign’ sector deposits accounted for 18.6 per cent, 16.1 per cent and 16.1 per cent of total deposits raised by banks in Kerala, Daman & Diu and Goa, respectively. Of the total foreign sector deposits raised by SCBs in all-India, Maharashtra constituted 33.7 per cent followed by Kerala (14.9 per cent), Delhi (7.8 per cent) and Gujarat (7.4 per cent). * Prepared in the Bank Branch Statistics Division of the Department of Statistics and Information Management, Reserve Bank of India. 1 More detailed data for March 2013 is available in the Reserve Bank website ‘URL:/en/web/rbi’. Previous findings from BSR-4 survey on Composition and Ownership Pattern of Deposits with scheduled commercial bank were published in various issues of Reserve Bank of India Bulletin; the latest was published in the June 2013 issue. 2 Includes inter-bank deposits. 3 March 2011 estimates based on stratified sampling method were not in alignment with the previous year estimates as also the latest census data for March 2012 and hence, not considered in the present study. The growth rates for 2012 for all the items are therefore calculated as compounded annual growth rates over 2010. 4 The term deposit rates for major banks (Source: Weekly Statistical Supplement, RBI). 5 GDP at current market prices. 6 The population group classification of banked centres is based on Census 2001. 7 More detailed data for March 2013 is available in the Reserve Bank website ‘URL:/en/web/rbi’.. |
|||||||||||||||||||||||||||||||||||||||||||||||||||||||||||||||||||||||||||||||||||||||||||||||||||||||||||||||||||||||||||||||||||||||||||||||||||||||||||||||||||||||||||||||||||||||||||||||||||||||||||||||||||||||||||||||||||||||||||||||||||||||||||||||||||||||||||||||||||||||||||||||||||||||||||||||||||||||||||||||||||||||||||||||||||||||||||||||||||||||||||||||||||||||||||||||||||||||||||||||||||||||||||||||||||||||||||||||||||||||||||||||||||||||||||||||||||||||||||||||||||||||||||||||||||||||||||||||||||||||||||||||||||||||||||||||||||||||||||||||||||||||||||||||||||||||||||||||||||||||||||||||||||||||||||||||||||||||||||||||||||||||||||||||||||||||||||||||||||||||||||||||||||||||||||||||||||||||||

Share this page:


Install the RBI mobile application and get quick access to the latest news!


