The present article captures composition and the level of fixed capital investment of private corporate sector in 2006-07 based on companies covered by institutional assistance during 2006-07 and the previous years. An attempt is also made in this study for the first time to assess the capital spending of companies not covered by institutional assistance. The total capital spending envisaged was markedly higher in 2006-07 reflecting increased investment opportunities. Infrastructure projects, in particular, the power projects continue to dominate the scene. The substantial increase in the total cost of projects sanctioned assistance in 2006-07 to Rs.2,83,440 crore was to a great extent due to the presence of 88 large projects each with project cost exceeding Rs.500 crore and aggregating as much as Rs.2,01,356 crore or more than two-thirds of the total project cost as compared to 49 projects amounting to Rs.74,988 crore in 2005-06. Gujarat ranked first with the proposed investment of Rs.73,170 crore in 86 projects accounting for 25.8 per cent of total investment followed distantly by Andhra Pradesh, Maharashtra and Tamil Nadu. The sharp increase in production of capital goods, import of capital goods and envisaged capacity accretion supported by improved corporate profitability, high capacity utilisation rates and robust GDP growth in manufacturing over the quarters of 2006-07 point to the continued momentum in fixed capital investment. The turnaround in corporate investment, which began in 2002-03 and peaked in 2004-05, is expected to be sustained in 2007-08. Introduction
Investment in new plant and equipment is essential if business is to keep pace with new technology to enhance productivity, sustain economic growth and at the same time to remain competitive. Growth in business investment adds to capital stock, boosting the economy’s productive capacity needed to achieve long-term economic growth. In order to obtain an idea about the growth of corporate investment a year ahead, the article makes an assessment of capital expenditure of the private and joint sector companies. The analysis provides important insights into the business expectations about performance of economy in general, and into the infrastructure and manufacturing sectors in particular#.
With this objective in view, the study is designed to capture the likely growth of corporate investment based primarily on data on phasing details of projects sanctioned assistance by the commercial banks and other non-bank financial institutions. The approach is based on the methodology developed by Dr. C. Rangarajan in an article captioned “Forecasting Capital Expenditure in the Corporate Sector” published in the December 13, 1970 issue of the ‘Economic and Political Weekly’. This methodology was based primarily on the assumption that the private corporate entities, undertaking projects involving large sums of investment, generally approach the banks/ FIs for part-financing. And therefore according to this method, the likely growth in capital expenditure can be broadly assessed on the basis of yearly phasing details of total capital expenditure. The analysis indicates the level of investment that would have to be surpassed, other things remaining the same, if investment in the following year is to show a rise over the previous year’s level.
However as a result of liberalisation in government policies, companies in recent times, taking advantage of buoyant capital markets and low cost funds available overseas, are raising substantial amounts through domestic equity and External Commercial Borrowings (ECBs) including Foreign Currency Convertible Bonds (FCCBs). An attempt is made for the first time in this study to capture capital spending of these companies as well. Companies in private corporate sector are also raising resources from private placement of debt, bonds/debentures and ADR/GDRs. Due to inadequate data availability, capital expenditure of such companies however, could not be attempted.
Scope and Coverage
The estimation of growth in capital investment made in this study is largely based on projects of companies in the private corporate sector that were assisted by Industrial Development Bank of India, ICICI Bank, Infrastructure Development Finance Company, Life Insurance Corporation, Power Finance Corporation, Infrastructure Leasing & Financial Services Limited, EXIM Bank and major public, private and foreign banks. The project reports with banks/FIs provide information on industry, purpose and location of the project besides the proposed investment and its phasing details. Noting that some companies may also raise equity capital or ECBs to finance their large capital outlays, investment plans of such companies were also aggregated. For the companies issuing equity capital, data on envisaged capital spending and corresponding phasing details were culled out from the prospectus submitted by them to SEBI. Similarly, in the case of companies that had raised funds through ECBs, the data were aggregated for such companies where the prime purpose indicated in the Form 83 as submitted to the Reserve Bank was capital expenditure. The corresponding drawal schedule is taken as indicative of the proposed yearly spending. In case where the company approached banks/FIs for assistance and also contracted ECBs or issued equity capital to part finance its capital expenditure during the reference period, care has been taken to avoid multiple counting.
As mentioned earlier, the capital spending envisaged by the companies raising funds through private placements, debenture/bond issues or through ADR/GDRs could not be ascertained due to inadequacy of information on their end use and expenditure patterns over the years. The validity of the assessment of likely corporate investment heavily rests upon the assumption that companies adhere to the expenditure patterns outlined in the initial proposals.
The present study captures 1054 companies1 having projects with an aggregated envisaged cost of Rs.2,83,440 crore. These companies were sanctioned assistance by banks/FIs in 2006-07. In addition, the study for the first time, covered proposed investment of 472 companies contracting ECBs (inclusive of FCCBs) in 2006-07 aggregating to Rs.58,086 crore and proposed investment of 79 companies aggregating to Rs.4,064 crore issuing domestic equity capital during 2006-07. All together, the total investment proposals in 2006-07 from these 1605 companies worked out to be Rs.3,45,590 crore spread over 2004-05 to 2011-12.
A. Envisaged Capital Expenditure of Companies Sanctioned Assistance by Banks/FIs
Firstly, the companies that have been sanctioned financial assistance in 2006-07 and those companies that have been sanctioned assistance prior to 2006-07 and have capital expenditure lined up in subsequent years were considered. The corporate investment is then estimated for the year 2006-07 by suitably aggregating data on the time phasing of capital expenditures over the individual years. In cases where a company approached more than one institution for project assistance, care was taken to include it only once. Efforts were made to incorporate the revisions in the phasing of projects sanctioned earlier, to the extent possible. The data consolidated on these lines, are presented in Table 1. When horizontally read, it shows the capital expenditure that are expected to be incurred in various years on projects for which assistance was provided in a given year. Vertically read, it shows the capital expenditure that would be incurred in a year on projects to which assistance had been given in that year and in previous years.
It can be seen from Table 1 that capital expenditure of Rs.59,232 crore was expected to have been incurred during 2006-07 in respect of projects sanctioned up to 2005-06. The fresh sanctions during 2006-07 envisaged substantial capital expenditure of another Rs.95,806 crore in 2006-07 (col.12, Table 1). Thus, the total capital expenditure that might have been incurred during 2006-07 amounted to Rs.1,55,038 crore. In 2006-07, not only the number of projects increased but the number of high cost projects rose very sharply.
As a result, the capital expenditure planned by the private corporate sector is likely to have risen by 60.2 per cent in 2006-07 on top of a rise of 23.1 per cent in 2005-06. A few companies sanctioned assistance in 2006-07 were found to have already spent Rs.14,903 crore in 2005-06 itself. Considering this, the total capital expenditure that could have been incurred during 2005-06 works out to Rs.96,766 crore.
Table 1 : Phasing of Capital Expenditure of Projects Sanctioned Assistance by |
Commercial Banks / Financial Institutions |
(Rs crore) |
Capital expenditure in the Year
Year of sanction |
1996-97 |
1997-98 |
1998-99 |
1999-00 |
2000-01 |
2001-02 |
2002-03 |
2003-04 |
2004-05 |
2005-06 |
2006-07 |
2007-08 |
1 |
2 |
3 |
4 |
5 |
6 |
7 |
8 |
9 |
10 |
11 |
12 |
13 |
Upto March 1996 |
42,613 |
22,426 |
7,599 |
3,156 |
1,988 |
1,773 |
1,005 |
599 |
|
|
|
|
1996-97 |
21,917 |
20,044 |
8,592 |
2,800 |
588 |
618 |
617 |
594 |
463 |
176 |
136 |
|
1997-98 |
4,437 |
21,359 |
19,122 |
10,111 |
3,833 |
1,148 |
889 |
703 |
566 |
195 |
101 |
|
1998-99 |
1,408 |
6,415 |
23,321 |
18,622 |
10,248 |
3,340 |
1,545 |
1,701 |
725 |
184 |
99 |
|
1999-2000 |
13 |
256 |
8,286 |
11,971 |
11,640 |
7,107 |
5,603 |
695 |
468 |
|
|
|
2000-01 |
22 |
32 |
36 |
4,085 |
17,054 |
14,145 |
10,367 |
3,830 |
1,335 |
717 |
|
|
2001-02 |
|
|
62 |
266 |
6,604 |
8,384 |
6,386 |
1,990 |
1,318 |
115 |
24 |
|
2002-03 |
|
|
5 |
30 |
96 |
680 |
5,763 |
5,429 |
1,708 |
574 |
573 |
|
2003-04 |
|
|
|
1,313 |
517 |
547 |
8,285 |
26,309 |
23,286 |
5,429 |
2,586 |
300 |
2004-05 |
|
|
|
|
|
|
|
5,815 |
36,709 |
33,193 |
11,810 |
5,143 |
2005-06 |
|
|
|
|
|
|
|
|
9,858 |
41,280 |
43,903 |
23,707 |
2006-07 |
|
|
|
|
|
|
|
|
2,172 |
14,903 |
95,806 |
96,098 |
Total upto
2006-07 |
70,411 |
70,532 |
67,023 |
52,355 |
52,568 |
37,742 |
40,459 |
47,665 |
78,608 |
96,766 |
1,55,038 |
1,25,248 |
Grand Total #$ |
70,691 |
70,724 |
67,131 |
52,435 |
52,668 |
37,742 |
40,459 |
47,665 |
78,608 |
96,766 |
1,55,038 |
1,25,248 |
Percentage change |
9.9 |
0.0 |
–5.1 |
–21.9 |
0.4 |
–28.3 |
7.2 |
17.8 |
64.9 |
23.1 |
60.2 |
|
# : Includes assistance provided by the IDBI under Bills Rediscounting Scheme and
Technical Development Fund Scheme.
$ : The estimates of Corporate Investment are ex ante and differ in scope and methodology
from the ex post estimates of corporate fixed investment as available in National Accounts
Statistics (NAS). See also the technical note attached to
“Growth of Corporate Investment: An attempt at projection for 1999-2000’ published in the
Monsoon 1999 issue of the Reserve Bank of India Occasional Papers for details. |
A1.Projects Sanctioned during 2006-07
The 1054 companies covered by institutional assistance, had projects with an aggregated cost of Rs.2,83,440 crore. This envisaged spending, spread over eight year period spanning from 2004-05 to 2011-12 was more than double of Rs.1,31,299 crore envisaged from the 812 companies covered by institutional assistance in 2005-06 (Table 2). The phasing details of the fresh sanctions in 2006-07 showed that 33.8 per cent of the total proposed spending amounting to Rs.95,806 crore is planned to be incurred in 2006-07 and almost equal amount representing another 33.9 per cent (Rs.96,098 crore) in the following year, i.e., 2007-08. Around 5.3 per cent of total project cost envisaged by these companies was already spent in 2005-06.
Table 2 : Phased Capital Expenditure of Projects Sanctioned in 2005-06 and 2006-07 |
(Rs. crore) |
Capital expenditure in the
Year Capital
expenditure of projects |
2004-05 |
2005-06 |
2006-07 |
2007-08 |
2008-09 |
2009-10 |
2010-11 |
2011-12 |
Total |
1 |
2 |
3 |
4 |
5 |
6 |
7 |
8 |
9 |
10 |
|
Number of projects 812 |
Sanctioned in 2005-06 |
9,858 |
41,280 |
43,903 |
23,707 |
8,501 |
2,263 |
1,787 |
— |
1,31,299 |
|
(7.5) |
(31.4) |
(33.4) |
(18.1) |
(6.5) |
(1.7) |
(1.4) |
— |
(100.0) |
|
Number of projects 1054 |
Sanctioned in 2006-07 |
2,172 |
14,903 |
95,806 |
96,098 |
51,693 |
15,111 |
4,887 |
2,770 |
2,83,440 |
|
(0.8) |
(5.3) |
(33.8) |
(33.9) |
(18.2) |
(5.3) |
(1.7) |
(1.0) |
(100.0) |
|
|
|
|
|
|
|
|
|
|
— : Nil / Negligible. Note: Figures in brackets denote percentage shares in the total. |
A2.Industry-wise Pattern of Projects
Table 3 presents an industry-wise distribution of the projects sanctioned assistance in 2006-07 based on the industrial activity as indicated in the project reports. It may be noted that the classification also represents some emerging categories such as IT parks, Special Economic Zones (SEZs), etc.
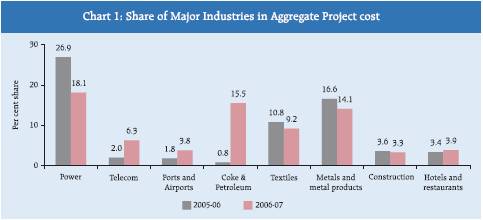
Reflecting heavy investment envisaged in infrastructure, the infrastructure group which in 2006-07 included 37 IT parks and SEZ projects, accounted for the highest share of 35.9 per cent of total cost of projects, amounting to Rs.1,01,744 crore. Half of this huge proposed investment was in power projects (Rs.51,451 crore), followed by 9 telecom projects (Rs.17,950 crore), 8 roads, storage and water management projects (Rs.13,083 crore) and 7 ports and airports projects (Rs.10,745 crore). SEZ, Industrial, Biotech & IT Parks projects envisaged Rs.8,515 crore.
Projects belonging to coke and petroleum products industry envisaged capital outlay of Rs.44,083 crore (15.5 per cent of cost of all projects) from 11 projects. Metal and metal products and textiles followed next with 14.1 per cent and 9.2 per cent share, respectively. The maximum number of projects sanctioned assistance in 2006-07 belongs to textile industry at 258 (on top of 158 projects in 2005-06), followed by metal and metal products projects at 130. Among service industries, projects in hotel industry accounted for 3.9 per cent share followed by construction industry with 3.3 per cent (Chart 1).
A3.Size-wise Pattern of Projects
Table 4 indicates size-wise picture of the projects sanctioned assistance during 2006-07. The sharp increase in the total cost of projects in 2006-07 was to a great extent due to the presence of 88 large projects each with project cost exceeding Rs.500 crore. These projects aggregated to Rs.2,01,356 crore accounting for more than two-thirds of the total project cost as compared to 49 projects amounting to Rs.74,988 crore in 2005-06.
Table 3: Industry-wise Distribution of Projects and their Cost in 2005-06 and 2006-07 |
|
2005-06 |
2006-07 |
Industry |
Number |
Project Cost |
Number |
Project Cost |
|
|
of |
Amount |
Per cent |
of |
Amount |
Per cent |
|
|
Projects |
(Rs. crore) |
Share |
Projects |
(Rs. crore) |
Share |
1 |
|
2 |
3 |
4 |
5 |
6 |
7 |
1. |
Infrastructure |
109 |
44,541 |
33.9 |
125 |
1,01,744 |
35.9 |
|
i) Power |
66 |
35,358 |
26.9 |
64 |
51,451 |
18.2 |
|
ii) Telecom |
5 |
2,639 |
2.0 |
9 |
17,950 |
6.3 |
|
iii) Ports & Airports |
3 |
2,295 |
1.8 |
7 |
10,745 |
3.8 |
|
iv) Roads,Storage & Water Management |
22 |
2,386 |
1.8 |
8 |
13,083 |
4.6 |
|
v) SEZ, Industrial, Biotech & IT Parks |
13 |
1,864 |
1.4 |
37 |
8,515 |
3.0 |
2. |
Sugar |
20 |
2,857 |
2.2 |
33 |
8,867 |
3.1 |
3. |
Textiles |
158 |
14,128 |
10.8 |
258 |
25,933 |
9.2 |
4. |
Paper & Paper Products |
23 |
2,397 |
1.8 |
24 |
2,915 |
1.0 |
5. |
Coke & Petroleum Products |
2 |
1,107 |
0.8 |
11 |
44,083 |
15.5 |
6. |
Chemicals & Petrochemicals |
26 |
3,021 |
2.3 |
35 |
4,136 |
1.5 |
7. |
Cement |
13 |
1,945 |
1.5 |
27 |
10,567 |
3.7 |
8. |
Metal & Metal Products |
126 |
21,799 |
16.6 |
130 |
39,876 |
14.1 |
9. |
Electrical and Non Electrical Machinery |
22 |
384 |
0.3 |
20 |
4,486 |
1.6 |
10. |
Transport Equipments |
13 |
988 |
0.8 |
29 |
5,174 |
1.8 |
11. |
Construction |
33 |
4,700 |
3.6 |
34 |
9,277 |
3.3 |
12. |
Hotels and Restaurants |
37 |
4,454 |
3.4 |
74 |
11,122 |
3.9 |
13. |
Transport Services |
21 |
16,947 |
12.9 |
17 |
1,561 |
0.5 |
14. |
Entertainment |
9 |
1,807 |
1.4 |
20 |
761 |
0.3 |
15. |
Information Technology |
7 |
2,683 |
2.0 |
8 |
228 |
0.1 |
16. |
Others* |
193 |
7,540 |
5.7 |
209 |
12,710 |
4.5 |
Total |
812 |
1,31,299 |
100.0 |
1054 |
2,83,440 |
100.0 |
* : Comprise industries, each with a share of less than 1 per cent in total cost of projects in 2005-06 and 2006-07. |
Table 4: Size-wise Distribution of Projects and their Cost during
2005-06 and 2006-07 |
|
2005-06 |
2006-07 |
Size of Projects |
Number |
Project Cost |
Number |
Project Cost |
|
(Rs crore) |
of |
Amount |
Per cent |
of |
Amount Per cent |
|
Projects |
(Rs. crore) |
Share |
Projects |
(Rs. crore) |
Share |
1 |
2 |
3 |
4 |
5 |
6 |
7 |
Less than 10 |
172 |
713 |
0.5 |
48 |
285 |
0.1 |
10 to 50 |
306 |
7,834 |
6.0 |
475 |
12,064 |
4.3 |
50 to 100 |
118 |
8,523 |
6.5 |
191 |
13,790 |
4.9 |
100 to 200 |
84 |
12,252 |
9.3 |
131 |
18,808 |
6.6 |
200 to 500 |
83 |
26,989 |
20.6 |
121 |
37,137 |
13.1 |
500 & above |
49 |
74,988 |
57.1 |
88 |
2,01,356 |
71.0 |
Total |
812 |
1,31,299 |
100.0 |
1054 |
2,83,440 |
100.0 |
A4.State-wise Pattern of Projects
Table 5 presents the state-wise pattern of proposed investment as revealed by the projects sanctioned in 2006-07. There are wide variations in this pattern from year to year as locations of a few large projects change the pattern considerably. Having projects with total investment intentions amounting to Rs.73,170 crore from 86 projects, Gujarat displaced Maharashtra and ranked first. It formed 25.8 per cent of total investment intentions of all 1054 projects, followed distantly by projects in Andhara Pradesh (8.9 per cent), Maharashtra (8.6 per cent), Tamil Nadu (8.6 per cent) with around investment of Rs.25,000 crore each (Chart-2). 46 projects located in more than one state amounted another Rs.25,428 crore (presented in the category multi-state projects). Tamil Nadu ranked first in terms of number of new sanctions with 157 projects followed by Maharashtra with 142 projects and Andhra Pradesh with 105 projects.
A5.Purpose-wise Pattern of Projects
There were as many as 566 new projects during 2006-07 as compared to 393 in 2005-06 (Table 6). They accounted for 66.5 per cent of total project cost placed at Rs.1,88,534 crore as against Rs.76,659 crore in 2005-06; and included 33 large projects with project cost of more than Rs.1,000 crore. Another 415 projects were proposed for expansion and modernisation in 2006-07, accounted for 27.5 per cent of total project cost as against 379 projects with a share of 37.7 per cent during 2005-06. 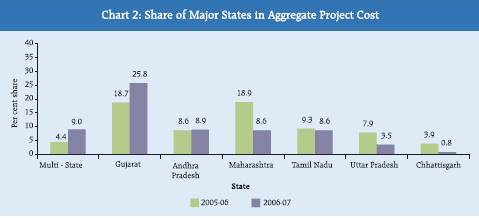
Table 5: State-wise Distribution of Projects and their Cost during 2005-06
and 2006-07 |
|
2005-06 |
2006-07 |
State |
Number |
Project Cost |
Number |
Project Cost |
|
of |
Amount |
Per cent |
of |
Amount |
Per cent |
|
Projects |
(Rs. crore) |
Share |
Projects |
(Rs. crore) |
Share |
1 |
2 |
3 |
4 |
5 |
6 |
7 |
Andhra Pradesh |
76 |
11,254 |
8.6 |
105 |
25,173 |
8.9 |
Chhattisgarh |
19 |
5,162 |
3.9 |
13 |
2,365 |
0.8 |
Delhi |
24 |
2,127 |
1.6 |
19 |
6,359 |
2.2 |
Gujarat |
95 |
24,531 |
18.7 |
86 |
73,170 |
25.8 |
Haryana |
29 |
1,805 |
1.4 |
42 |
3,897 |
1.4 |
Himachal Pradesh |
19 |
9,325 |
7.1 |
30 |
2,644 |
0.9 |
Jharkhand |
8 |
367 |
0.3 |
13 |
7,174 |
2.5 |
Karnataka |
51 |
4,537 |
3.5 |
91 |
19,930 |
7.0 |
Madhya Pradesh |
12 |
2,514 |
1.9 |
23 |
4,878 |
1.7 |
Maharashtra |
121 |
24,828 |
18.9 |
142 |
24,330 |
8.6 |
Orissa |
20 |
4,525 |
3.5 |
23 |
14,806 |
5.2 |
Punjab |
27 |
2,041 |
1.5 |
48 |
5,902 |
2.1 |
Rajasthan |
27 |
2,466 |
1.9 |
38 |
9,806 |
3.5 |
Sikkim |
— |
— |
— |
3 |
9,418 |
3.3 |
Tamil Nadu |
124 |
12,160 |
9.3 |
157 |
24,299 |
8.6 |
Uttar Pradesh |
50 |
10,415 |
7.9 |
60 |
9,836 |
3.5 |
Uttarakhand |
24 |
2,959 |
2.2 |
31 |
5,633 |
2.0 |
West Bengal |
27 |
2,548 |
1.9 |
37 |
3,404 |
1.2 |
Multi-State |
29 |
5,730 |
4.4 |
46 |
25,428 |
9.0 |
Others* |
30 |
2,005 |
1.5 |
47 |
4,988 |
1.8 |
Total |
812 |
1,31,299 |
100.0 |
1054 |
2,83,440 |
100.0 |
— : Nil.
* Comprise states/ union territories, each with share of less than 1 per cent in
aggregate cost of projects in 2005-06
and 2006-07. |
Table 6: Purpose-wise Distribution of Projects and their Cost during 2005-06
and 2006-07 |
|
2005-06 |
2006-07 |
Purpose |
Number |
Project Cost |
Number |
Project Cost |
|
of |
Amount |
Per cent |
of |
Amount |
Per cent |
|
Projects |
(Rs. crore) |
Share |
Projects |
(Rs. crore) |
Share |
1 |
2 |
3 |
4 |
5 |
6 |
7 |
New |
393 |
76,659 |
58.4 |
566 |
1,88,534 |
66.5 |
Expansion and Modernisation |
379 |
49,525 |
37.7 |
415 |
77,956 |
27.5 |
Diversification |
6 |
627 |
0.5 |
32 |
6,481 |
2.3 |
Others |
34 |
4,488 |
3.4 |
41 |
10,469 |
3.7 |
Total |
812 |
1,31,299 |
100.0 |
1054 |
2,83,440 |
100.0 |
B. Envisaged Capital Expenditure of Companies Raising Funds from ECBs It is noteworthy that ECBs (including FCCBs) funding has assumed greater role in last three years possibly as a result of policy orientation. Based on the information on ECBs as available in Form 83 submitted to the Reserve Bank, amount of loan contracted and its drawal schedule is taken to broadly represent company’s envisaged capital expenditure and corresponding phasing schedule, respectively. The planned capital expenditure in a reference year is then derived as the sum total of loan drawal amounts in each year from the loans contracted in years up to and including the reference year. In such cases, where the company in private corporate sector approached banks/FIs for assistance and also contracted ECBs to part finance its capital expenditure during the reference period, care has been taken to avoid double counting.
Excluding the companies that had approached banks / FIs, the investment plans of remaining companies contracting ECBs amounted to Rs. 58,086 crore in 2006-07 vis-à-vis around Rs.30,235 crore in 2005-06, Rs.24,646 crore in 2004-05 and only Rs.5,197 crore in 2003-04. Capital expenditure expected to be spent in 2006-07 flowing from the companies contracting ECBs since 2003-04 works out to be around Rs.49,084 crore, of which, a major part of Rs. 38,078 crore was from loans contracted in 2006-07 itself.
C. Envisaged Capital Expenditure of Companies Raising Funds from IPOs/FPOs/Rights Issues
During 2006-07, 110 non-financial companies belonging to private corporate sector have come out with public/rights issues with total issue size of Rs.29,857 crore. Based on information provided in the prospectus of the companies to the SEBI, it is observed that three fourth of this amount was envisaged to be spent on fixed investment. However, the total investment plans of these companies were larger at Rs.45,517 crore, spread over 2005-06 to 2009-10. Out of this total, capital expenditure of Rs.17,010 crore was envisaged during 2006-07. As before, excluding capex of companies which had also approached banks/FIs or contracted ECBs for part financing, the total investment plans by the remaining companies raising resources from equity issuances during 2006-07 stood at Rs.4,064 crore. Of which, expenditure of around Rs.2,338 crore and Rs. 1,161 crore were envisaged during 2006-07 and 2007-08.
Assessment and Prospects
Assessment of 2006-07
Over the past year, the economy has performed well. It was the fourth consecutive year of economic growth above 7 per cent. The observed annual increase in fixed investment over last three years signifies a significant expansion in capex, making it one of the longest cycle with private sector fixed investment remaining strong in response to upbeat business confidence, buoyancy in profits and rising capacity utilisation. Favourable investment conditions were amply reflected in industrial production growth of 11.5 per cent, buoyant by a robust performance of the manufacturing sector that surged 12.5 per cent. A faster growth of the capital goods sector at 18.3 per cent in 2006-07 in conjunction with 32.4 per cent rise in capital goods imports during April-January 2006-07 provided strong corroborative evidence on the investment activity taking place in the economy. Mirroring the strong industrial outlook, the bank credit to industry registered 26.7 per cent growth in 2006-07 and was mainly directed towards infrastructure, textiles, iron & steel and construction industries. Rising interest rates during the year, though lowered consumer-spending growth, have still not affected the pace of investment spending as reflected strongly in growth in envisaged investment during the year.
The growth in envisaged capital expenditure that was steadily moving up since 2002-03 and peaked in 2004-05 had slowed down to 23.1 per cent in 2005-06. However, the total project cost of all the projects sanctioned assistance in 2006-07 more than doubled to Rs.2,83,440 crore as against Rs.1,31,299 crore in 2005-06. The continued improved investment sentiments and business confidence was reflected in increased number of firms making capital expenditure and the extent of such spending. The capital expenditure envisaged in 2006-07 including that from the projects sanctioned assistance in all the prior years, amounts to Rs.1,55,038 crore, indicating 60.2 per cent rise over that of the previous year. The sharp rise in investment intentions was despite significant higher base of the previous years.
Avoiding multiple counting and considering companies that have raised resources through ECBs and domestic equity issuances, the expenditure envisaged by such companies amounted to Rs.49,084 crore and Rs.2,338 crore, respectively. Summing the capital expenditure intentions of companies from all the sources considered in the study, proposed investment in 2006-07 thus works out to substantial Rs.2,06,460 crore.
Prospects for 2007-08
Economic activity showed considerable momentum in 2006-07. Going forward, aggregate demand, the main motivating force towards investment, is expected to grow at a healthy pace. The Reserve Bank predicts real GDP to grow by 8.5 per cent in 2007-08. The expectation of fast expanding demand has driven the private corporate sector to operate at close to optimal capacity level. Also, marked improvement in the corporate profitability at the back of strong and sound balance sheets, reflects their capacity to invest. In other words, reduction in excess capacities in combination with their ability to invest would encourage business corporate sector to continue investing. Continued momentum in industrial production coupled with continued buoyancy in export growth as observed in first two months of this year bodes well with the conducive investment demand. Budget measures emphasising infrastructure development are likely to provide an additional boost to investment climate. Though, the growth in capital expenditure in 2007-08 is expected to continue its recent strength in response to the acceleration in the growth of demand in last few years, it may moderate due to its cyclical nature. Downside risks arise from rising interest rates at home and abroad, possible currency appreciation and wage cost pressures in many industries. However these downside risks remain limited and could be offset by sustained pace of high growth and prospects of continued large capital inflows amidst easy global liquidity. The investment planned for 2007-08 based on projects, which had been sanctioned financial assistance by banks/ FIs in the years up to 2006-07 aggregated to Rs.1,25,248 crore. The proposed investment aggregates to Rs.1,48,207 crore in 2007-08 if the capital spending of Rs.21,798 crore and Rs. 1,161 crore of companies raising funds through ECBS and Equity issuances are also added. However to work out the aggregate capital expenditure in 2007-08, we must add to this the fresh capital expenditure to be incurred in 2007-08. Therefore, if the aggregate capital expenditure in 2007-08 were to surpass the level attained in 2006-07 (i.e., Rs.2,06,460 crore envisaged collectively by companies approaching banks/FIs or issuing domestic equity capital or contracting ECBs), the capital expenditure in 2007-08 must be above Rs.58,253 crore. Since business conditions remain conducive to support corporate investment demand at the back of generally sound corporate balance sheets with improved profitability and less unused capacities, such an amount of fresh investment in 2007-08 seems to be likely. In other words, the year 2007-08 may witness an increase in corporate investment when compared to that in 2006-07, albeit, at a decelerated pace. |


