Corporate Investment: Growth in 2008-09 and Prospects for 2009-10* The article presents the envisaged fixed capital investment of private corporate sector in 2008-09, at aggregate as well as at different disaggregated levels, based on data on investment intentions of companies, primarily covered by institutional assistance, sanctioned up to the period ending March 2009. The exercise also captures the investment intentions of companies that contracted external commercial borrowings (ECBs) or raised equity in domestic capital market. Aimed at adding new capacities, the aggregate capital spending capex envisaged for the year 2008-09 by select companies in the private corporate sector was higher at Rs.3,16,101 crore, indicating continuation of investment cycle. The upsurge in intentions was primarily observed in sectors like power, telecom and metals and metal products. For the institutionally assisted projects during 2008-09 the total cost amounting to Rs.4,22,814 crore was to a great extent due to the rise in number of high value projects (each with cost exceeding Rs.500 crore) aggregating to as much as Rs.3,58,469 crore. Spatial pattern of projects envisaged revealed that Maharashtra was the most favoured State that captured 20.6 per cent of total investment intentions followed by Gujarat, Orissa and Andhra Pradesh. Going forward, decelerating capital goods production, decline in import of capital goods, emerging indications of excess capacity in some sectors and weak earnings witnessed by corporate sector specially in second half of 2008-09 are likely to impact new investment. Though uncertainty about demand would weigh on investment decisions, recent indications of improvements in business sentiments and corporate profitability do indicate that capital expenditure in 2009-10 can be maintained around last year’s level given the low leverage ratios of the corporates in general and continued thrust on infrastructure, particularly on PPP projects by the Government. 1. Introduction
Business fixed investment is commonly held to be an important determinant of an economy’s long run growth. Higher level of such investments raise production. The movements in business fixed investment, though volatile and difficult to predict, are generally highly synchronised with fluctuations in output. The Indian economy in recent years witnessed a long and strong investment upswing that helped drive the good economic growth.
This article makes an attempt to capture capital expenditure intentions of the private and joint business sector companies in order to assess broadly the short-term growth of fixed investment of private corporate sector. For this, the investment intentions indicated by the companies at the time of raising funds from different sources were analysed in order to make assessment of the likely capital expenditure during 2008-09 and to outline investment prospects for 2009-10. The analysis brings out the minimum investment that would have to show up in the current year 2009-10, other things remaining the same, if fixed investment intentions are to match the level attained in the previous year.
The rest of the article is organised as follows. Section 2 presents the methodology, scope, coverage and the limitations. Section 3 reviews the information on investment intentions for the year 2008-09. The capex intentions are presented separately for companies that raised funds from banks/ financial institutions (FIs), capital markets and ECBs. Analysis at several disaggregated levels such as size-class, industry, location/ state and purpose is also presented for the projects covered by institutional assistance. Finally, Section 4 makes an assessment of envisaged investment in the year 2008-09 and presents investment prospects for the year 2009-10.
2. The Approach – Methodology, Coverage and Limitations
Though banks/FIs constitute the conventional source of funds for large size capital expenditure, post liberalisation, companies are increasingly raising funds through several other avenues such as domestic capital markets, external commercial borrowings (ECBs) including foreign currency convertible bonds (FCCBs), private placement of debt, bonds/ debentures and ADRs/GDRs.
The estimation of growth in capital investment made in this study is largely based on proposed projects in the private corporate sector that were financially assisted by banks/FIs1. The reports, evaluated by the banks/FIs for sanctioning assistance, formed the prime source for the information on proposed investment, its phasing details along with information on industry, purpose and location of projects. The study inter-alia covers many under-construction projects.
Capital spending envisaged by the companies that raised ECBs (including FCCBs) or equity capital to partly finance their large capital outlays were also included. The Form 83 submitted to the Reserve Bank by companies raising funds through ECBs contains information on, among others, the purpose and the drawal schedule, which was considered as indicative of phasing details of utilisation of funds. The companies that contracted ECBs for the primary purpose of capital expenditure only were considered for the study. Similarly, the information on envisaged capital spending and corresponding phasing details, as indicated in prospectus of the companies issuing equity capital in domestic capital market and available with SEBI, was used to capture planned investment of such companies.
However, the investment intentions of companies raising funds exclusively through private placements or debenture/ bond issues or through ADR/GDRs could not be ascertained due to inadequacy of information available on their end use and expenditure pattern over the years2. The methodology followed is in line with that proposed by Dr. C. Rangarajan in an article titled “Forecasting Capital Expenditure in the Corporate Sector” published in December 13, 1970 issue of the ‘Economic and Political Weekly’. Accordingly, the envisaged phasing details of total project costs as mentioned in the project proposals by companies should indicate the likely level of capital expenditure (capex) in the years of their implementation.
The validity of the assessment of likely corporate investment heavily rests upon the assumption that companies would adhere to the expenditure pattern outlined in the initial proposals. It may also be noted that estimates of corporate investment presented in this article are ex ante and differ in scope and methodology from the ex post estimates of corporate fixed investment available in National Accounts Statistics (NAS)3.
3. Envisaged Investment in the year 2008-09
The present study captured investment intentions of 750 projects4 sanctioned assistance by banks/FIs in 2008-09 that amounted to Rs.4,22,814 crore. In addition, the study captured investment of Rs.31,215 crore proposed by 272 companies contracting ECBs (inclusive of FCCBs) and Rs.934 crore intended by 21 companies issuing domestic equity capital during 2008-09. All together, the fresh investment intentions of 1043 companies during 2008-09 aggregated to Rs.4,54,963 crore spread over the period 2006-07 to 2013-14.
3.1.Envisaged capital expenditure of companies sanctioned assistance by banks/FIs
In this section, the analysis is confined to those projects that were sanctioned assistance by the banks/FIs. Total capital investment was computed by combining the envisaged spending by the corporates in private sector that were sanctioned assistance (a) in years prior to 2008-09 that had envisaged capital expenditure lined up in 2008-09 and (b) in 2008-09 itself. From the time- phasing details that reflected the investment intentions over the implementation period of the projects, the capital expenditure in a given year was estimated. The likely fixed investment of private corporate sector in a particular year may broadly be gauged by suitably aggregating expenditure envisaged by the companies/projects sanctioned assistance in various years in that given year.
To the extent possible, the changes in view of revisions/cancellations in the projects sanctioned earlier were also incorporated. In case where a company approached more than one institution for project funding, care was taken to include it only once. The data consolidated on these lines are presented in Table 1. When horizontally read, it shows the capital expenditure that was expected to take place in various years by the projects given assistance in a particular year. Vertically read, it gives the capital expenditure that would be incurred in a year by projects to which assistance had been given either in that year or in previous years.
It can be seen from Table 1 that capital expenditure of Rs.1,34,245 crore was expected to have incurred during 2008-09 from the projects in years prior to 2008-09. The fresh projects sanctioned during 2008-09 found to have already spent Rs.81 crore in 2006-07 and Rs.28,600 crore in 2007-08. These projects envisaged capital expenditure of another Rs.1,34,450 crore in 2008-09. The total capital expenditure that could have been incurred during 2006-07, 2007-08 and 2008-09 aggregated to Rs.1,66,495 crore, Rs.2,14,111 crore and Rs.2,68,695 crore, respectively (col.10, 11 and 12, Table 1). Consequently, the capital expenditure intentions for companies in private corporate sector were likely to have risen by 25.5 per cent in 2008-09 on top of a rise of 28.6 per cent in 2007-08 and 71.2 per cent in 2006-07. Based on available information, envisaged capital expenditure in 2009-10 by the companies that approched banks/FIs upto 2008-09 stood at Rs.1,78,364 crore.
3.1.1 Projects sanctioned during 2008-09
The aggregate intentions of the 750 companies covered under institutional assistance during 2008-09 aggregated to Rs.4,22,814 crore. This envisaged spending, spread over eight-year period spanning from 2006-07 to 2013-14, was higher by Rs.1,78,518 crore when compared with Rs.2,44,296 crore envisaged from the 879 projects during 2007-08 (Table 2). The phasing details of the fresh sanctions in 2008-09 showed that 31.8 per cent of the total proposed spending amounting to Rs.1,34,450 crore was planned to be incurred in 2008-09 itself and slightly lower amount representing another 27.7 per cent (Rs.1,17,001 crore) in the following year 2009-10. An amount of Rs.1,42,682 crore was proposed to be spent subsequently during 2010-2014. It may be noted that around 6.8 per cent of total project cost envisaged by these projects was already spent in previous two years (i.e. 2006-07 and 2007-08).
Table 1: Phasing of Capital Expenditure of Projects Sanctioned Assistance by Commercial Banks/
Term Lending Institutions |
(Rs crore) |
Capital
expenditure in the Year →
Year of sanction↓ |
1998-99 |
1999-00 |
2000-01 |
2001-02 |
2002-03 |
2003-04 |
2004-05 |
2005-06 |
2006-07 |
2007-08 |
2008-09 |
2009-10 |
1 |
2 |
3 |
4 |
5 |
6 |
7 |
8 |
9 |
10 |
11 |
12 |
13 |
Upto March 1998 |
35,313 |
16,067 |
6,409 |
3,539 |
2,511 |
1,896 |
1,029 |
371 |
237 |
|
|
|
1998-99 |
23,321 |
18,622 |
10,248 |
3,340 |
1,545 |
1,701 |
725 |
184 |
99 |
|
|
|
1999-00 |
8,286 |
11,971 |
11,640 |
7,107 |
5,603 |
695 |
468 |
|
|
|
|
|
2000-01 |
36 |
4,085 |
17,054 |
14,145 |
10,367 |
3,830 |
1,335 |
717 |
|
|
|
|
2001-02 |
62 |
266 |
6,604 |
8,384 |
6,386 |
1,990 |
1,318 |
115 |
24 |
|
|
|
2002-03 |
5 |
30 |
96 |
680 |
5,763 |
5,429 |
1,708 |
574 |
573 |
|
|
|
2003-04 |
|
1,313 |
517 |
547 |
8,285 |
26,309 |
23,286 |
5,429 |
2,586 |
300 |
|
|
2004-05 |
|
|
|
|
|
5,815 |
36,709 |
33,193 |
11,810 |
5,143 |
1,248 |
72 |
2005-06 |
|
|
|
|
|
|
9,858 |
41,279 |
43,903 |
23,707 |
8,501 |
2,263 |
2006-07 |
|
|
|
|
|
|
2,172 |
14,903 |
95,806 |
94,837 |
50,037 |
15,019 |
2007-08 |
|
|
|
|
|
|
|
508 |
11,376 |
61,524 |
74,459 |
44,009 |
2008-09 |
|
|
|
|
|
|
|
|
81 |
28,600 |
1,34,450 |
1,17,001 |
Total upto 2008-09 |
67,023 |
52,355 |
52,568 |
37,742 |
40,459 |
47,665 |
78,608 |
97,273 |
1,66,495 |
2,14,111 |
2,68,695 |
1,78,364 |
Grand Total # |
67,131 |
52,435 |
52,668 |
37,742 |
40,459 |
47,665 |
78,608 |
97,273 |
1,66,495 |
2,14,111 |
2,68,695 |
1,78,364 |
Percentage change |
-5.1 |
-21.9 |
0.4 |
-28.3 |
7.2 |
17.8 |
64.9 |
23.7 |
71.2 |
28.6 |
25.5 |
|
'#: (a) Includes assistance provided by the IDBI under Technical Development Fund (TDF) and Bills Rediscounting Scheme (BRS).
(b) The estimates are ex ante, incorporating only the envisaged investment, thus are different from those actually realized/utilized. |
3.1.2 Industrial Pattern of Projects
The industry-wise pattern of projects sanctioned assistance in 2008-09 is presented in Table 3 and Chart 1. Reflecting heavy concentration of intentions in infrastructure, half of the total project cost was accounted by the infrastructure group at Rs.2,13,563 crore. Investment in this group in recent years was largely led by high value projects in power and telecom sectors. Particularly in each of the last two years, the share of expenditure pertaining to power projects in the total cost of all projects rose to around 30 per cent, reflecting the predominance of intentions in power sector. At the same time, the investment intentions appeared to have re-emerged in telecom projects with their share rising to 16.4 per cent in 2008-09.
Table 2 : Phased Capital Expenditure of Projects Sanctioned in 2007-08 and 2008-09 |
(Rs crore) |
Capital expenditure in the Year→
Capital expenditure of Projects↓ |
2006-07 |
2007-08 |
2008-09 |
2009-10 |
2010-11 |
2011-12 |
2012-13 |
2013-14 |
Total |
1 |
2 |
3 |
4 |
5 |
6 |
7 |
8 |
9 |
10 |
Number of projects 879 |
Sanctioned in 2007-08 |
11,884 |
61,524 |
74,459 |
44,009 |
36,672 |
10,887 |
4,861 |
— |
2,44,296 |
| |
(4.9) |
(25.2) |
(30.5) |
(18.0) |
(15.0) |
(4.4) |
(2.0) |
— |
(100) |
Number of projects 750 |
Sanctioned in 2008-09 |
81 |
28,600 |
1,34,450 |
1,17,001 |
77,009 |
49,330 |
11,712 |
4,631 |
4,22,814 |
| |
— |
(6.8) |
(31.8) |
(27.7) |
(18.2) |
(11.6) |
(2.8) |
(1.1) |
(100) |
— : Nil / Negligible.
Note: Figures in brackets denote percentage shares in the total. |
Table 3: Industry-wise Distribution of Projects and their Cost in 2007-08 and 2008-09 |
Industry |
2007-08 |
2008-09 |
Number
ofProjects |
Project Cost |
Number
of
Projects |
Project Cost |
Amount (Rs.crore) |
Per cent Share |
Amount (Rs. crore) |
Per cent Share |
(1) |
(2) |
(3) |
(4) |
(5) |
(6) |
(7) |
1. |
Infrastructure |
129 |
99,874 |
40.9 |
115 |
2,13,563 |
50.5 |
| |
i) Power |
64 |
75,824 |
31.1 |
68 |
1,24,131 |
29.4 |
| |
ii) Telecom |
8 |
4,631 |
1.9 |
9 |
69,175 |
16.4 |
| |
iii) Ports & Airports |
6 |
1,993 |
0.8 |
4 |
8,708 |
2.1 |
| |
iv) Roads, Storage & Water Management |
4 |
4,924 |
2.0 |
5 |
521 |
0.1 |
| |
v) SEZ, Industrial, Biotech and IT Parks |
47 |
12,502 |
5.1 |
29 |
11,028 |
2.6 |
2. |
Sugar |
16 |
3,009 |
1.2 |
22 |
4,030 |
1.0 |
3. |
Textiles |
118 |
10,542 |
4.3 |
48 |
5,819 |
1.4 |
4. |
Paper & Paper Products |
17 |
2,048 |
0.8 |
25 |
4,628 |
1.1 |
5. |
Coke & Petroleum Products |
5 |
17,199 |
7.1 |
5 |
5,116 |
1.2 |
6. |
Chemicals & Petrochemicals |
26 |
2,508 |
1.0 |
27 |
5,212 |
1.2 |
7. |
Pharmaceuticals & Drugs |
38 |
5,027 |
2.1 |
31 |
1,993 |
0.5 |
8. |
Rubber & Plastic Products |
16 |
2,625 |
1.1 |
18 |
1,865 |
0.4 |
9. |
Cement |
24 |
13,530 |
5.5 |
28 |
18,522 |
4.4 |
10. |
Metals and Metal Products |
123 |
40,302 |
16.5 |
108 |
83,875 |
19.8 |
11. |
Transport Equipments |
38 |
8,136 |
3.3 |
31 |
9,643 |
2.3 |
12. |
Construction |
38 |
8,977 |
3.7 |
30 |
33,556 |
7.9 |
13. |
Hotels & Restaurants |
52 |
9,080 |
3.7 |
60 |
9,628 |
2.3 |
14. |
Transport Services |
17 |
3,248 |
1.3 |
15 |
3,350 |
0.8 |
15. |
Hospitals |
28 |
3,037 |
1.3 |
17 |
1,828 |
0.4 |
16. |
Others* |
194 |
15,153 |
6.2 |
170 |
20,187 |
4.8 |
Total |
879 |
2,44,296 |
100.0 |
750 |
4,22,814 |
100.0 |
* Comprise industries each with a share of less than 1 per cent in total cost of projects in 2007-08 and 2008-09. |
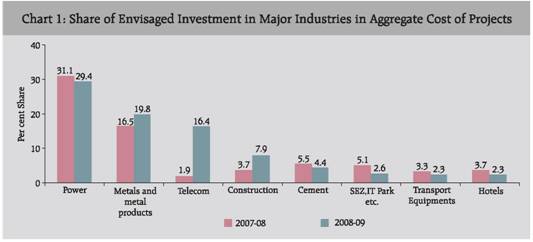
Corporates continued to intend making fresh investments in metals and metal products sector with their aggregate share in total project expenditure increasing to 19.8 per cent followed by projects in construction (7.9 per cent vis-à-vis 3.7 per cent) and cement (4.4 per cent vis-à-vis 5.5 per cent). The share of each of the remaining industry groups was less than 3 per cent in the total project cost. The maximum number of projects sanctioned assistance in 2008-09 belonged to infrastructure at 115, followed closely by 108 metals and metal products and 60 hotels and restaurants projects.
3.1.3 Size-wise pattern of projects
The size-wise distribution of the projects sanctioned assistance during 2008-09 showed the dominance of high value projects, each with a project cost of Rs.500 crore or more (Table 4). The share of such projects at around 85.0 per cent in the current period was higher by 15 percentage points compared to previous year. The aggregate project cost of 116 such projects at Rs.3,58,469 crore in 2008-09 was more than double the aggregate project cost of 87 projects at Rs.1,70,171 crore in 2007-08.
Table 4: Size-wise Distribution of Projects and their Envisaged Cost in 2007-08 and 2008-09 |
Size of projects (Rs. crore) |
2007-08 |
2008-09 |
Number
of
Projects |
Project Cost |
Number
of
Projects |
Project Cost |
Amount (Rs. crore) |
Per cent Share |
Amount (Rs. crore) |
Per cent Share |
1 |
2 |
3 |
4 |
5 |
6 |
7 |
Rs.10 crore to Rs.100 crore |
558 |
21,281 |
8.7 |
422 |
15,824 |
3.7 |
Rs.100 crore to Rs.500 crore |
234 |
52,844 |
21.6 |
212 |
48,521 |
11.5 |
Rs.500 crore to Rs.1,000 crore |
36 |
25,126 |
10.3 |
39 |
26,081 |
6.2 |
Rs.1,000 crore to Rs.5,000 crore |
46 |
94,791 |
38.8 |
58 |
1,18,028 |
27.9 |
Rs.5,000 crore to Rs.10,000 crore |
3 |
16,719 |
6.9 |
11 |
83,030 |
19.6 |
Rs.10,000 crore & above |
2 |
33,535 |
13.7 |
8 |
1,31,330 |
31.1 |
TOTAL |
879 |
2,44,296 |
100.0 |
750 |
4,22,814 |
100.0 |
Almost half of total cost was intended for the projects in the size range of Rs.1000 crore to Rs.10,000 crore. Very high-value 8 projects each envisaging more than Rs.10,000 crore formed almost one third of total intentions of 750 companies in 2008-09. In comparison, such very large projects claimed only 13.7 per cent of total cost of 879 projects in the previous year.
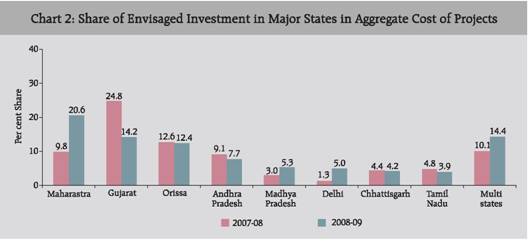
3.1.4 State-wise pattern of projects
The spatial pattern of proposed investment revealed by the 750 and 879 projects sanctioned in 2008-09 and 2007-08, respectively, is presented in Table 5 and Chart 2. There are wide variations in this pattern from year to year as location of few large projects changes the pattern considerably. With total proposed investment increasing sharply from Rs.23,856 crore (143 projects) in 2007-08 to Rs.87,081 crore (118 projects), Maharashtra picked up the highest share of 20.6 per cent in total proposed investment. Gujarat occupied the second position with a share of 14.2 per cent. This share was lower as compared to 24.8 per cent observed in 2007-08 notwithstanding that the absolute aggregate planned investment in Gujarat at Rs.59,997 crore was more or less at the previous year’s level of Rs.60,576 crore.
Table 5: State-wise Distribution of Projects and their Envisaged Cost during 2007-08 and 2008-09 |
State |
2007-08 |
2008-09 |
Number
of
Projects |
Project Cost |
Number
of
Projects |
Project Cost |
Amount (Rs. crore) |
Per cent Share |
Amount (Rs. crore) |
Per cent Share |
1 |
2 |
3 |
4 |
5 |
6 |
7 |
Andhra Pradesh |
88 |
22,316 |
9.1 |
77 |
32,697 |
7.7 |
Chhattisgarh |
10 |
10,763 |
4.4 |
19 |
17,654 |
4.2 |
Delhi |
19 |
3,263 |
1.3 |
15 |
21,321 |
5.0 |
Gujarat |
95 |
60,576 |
24.8 |
78 |
59,997 |
14.2 |
Haryana |
29 |
2,773 |
1.1 |
24 |
3,381 |
0.8 |
Himachal Pradesh |
23 |
3,656 |
1.5 |
18 |
2,303 |
0.5 |
Jharkhand |
15 |
6,734 |
2.8 |
9 |
5,250 |
1.2 |
Karnataka |
62 |
9,484 |
3.9 |
46 |
8,230 |
2.0 |
Madhya Pradesh |
19 |
7,295 |
3.0 |
20 |
22,272 |
5.3 |
Maharashtra |
143 |
23,856 |
9.8 |
118 |
87,081 |
20.6 |
Orissa |
22 |
30,763 |
12.6 |
21 |
52,450 |
12.4 |
Rajasthan |
23 |
2,843 |
1.2 |
22 |
1,822 |
0.4 |
Tamil Nadu |
94 |
11,742 |
4.8 |
68 |
16,570 |
3.9 |
Uttar Pradesh |
41 |
9,562 |
3.9 |
33 |
10,002 |
2.4 |
Uttarakhand |
27 |
1,721 |
0.7 |
20 |
4,112 |
1.0 |
West Bengal |
41 |
5,862 |
2.4 |
46 |
10,514 |
2.5 |
Multi-State |
62 |
24,747 |
10.1 |
59 |
60,659 |
14.4 |
Others* |
66 |
6,340 |
2.6 |
57 |
6,499 |
1.5 |
Total |
879 |
2,44,296 |
100.0 |
750 |
4,22,814 |
100.0 |
*: Comprise states/ union territories, each with share of less than 1 per cent in aggregate cost of projects in 2007-08 and 2008-09. |
The share of multi-state projects was higher at 14.4 per cent mainly on account of telecom sector projects and also due to projects in construction that were mostly engaged in telecom infrastructure. Orissa secured the next position with 12.4 per cent share followed by Andhra Pradesh (7.7 per cent), Madhya Pradesh (5.3 per cent), Delhi (5.0 per cent), Chhattisgarh (4.2 per cent) and Tamil Nadu (3.9). Each of the other states had a share of less than 3.0 per cent.
3.1.5 Purpose-wise pattern of projects
The purpose-wise pattern of projects revealed that close to three fourth of aggregate investment intentions were into new projects, despite a slight drop in the number of such projects in 2008-09. Another 250 projects proposed for the purposes of expansion and modernisation accounted for 26.5 per cent as against 361 such projects with a share of 33.9 per cent during 2007-08 (Table 6).
3.2 Envisaged capital expenditure of companies raising funds from ECBs
Based on the information on ECBs as available in Form 83 and ECB2 Returns submitted to the Reserve Bank, amount of loan contracted primarily for capex purpose and its corresponding drawal schedule were taken to broadly represent company’s total investment intentions and capital expenditure over the phasing schedule, respectively. The capital expenditure in any given year was then derived as total of drawal amounts in that given year from the loan amounts contracted in various years up to and including the reference year. In cases, where the company approached banks/FIs for assistance and also contracted ECBs to part finance its project investment during the reference period, the care was taken to avoid double counting of the same company present in both the sources.
Table 6: Purpose-wise Distribution of Projects and their Envisaged Cost during 2007-08 and 2008-09 |
Purpose |
2007-08 |
2008-09 |
Number
of
Projects |
Project Cost |
Number
of
Projects |
Project Cost |
Amount (Rs. crore) |
Per cent Share |
Amount (Rs. crore) |
Per cent Share |
1 |
2 |
3 |
4 |
5 |
6 |
7 |
New |
486 |
1,59,105 |
65.1 |
477 |
3,07,133 |
72.7 |
Expansion & Modernisation |
361 |
82,682 |
33.9 |
250 |
1,12,101 |
26.5 |
Diversification |
7 |
580 |
0.2 |
13 |
2,221 |
0.5 |
Others |
25 |
1,929 |
0.8 |
10 |
1,359 |
0.3 |
Total |
879 |
2,44,296 |
100.0 |
750 |
4,22,814 |
100.0 |
Reflecting depressed international capital market conditions, flows from ECBs dropped in 2008-09 in contrast to steady increases in last four years. Loans for spending primarily on fixed assets reflected investment intentions worth Rs.31,215 crore in 2008-09 by 272 non-financial companies in private corporate sector as compared to Rs.33,068 crore and Rs.51,331 crore worth of such intentions in 2007-08 and 2006-07, respectively.
Capital expenditure which was expected to be incurred in 2008-09 by the companies contracting ECBs since 2003-04 works out to be Rs.41,706 crore, of which, a large part (Rs.19,748 crore) was intended to be spent by the companies which contracted loans prior to 2008-09. Based on available information, envisaged capital expenditure in 2009-10 by the companies that contracted ECBs upto 2008-09 stood at Rs.13,971 crore.
3.3 Envisaged capital expenditure of companies raising funds from IPOs/FPOs/ Rights Issues
During 2008-09, 45 non-government non-financial private limited companies raised Rs.14,686 crore through public/rights issues. Excluding 24 companies that also approached banks/FIs or contracted ECBs for part financing, the total issue size adds up to Rs.1,032 crore for remaining 21 companies which reported investment plans aggregating to Rs.934 crore spread over five years. These companies intended to spend Rs.621 crore on fixed assets in 2008-09 and Rs.56 crore in 2009-10. Spending of Rs.5,079 crore and Rs.501 crore in 2008-09 and 2009-10, respectively was envisaged by the companies which came out with rights/public issues in years prior to 2008-09. Thus, total capex intentions of such companies amounted to Rs.5,700 crore in 2008-09 and Rs.557 crore in 2009-10.
4. Assessment and Prospects
4.1 Assessment of 2008-09
Though the economic activity witnessed deceleration in 2008-09 with GDP growth at 6.7 per cent as against 9.0 per cent recorded in previous year, overall investment intentions of institutionally covered companies surpassed that in 2007-08.
Moderation in key economic indicators such as industrial production, exports and corporate profits, particularly in the second half of 2008-09 reflected slowdown in both export and domestic demand following the widespread financial turmoil in several parts of the world. After recording a growth of 9.0 per cent or more for 9 successive quarters till 2007-08, quarterly real GDP growth declined to 7.8 per cent in the first half and further to 5.8 per cent in the second half of 2008-09. The profits of private corporate sector being pro-cyclical showed contraction primarily due to asymmetric adjustment of operating costs and product prices to the weakening aggregate demand conditions. Industrial growth started decelerating since 2007-08 and the slowdown became pronounced in 2008-09. The production of capital goods decelerated to 7.0 per cent in 2008-09 from about 18 per cent growth in the preceding two years. A strong credit growth during the first half of 2008-09 also started receding from the third quarter. Business confidence suffered in the second half considerably.
Despite moderation in the credit conditions and business confidence in the second half of 2008-09, the companies’ investment intentions remained largely unaffected. The total envisaged cost of projects sanctioned assistance by banks/FIs in 2008-09 at the level of Rs.4,22,814 crore far surpassed the previous high of Rs.2,44,296 crore in 2007-08. The information on phasing details of such projects revealed that the envisaged capital expenditure in 2008-09 and prior years amounted to Rs.2,68,695 crore, indicating 25.5 per cent rise over that of the previous year. In addition to the investment intentions of above companies, companies that raised resources through ECBs or domestic equity issuances envisaged capital expenditure of Rs.41,706 crore and Rs.5,700 crore, respectively during 2008-09.
Collecting capex intentions of all companies under study, capital expenditure that might have been incurred in 2008-09 worked out to be substantial Rs.3,16,101 crore of which the fresh intentions of Rs.1,57,029 crore came up in 2008-09 itself by 1043 companies.
4.2 Prospects for 2009-10
Outlook for demand would continue to be a significant factor driving investment intentions. The Reserve Bank of India, in its First quarter review of Monetary Policy 2009-10 placed real GDP growth in 2009-10 at 6.0 per cent (with an upward bias) in the backdrop of uncertainty arising primarily from global financial markets and the severe downturn in some advanced economies. Though financing concerns relating to credit availability do not appear to be a constraining factor for corporate investment, the drop in profits and the subdued capital markets may limit their capacity to invest. With prospects of decelerating pace in growth of domestic and global economy, coupled possibly with emerging excess capacities in some sectors, the climate for investment seems to have turned less conducive than in recent years. However, as in preceding years, the new investments in infrastructure projects, particularly in power and telecom are expected to continue given the continuous growing demand in these sectors.
The minimum aggregate capital expenditure in 2009-10 that may match with the level of capex intentions in 2008-09 would be the summation of pipeline investment intentions of the projects, which were intended prior to 2009-10 and the new capital spending proposals expected to come up during 2009-10 itself.
For the first part, capital expenditure planned to be spent in 2009-10 aggregated to Rs.1,92,892 crore. If the companies do not defer the investment decisions and adhere to their investment plans, this pipeline investment is expected to help maintain the momentum of investment in 2009-10.
For the second part, if the aggregate capex in 2009-10 were to match the capex envisaged in 2008-09 (Rs.3,16,101 crore), the minimum capital expenditure of around Rs.1,23,209 crore needs to show up from the new investment intentions of 2009-10 by the companies in private corporate sector. Though uncertainty about demand would weigh on investment decisions, it is still likely that investments in 2009-10 can be maintained around last year’s level. There are recent indications of improvements in business sentiments and corporate profitability. The low leverage ratios of the corporates in general, thrust on PPP projects and relaxed infrastructure investment norms as announced in budget 2009-10 are positives for investment demand, especially in infrastructure, the main driver of the recent upsurge in corporate investment.
* Prepared in the Corporate Studies Division of the Department of Statistics and Information Management. The previous study titled 'Corporate Investment: Growth in 2007-08 and Prospects for 2008-09' was published in the August 2008 issue of the Bulletin. 1 ICICI Bank, Infrastructure Development Finance Company, IFCI, Life Insurance Corporation, Power Finance Corporation, Infrastructure Leasing & Financial Services Limited, EXIM Bank, all public sector (including IDBI Bank) and major private and foreign banks. 2 As per the available information, private corporate sector (non-financial companies) raised funds amounting to Rs. 31,083 crore in 2008-09 (Rs. 41,386 crore in 2007-08) through private placement but the proportion of these funds allocated to capital expenditure and the phasing details of their future use were not available. Also, funds raised through ADRs/GDRs (excluding banks and financial institutions) amounted to Rs. 4,788 crore in 2008-09 (Rs.13,023 crore in 2007-08) but further details on ownership, end use and expenditure pattern over years were not available. 3See also the technical note attached to “Growth of Corporate Investment: An attempt at projection for 1999- 2000’ published in the Monsoon 1999 issue of the Reserve Bank of India Occasional Papers for details.
4Projects with total cost of more than Rs.10 crore. The projects based on Build, Operate, Own and Transfer (BOOT) were also covered for the assessment of capital spending by private corporate sector. |


