 IST,
IST,


Determinants of Overnight Uncollateralised Money Market Volume - An Empirical Assessment
|
by Srijashree Sardar and Alqama Pervez^ The money market in India has undergone significant changes in the past few decades. This article aims to analyse different segments of the money market with a focus on the overnight call money market and its volume. The empirical findings suggest that the system liquidity conditions and the spread of the weighted average call rate over the policy repo rate have a significant impact on the call transaction volume. While forward premia divergence and inflows to government also have a positive impact on call money volume, the volume of the collateralised segment, outflows from government and truncated trading hours had a negative bearing on it. Introduction The Indian money market is segmented into short-term unsecured loans (call), collateralised lending and borrowing (including repurchase agreements), commercial papers (CPs), certificates of deposit (CDs) and treasury bills (T-bills). The unsecured market is dominated by the overnight segment (Call) whereas the triparty repo (TREP), that involves several non-bank participants such as mutual funds, dominates the collateralised segment. The call market is the uncollateralised money market, with maturities ranging from overnight to one year1, which allows banks and select financial institutions (primary dealers) to borrow and lend funds for managing their short-term liquidity needs. The volume-weighted average call rate (WACR) is the operating target of the Reserve Bank of India’s (RBI) monetary policy as monetary transmission is the fastest to the uncollateralised interbank segment (RBI, 2011) and as WACR is a variable that monetary policy can directly control with its actions (RBI, 2014). Therefore, a study of the various factors that impact the volume of this segment on a day-to-day basis becomes extremely necessary. The rest of the paper has been split into five sections. Section II presents the overview of the call money market; Section III provides the history of the call money market in India; few stylised facts related to the call money market in India are presented in Section IV; Section V undertakes the empirical analysis for determining the factors influencing overnight call money market volume and the last section concludes the findings. Banks in India have a regulatory requirement of maintaining reserves. Scheduled banks must maintain the required reserves in the form of current account balance with the RBI, whereas non-scheduled co-operative banks and local area banks may maintain reserves in the form of cash with themselves or by way of balances in current accounts with the RBI or with other banks.2 Reserve requirements serve dual purpose – they act as a source of liquidity for banks along with serving as a tool of monetary policy for the central bank. The central bank can create or extinguish bank reserves, also known as system liquidity, using its liquidity management tools that include open market operations, repo/reverse repo operations and FX swap operations. System liquidity may also be impacted by certain other factors which may be transient/frictional or durable in nature. Transient/frictional changes to liquidity are those that could reverse course within a short timeframe, including a day. Government balances with the Reserve Bank are a major source of transient/frictional changes in reserves. Durable shifts in liquidity arise from lasting changes in the liabilities of the Reserve Bank viz., expansion/contraction in currency in circulation (CiC) and changes in banking system reserves due to unsterilised FX intervention operations (RBI, 2019). The call money market primarily acts as an avenue for eligible participants to lend and borrow reserves among themselves for short duration (majorly overnight). Under neutral or near-neutral banking system liquidity conditions, the Call rate tends to move between the Liquidity Adjustment Facility (LAF) corridor with the Standing Deposit Facility (SDF) rate and the Marginal Standing Facility (MSF) rate acting as the floor and the ceiling of the corridor, respectively. During times of excessive surplus liquidity, Call rates tend to converge with the SDF rate as banks have no incentive to lend below the SDF rate. However, non-scheduled co-operative banks and local area banks maintaining reserve balance with other banks may switch their excess balance into Call money with their correspondent banks or with any other eligible borrower to earn overnight remuneration. Such transactions may be below SDF rate since these co-operative and local area banks do not have access to the RBI’s SDF. Conversely, under deficit liquidity conditions, banks tend to borrow at around the MSF rate as interbank transactions do not suffice for overnight reserve requirements and there has to be a net borrowing of reserves from the RBI at the end of the day. Primary dealers (PDs), who do not have access to the MSF window, may, however, transact at rates above the MSF rate in the Call segment during the day. A screen-based, quote-driven, electronic trading platform - NDS-CALL, launched in 2006, facilitates call market operations. III.1. Participants Until 1971, the call money market exclusively operated as an interbank market. The Unit Trust of India and the Life Insurance Corporation of India were granted permission to participate as lenders in this segment in 1971. Subsequently, several other non-bank participants were permitted to lend in the call money market. Primary dealers were allowed to act both as lenders and borrowers. However, by the early 2000s, the RBI began to revert to a pure interbank call money market with PDs being the only non-bank entity allowed. Migration of other market players towards the collateralised segments of the market led to greater overall market stability and diversification. Non-bank entities, with the exception of PDs, had completely withdrawn from the call money market by August 2005 (Mohanty, 2012). III.2. Prudential Limits Based on the recommendations of the Narasimham Committee (1998), the Reserve Bank stipulated prudential limits on lending and borrowing by participants in call money in a phased manner. In April 2005, these limits were linked to capital funds for scheduled commercial banks. Till recently, such banks were allowed to borrow up to 100 per cent of their Tier I and Tier II capital on a daily average basis in a reporting fortnight, and 125 per cent of owned funds on any given day in the Call and Notice market. However, in June 2023, scheduled commercial banks (excluding small finance banks and payments banks) were allowed to establish their own limits for borrowing in the money market while adhering to the prudential limits for interbank liabilities prescribed by the Reserve Bank of India. The changes were intended to enhance banks’ flexibility in managing their money market borrowings. Furthermore, in terms of the extant guidelines, prudential limits relating to lending transactions can be determined by the eligible institutions themselves with the approval of their respective Board.3 III.3. Interest Rates Prior to December 1973, call money rates were determined by the market forces. However, as the rates routinely surpassed 25-30 per cent, the Indian Banks’ Association (IBA) found it needful to interfere and bring stability to the market. The IBA believed that prolonged high interest rates would disrupt the operations of the entire banking system and would contradict the fundamental goals of planned credit allocation under a regulated lending rate framework. Thus, a ceiling of 15 per cent was set on Call rate in December 1973, which was modulated time to time (RBI, 1987). With the phased introduction of the LAF in 2000, the repo rate (and later the MSF rate) became the implicit ceiling for the Call rate. In 2011, the Reserve Bank adopted the WACR as the operating target of its monetary policy. IV.1 Transaction Volumes Activity in the Indian money market has increased significantly in recent years, with the collateralised segment, led by the triparty repo, dominating in terms of transaction volume. The collateralised segment had an average volume share of 96 per cent as against 4 per cent share of the uncollateralised call money market during the period under consideration (January 2019 to December 2024) (Chart 1a). While the transacted volume of the call segment has nearly halved from 2019 to 2024, its share in the overall money market has shrunk to 2 per cent in December 2024 from 10 per cent in January 2019. The average daily traded volume in TREP and market Repo increased to ₹3.4 lakh crores and 1.4 lakh crores in 2024 from 1.4 lakh crores and 0.5 lakh crores, respectively, in 2019 (Chart 1b).  Within the uncollateralised call money segment, the overnight segment dominates in terms of volume (Chart 2). Despite several measures taken by the Reserve Bank over the years, volumes in the Notice and Term money segments remain very low - on an average 6 per cent of the overall call money volume during the study period. IV.2 Participants Profile Entities currently eligible to participate in the Call, Notice and Term money markets, both as borrowers and lenders are scheduled commercial banks (including payment banks and small finance banks), regional rural banks, co-operative banks (state co-operative banks, district central co-operative banks and urban co-operative banks) and primary dealers. Primary dealers are the major borrowers in the segment. The share of PDs has increased over the years while the share of public sector banks (PSBs) and private banks (PVBs) declined correspondingly (Chart 3a). The share of monthly borrowing volume of PDs was on an average 59 per cent of the total transacted volume in the uncollateralised segment during the period from 2019 to 2024, which increased gradually over time from 30 per cent in 2019 to 79 percent in 2024. The borrowing share of PSBs has come down drastically, from 32 per cent in 2019 to 3 per cent in 2024, with that of PVBs also declining steadily during the same period as banks increased their borrowing activity in the collateralised segment. On the other side, co-operative banks are the major lenders in the segment. The transaction volume of co-operative banks has not changed significantly over time, although their share has increased since 2019 (Chart 3b). This is mainly due to the transaction volume of PSBs and PVBs decreasing substantially, especially during the COVID-19 pandemic period. While the share of co-operative banks in the monthly lending volume was around 66 per cent during the pandemic, its share in lending was on an average 57 per cent of overall transacted volume during the period of 2019 to 2024. Co-operative banks participation in call money market decreased significantly after the Reserve Bank’s directive for mandatory membership on NDS-CALL trading platform for call money market activity4. It has, however, rebounded in the recent months, suggesting an increase in membership of co-operative banks.   IV.3 Transacting Mechanism Call money transactions are executed either on the NDS-CALL platform, a screen-based, quote-driven electronic trading system managed by the CCIL, or through bilateral communication outside the NDS-CALL platform, which must be subsequently reported on the platform by the transacting members. These are called traded deals and reported deals, respectively. Entities that do not have NDS-CALL membership must report the deals directly to the RBI. Traditionally, traded and reported deals have differed in terms of participants, rates and volume, with the latter predominantly comprising of transactions between non-scheduled co-operative banks (mostly non-members of NDS-CALL) and their correspondent banks or other eligible borrowers. However, the share of reported deals in the overall call money market segment has dwindled sharply post the RBI Master Direction5 dated April 1, 2021, and the subsequent Fixed Income Money Market and Derivatives Association of India (FIMMDA) notification6 dated September 29, 2022, in terms of which all eligible participants in the Call, Notice and Term money markets were required to obtain membership of NDS-CALL platform in due course of time. IV.4 Traded and Reported Deals The monthly share of traded deals within the call money market has been rapidly increasing since Q1 of 2022 as transactions between member counterparties have increased over those with non-members, especially following the RBI’s directive for mandatory membership on NDS-CALL trading platform for call money market activity. The share of reported deals has been almost nil since December 2023 (Chart 4).  IV.5 Temporal Distribution of Trades A peculiar feature of the call money market is the skewed distribution of trades within the day. The bulk of the trades occur in the first hour of any given day which may be attributed to the fact that primary dealers, the major borrower in the segment, tend to fulfil their funding needs early in the day. Chart 5 shows the temporal distribution of trades in the call money market under four different scenarios within the period of study –
Transaction volume in the Call segment is impacted by several factors. This paper attempts to study the extent to which the transaction volume is influenced by system liquidity conditions as well as other factors like activity in the collateralised segment (TREP and market repo), changes in government balance with the RBI, spread of the WACR over policy repo rate, monetary policy announcement, USD/INR forward premia, market hours and the RBI regulations. To examine the determinants of the volume in Call market, the study employs the overall volume of the overnight segment (traded and reported) as a dependent variable. For this purpose, we have used daily data from January 1, 2019 to December 31, 2024, excluding working Saturdays7 since the call money market volumes remain very low on these days with limited participant base. The dependent variables chosen and their expected influence on the independent variable are discussed below and summarized in Table 1. V.1. Influencing Factors and Their Impact (i) Net System Liquidity: As the call money segment majorly acts as a platform for redistribution of reserves, the net banking system liquidity, measured as the net liquidity absorbed by the central bank on any given day (liquidity absorbed under SDF and variable rate reverse repo operations net of liquidity injected through MSF, repo operations and standing liquidity facilities) and published daily by the RBI in the form of Money Market Operations Press Release, is expected to serve as an important determinant of Call volume. When the system is flush with liquidity, banks have less reasons to transact in the call market as most banks are holding adequate reserves to meet their regulatory and settlement needs (Chart 6). It is under constrained liquidity scenario that market participants have to actively vie for reserves, pushing up Call volume.  Under Different Scenarios")  (ii) Spread of the Weighted Average Call Rate over Repo Rate: The call money market being the primary avenue for banks to transact in reserves and the policy repo rate being the midpoint of the LAF corridor, a rise in the spread of the WACR over the repo rate is usually associated with an increase in the overnight call volume as it indicates a heightened demand for reserves (Chart 7).  (iii) Transaction Volume in TREP and Market Repo Segments: The collateralised TREP and market repo segments provide avenue to banks as well as non-bank participants to lend and borrow for short term, largely overnight. Mutual funds (MFs) dominate the lending side of TREP, cornering more than 60 per cent of the share in terms of volume lent, while banks remain on the borrowing side. In market repo, which is subdivided into basket repo and special repo segments, PDs are the major borrowers with MFs and foreign banks being most active on the lending side. While the borrowing needs of PDs and banks are driven by their demand for reserves, the lending volume of MFs in the money market is largely an outcome of their investment mandate. Therefore, a heightened lending activity in the collateralised segment of the money market by MFs may, to an extent, lead to the fulfilment of demand of PDs and banks for short term liquidity, thereby leading to decline in Call volume. (iv) Government Flows: The RBI, being the banker to the Government of India (GoI) as well as to the state governments (except Sikkim), maintains their accounts into which taxes and other receipts flow and from which government expenditures and other payments are made. Transfers to and from the government accounts impact banking system liquidity. Large outflows to the government by way of tax collection or auction proceeds reduce banks’ reserve position, increasing Call market activity, while inflows to the banking system by way of government spending or bond maturities inject liquidity into the banking system, curtailing the need for banks and PDs to resort to Call market to seek reserves. In this study, we analyse the impact of large flows to and from the Government of India on a particular day on the Call volume. (v) Monetary Policy Announcement: Activity in the Call market is expected to spike on the days of the RBI’s monetary policy announcement as banks may choose to re-position their reserve balances ahead or post the Monetary Policy Committee (MPC) decision. (vi) USD/INR Forward Premia: The forward premium for a tenor for a currency pair should ideally reflect the interest rate differential between the currencies at that tenor. However, the forward premia may diverge from the interest rate differentials due to demand-supply dynamics or various market imperfections, creating arbitrage opportunities. When the short-term USD/INR forward premia are considerably wider than the difference between the short-term interest rates in India and the US, a bank may borrow in the Indian money market, receive the forward premia (i.e., do a buy-sell USD/INR swap) and lend in USD to earn a risk-free profit to the extent of the excess forward premia. On the other hand, if the short-term USD/INR forward premia are considerably narrower than the difference between the short-term interest rates in India and the US, a bank may borrow in USD, pay the forward premia (i.e., do a sell-buy USD/INR swap) and lend in the Indian money market to earn a risk-free profit to the extent of the deficit forward premia. While such transactions are subject to certain regulatory controls and other market frictions, they are expected to positively impact the volumes in the Call market. (vii) Market Hours: In the wake of the COVID-19 pandemic, trading hours for various markets regulated by the Reserve Bank, including the call money market, were truncated. The timings were subsequently normalized in a phased manner. Trading volume in Call market is expected to be lower during shorter market hours due to subdued overall market activity and vice versa. (viii) RBI Regulations: The Reserve Bank, vide its Master Direction8 dated April 1, 2021, instructed all eligible players in the call money market to acquire membership of NDS-CALL platform in due course of time. This is expected to have a negative bearing on Call volume as non-members of NDS-CALL were not able to participate in the market, at least temporarily till obtaining membership. V.2. Methodology and Empirical Results The descriptive statistics and the contemporaneous correlation matrix of the variables considered in the empirical analysis are given in Annex Tables A1 and A2. Augmented Dickey-Fuller (ADF) test was employed for checking stationarity (mean reverting property) of variables. The variables were found to be stationary at level (Annex Table A3). Prior to developing the model, the pairwise granger causality test was employed on the variables to understand the usefulness of the determinants considered for the analysis in predicting the future values of the response variable i.e., the volume of uncollateralised overnight segment of money market. The result of the test suggests that WACR spread over repo rate and net system liquidity have bidirectional relationship with Call market volume while the overnight collateralised segment of money market (TREP and market repo), government inflows and outflows, forward premia divergence, trading hours of call money market and the Reserve Bank’s regulation regarding the mandatory membership in NDS-CALL platform have one-sided granger causality on the overnight call money market segment. The MPC announcement do not granger cause the dependent variable (Table 2). OLS regression estimation often faces the challenge of dealing with autocorrelation in volatility or volatility clustering when using high frequency data (Annex Table A4). Hence, the GARCH (Generalised Autoregressive Conditional Heteroskedasticity) model is suitable as it takes into account the error variance, in which the variance follows an autoregressive (AR) process. Bollerslev (1986) developed the GARCH (1,1) framework, and according to this framework, we can estimate the volume of the overnight call money market using the mean equation given below: 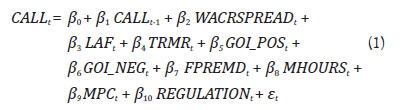 It indicates that the overnight volume of uncollateralised money market at time “t” (CALLt) is dependent on its own lag, WACR spread over policy repo rate (WACRSPREAD), net system liquidity (LAF), collateralised segments of money market i.e., aggregate volume of triparty repo and market repo (TRMR), significant inflows to the government (GOI_POS), significant outflows from the government (GOI_NEG), forward premia divergence (FPREMD), market hours (MHOURS), MPC announcement day (MPC), Reserve Bank of India’s direction to all eligible participants, including cooperative banks, to acquire NDS-CALL membership (REGULATION) and the error term (εt). To avoid potential model misspecification arising from seasonal effects, all indicators (excluding dummy variables) have been seasonally adjusted prior to analysis. In our model, the overnight uncollateralised call money market volume, collateralised money market volumes and net LAF indicators are considered in ₹ lakh crores unit. We have used six dummy variables which are taking the values ‘0’ and ‘1’. Further, the εt is dependent on some lagged information (Ω–1) and conforms to a student’s t-distribution (‘v’ degrees of freedom) with zero mean and its variance (ht). For more robust volatility modelling and better risk estimates for fat tail series, a GARCH model with t-distribution often outperform a GARCH with normal errors. 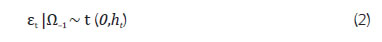 Here, the variance equation is expressed as follows: 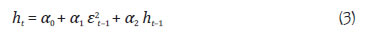 The estimation result of GARCH (1,1) model is displayed in Table 3. The result of the above mean equation of GARCH model suggests that the coefficients of net system liquidity, WACR spread over policy repo rate, inflows to the government and forward premia divergence are statistically significant and exhibit expected positive sign, while the volume of the collateralised segments of money market i.e., aggregate volume of triparty repo and market repo, outflows from the government and truncated market hours have significant expected negative impact. Furthermore, during the period after the regulation of Reserve Bank’s directive to all eligible participants for obtaining NDS-CALL membership, the demand for short term uncollateralised money market declined, and that is reflected in the above result. However, MPC announcement day impact are not significant on overnight unsecured segment though the coefficient has the expected sign. Conditional Variance and News Impact Curve: The estimates of conditional volatilities demonstrate the significance of a properly specified volatility model. Here, the coefficients of conditional volatilities ARCH and GARCH impact are positive and highly significant (Table 3). The GARCH conditional volatility graph of overnight call money market volume shows a downward trend of volatility from the beginning of the pandemic to post-pandemic period probably due to factors, such as changes in market uncertainty, policy interventions, and liquidity conditions (Chart 8a). Furthermore, the volatility model implicitly incorporates the concept of a news impact curve that describes how previous return shocks affect return volatility. Given that the GARCH model’s news impact curve is symmetric and centred at Et-1 = 0, it can be concluded that conditional volatility is not asymmetrically affected by positive or negative return shocks of same magnitude. (Chart 8b).  Residual Diagnostics: The residual diagnostics for the model’s stability have been checked, and those are satisfied (Table 3 and Annex Table A5). The robustness of the estimation process was confirmed by regression residuals, which mostly stayed within the two standard deviations band (Annex Chart A1). V.3. Evaluation of Forecast Accuracy The forecasting performance of the proposed GARCH model is evaluated against the random walk benchmark to assess its relative predictive accuracy. The proposed GARCH (1,1) model outperforms the random walk, with significantly lower forecast errors (MAE and RMSE) (Table 4). Furthermore, the Diebold-Mariano test yields a statistically significant result providing strong evidence that the proposed model delivers significantly better forecasts than the random walk, thereby validating the model choice. While trade volumes in the collateralised segment far surpass those in the unsecured interbank market, in line with the trends observed in major markets globally, the weighted average call rate remains the operating target of the RBI’s monetary policy as this is a segment that purely deals in central bank reserves, which monetary policy actions can directly control. Therefore, it is important from the policy perspective to understand the determinants of the volume in the Call market. Our empirical findings suggest that the net liquidity injection into the banking system and the WACR spread over policy repo rate exhibit a statistically significant impact on Call transaction volume. Also, the analysis reveals a significant negative relationship between the volume of the money market’s collateralised segment and the uncollateralised overnight segment, suggesting that the two segments supplement each other. Further, while inflow to the government away from the banking system results in rise in Call volume, outflows from the government to the banking system expectedly result in a fall in the volume. Divergence of overnight forward premia from the interest rate differential has a positive impact on Call volume, suggesting arbitrage by banks during times of such divergence; truncated trading hours and the RBI directive dated April 2021 on NDS-CALL membership negatively impacted transaction volume in the overnight uncollateralised money market, as anticipated. MPC announcement, however, does not have a significant impact on Call volume. The above findings can serve as a useful guide in fostering money market and monetary policy reforms in India. References: Bech, M., and Monnet, C. (2016). A Search-based Model of the Interbank Money Market and Monetary Policy Implementation. Journal of Economic Theory, 164, 32-67. Bollerslev, T. (1986). Generalized Autoregressive Conditional Heteroskadasticity. Journal of Econometrics, 31, 307-327. Corradin, S., Eisenschmidt, J., Hoerova, M., Linzert, T., Schepens, G., and Sigaux, J. D. (2020). Money markets, central bank balance sheet and regulation (No. 2483). ECB Working Paper. Freixas, X., and Holthausen, C. (2001). Interbank Market Integration and Asymmetric Information. Review of Financial Studies. WP No. 74. Hansen, P. R., and Lunde, A. (2005). A Forecast Comparison of Volatility Models: Does Anything Beat A GARCH (1,1). Journal of Applied Econometrics, 20, 873-889. Joshi, H (2004). The Interbank Money Market in India: Evidence on Volatility, Efficacy of Regulatory Initiatives and Implications for Interest Rate Targeting. Reserve Bank of India Occasional Papers, 25 (1, 2 & 3). Mohanty (2012). Money market and monetary operations in India, BIS central bankers’ speeches. Nath, G. C. (2018). Repo market and market repo rate as a collateralised benchmark rate. CCIL Monthly Newsletter-August 2018. Patra, M. D., Kapur, M., Kavediya, R., and Lokare, S. M. (2016). Liquidity Management and Monetary policy: From corridor play to marksmanship. Monetary Policy in India (pp. 257-296). Springer, New Delhi. RBI (1987). Report of the Working Group on the Money Market. Reserve Bank of India. RBI (2005). Report of the Technical Group on Money Market. Reserve Bank of India. RBI (2011), Report of the Working Group on Operating Procedure of Monetary Policy. Reserve Bank of India. RBI (2014). Report of the Expert Committee to Revise and Strengthen the Monetary Policy Framework. Reserve Bank of India. RBI (2019). Report of the Internal Working Group to Review the Liquidity Management Framework. Reserve Bank of India. Roy, T. (2023). The Reserve Bank of India: Volume 5, 1997-2008. Cambridge University Press; 2023. Thompson, J. (2003). Intervention by Central Banks in the Money Market. CIBEF, Liverpool Business School, Liverpool. Whitesell, W. (2006). Interest Rate Corridors and Reserves. Journal of Monetary Economics.53, 1177-1195. Annex
 ^ The authors are from Financial Stability Department (FSD) and Financial Markets Operations Department (FMOD), Reserve Bank of India, respectively. The valuable suggestions received from Shri G. Seshsayee, FMOD, and Shri Satish Chandra Rath, FMOD, are gratefully acknowledged. The views expressed in the article are those of the authors and do not reflect the views of the Reserve Bank of India. 1 Overnight transactions are referred to as Call money. If funds are borrowed/lent for more than one day and up to 14 days, it is referred to as Notice money, and if the period ranges from 15 days to 1 year, it is referred to as Term money. 2 Master Direction - Reserve Bank of India [Cash Reserve Ratio (CRR) and Statutory Liquidity Ratio (SLR)] Directions – 2021, reference number DOR.No.RET.REC.32/12.01.001/2021-22 dated July 20, 2021 (Updated as on December 16, 2024) 3 Reserve Bank of India. (Call, Notice and Term Money Markets) Directions, 2021-Review, reference number FMRD. DIRD. 02/14.01.001/2023-24 dated June 08, 2023. (https://rbi.org.in/web/rbi/-/notifications/reserve-bank-of-india-call-notice-and-term-money-markets-directions-2021-review-12511) 4 Master Direction - Reserve Bank of India. (Call, Notice and Term Money Markets) Directions, 2021, reference number FMRD.DIRD.02/14.01.001/2021-22 dated April 01, 2021 (Updated as on June 08, 2023) (https://rbi.org.in/web/rbi/-/notifications/master-direction-reserve-bank-of-india-call-notice-and-term-money-markets-directions-2021-updated-as-on-june-08-2023-lt-span-gt-12061) 6 FIMMDA notice about Membership of NDS-CALL Platform – FIMNOT/2022-23/06 dated September 29, 2022. (https://www.fimmda.org/Uploads/general/06-Membeship_nds_call_platform_29092022.pdf) 7 Saturdays of the month when banks are operational, i.e., all Saturdays except 2nd and 4th Saturday of the month 8 Master Direction - Reserve Bank of India. (Call, Notice and Term Money Markets) Directions, 2021, circular no. FMRD.DIRD.02/14.01.001/2021-22 dated April 01, 2021 (Updated as on June 08, 2023) (https://rbi.org.in/web/rbi/-/notifications/master-direction-reserve-bank-of-india-call-notice-and-term-money-markets-directions-2021-updated-as-on-june-08-2023-lt-span-gt-12061) |
|||||||||||||||||||||||||||||||||||||||||||||

ਇਸ ਪੇਜ ਨੂੰ ਸ਼ੇਅਰ ਕਰੋ:


ਭਾਰਤੀ ਰਿਜ਼ਰਵ ਬੈਂਕ ਮੋਬਾਈਲ ਐਪਲੀਕੇਸ਼ਨ ਇੰਸਟਾਲ ਕਰੋ ਅਤੇ ਨਵੀਨਤਮ ਖਬਰਾਂ ਤੱਕ ਤੇਜ਼ ਐਕਸੈਸ ਪ੍ਰਾਪਤ ਕਰੋ!
ਸਾਡੀ ਐਪ ਇੰਸਟਾਲ ਕਰਨ ਲਈ QR ਕੋਡ ਸਕੈਨ ਕਰੋ।


ਪੇਜ ਅੰਤਿਮ ਅੱਪਡੇਟ ਦੀ ਤਾਰੀਖ:


