 IST,
IST,
Drivers of CD Issuances: An Empirical Assessment
|
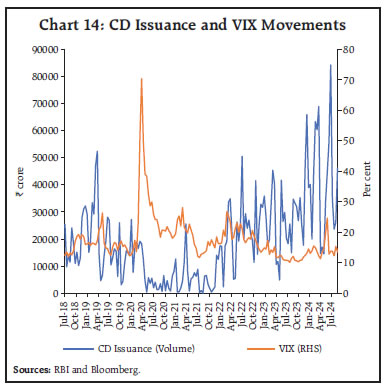
Anshul, Priyanka Priyadarshini and Dipak R. Chaudhari* In the recent period, banks have been relying more on certificates of deposit (CDs) issuances, with credit growth outpacing the deposits growth. The CDs have been majorly issued by public sector banks in the recent years while foreign banks have limited presence in the CD market. Post-covid, mutual funds have increasingly invested in CDs to further reinforce their dominant share, with a concomitant decline in other investors such as banks, financial institutions, and corporates. This article, using autoregressive distributed lag (ARDL) model, found that higher credit growth along with tight system liquidity encourages CD issuances, while increase in market volatility decreases CD issuances. Introduction In the financial system money market is the fulcrum of monetary policy operations conducted by the central bank. It provides equilibrium mechanism for short term demand and supply of funds and enables price discovery. Money market instruments like treasury bills and commercial papers enable the government and corporates, respectively, to meet their short-term funding requirements, while certificates of deposits (CDs) allow banks to access a cheaper source of funds than borrowing in the interbank market (Darpeix, 2022). CD is a negotiable, unsecured money market instrument issued by banks as a promissory note against funds deposited for a maturity period up to one year.1 CDs being bearer documents are readily negotiated and are attractive for both – the issuer banks and investors. Banks benefit from the specified maturity of deposit while investors are attracted to higher returns, short maturity and ready liquidity in the secondary market (Faniband, 2020). CDs act as an alternate source of short-term funding to complement other traditional funding sources for commercial banks, giving them liquidity and solvency support. Banks can use CDs to comply with their reserve management, especially during periods of liquidity tightness, such as the imposition of incremental cash reserve ratio (CRR) in 2023 (RBI, 2023). Furthermore, CDs are considered as safe instruments; as a result, the returns on CDs are less attractive vis-à-vis corporate bonds (Puri, 2012). As CDs have fixed tenor, banks can better manage their cash flows and plan for future banking activities. Banks find it attractive to raise funds through CDs at the beginning of interest rate upcycle, locking lower interest rates for CDs up to a year as well as meeting liquidity requirements. The CD issuances gained momentum in post-covid period with the hike in policy rates and shift in monetary policy stance at the time of robust credit growth (Chart 1). During Q4:2024-25, CD issuances had reached an all-time high of ₹3.70 lakh crore, in the backdrop of higher credit demand coupled with deficit liquidity2 and subdued deposits’ growth. Similarly, earlier in 2013, CD issuances had increased to a 15-year high on the back of higher credit growth3 while, deposit growth was lagging behind the credit growth. This raises an important question whether banks are substituting traditional deposits with CDs in the scenario of deposit growth trailing credit growth. If so, what could be the reasons as banks may sometimes have to pay higher interest rates for CD issuance than traditional deposits, which may be another policy question to address. 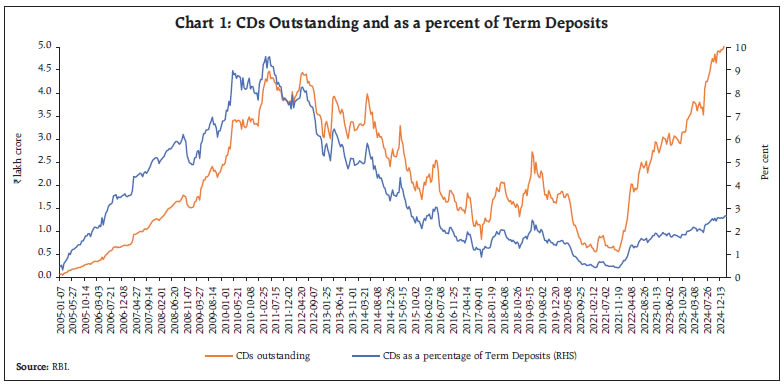 In terms of rates, CDs have to compete with other similar money market instruments such as commercial papers (CPs), treasury bills (T-bills), and non-convertible debentures (NCDs). Therefore, understanding their issuance, investor profile and the weighted average effective interest rate (WAEIR) helps in gauging the market microstructure of CDs coupled with available system liquidity and funding requirements of the banking system. Further, CD rates can provide insights into the future interest rate expectations by banks as well as the prevailing liquidity conditions. There is a dearth of studies on the dynamics of CD market both globally as well as in the Indian context. An initial study by Cohan (1973) on the determinants of CD market in the US shows that supply of CDs is the response to the anticipated strength of loan demand in the economy. During the global financial crisis (GFC), investors turned to CDs indicating that CDs are a safer investment option during crisis period (Aquilina et al., 2023). Prevailing liquidity conditions and investors’ appetite in the market were found to be the major factors impacting CD issuance in the European markets (Darpeix, 2022). Therefore, CD market could also provide a barometer of the credit demand-supply dynamics of the economy. Against this backdrop, the article examines market microstructure of CDs in India, including issuers profile and investor profile, and assesses the potential drivers of the CD issuances using transaction level data. The article is divided into six sections. Section II provides an overview of the CD market and cross-country experience. Section III analyses CD issuance, tenors and rates, investor profiles and credit ratings. Section IV discusses potential factors impacting CD issuance. Section V empirically examines determinants of CD issuance volume using the autoregressive distributed lag (ARDL) approach and market volatility (VIX), liquidity conditions, returns on equity, and banks credit to deposit ratio uses as explanatory variables. Section VI concludes the article with overall findings. II. CD Market: Some Preliminaries II.1 Cross-Country Experience The development of CDs began in the US by New York banks in mid-1960s as a result of rising credit demand and dampened deposit growth during the economic growth cycle (McKinney, 1967). In 1978, the US Federal Reserve introduced ‘money market certificate of deposit’ to prevent rising interest rates from adversely affecting the flow of savings into financial institutions (Winningham, 1979). This was closely associated with the US interest rate liberalisation process (Liu, 2018). In the US, CDs are considered as special type of deposit account with a bank or financial institution with tenor up to five years and can be bought through federally insured banks where the funds are insured up to USD 250,000.4 During the global financial crisis (GFC), many American investors turned to CDs as it is a safer investment in volatile market conditions.5 Globally, CDs are rarely traded in the secondary markets and investors tend to hold them till maturity (Aquilina et al., 2023). In the Euro area, banks account for around 70 per cent of outstanding CD issuance, with the French banks being most active. CDs are mainly issued in domestic currency; however, it can be issued in other currencies in the US and UK market. In contrast to the advanced countries, in China the CD market is nascent and grew after the Chinese central bank liberalised interest rates in 2015. Liu (2018) found that growth in the CD improved monetary policy transmission in China; however, it also resulted in maturity mismatch, increasing leverage and decline in credit ratings of banks, thereby increasing financial stability concerns. The cross-country experience shows that banks or deposit taking institutions are the major issuers of CDs while mutual funds, pension funds and insurance companies including cash rich non-financial corporations are the investors in CDs (FSB, 2024). Generally, issuance of CD is concomitant with the increase in policy rates, as banks scout for money market instruments during the policy tightening phase. Although CD markets function well in normal times, they are susceptible to illiquidity in times of stress. Generally, CDs are held till maturity given the short-term nature of these instruments, which results in very limited secondary market activity in normal times. Further, the primary issuance market, where most activity takes place, is intermediated by a small number of core dealers that typically act as a single point of market entry. The limited number of intermediaries means that they may not be able to respond to spikes in liquidity demand in times of stress (FSB, 2024). Unlike other money market instruments, there is no definitive source of data that compiles and reports global CD issuances. Countries have varying reporting requirements and methodologies for tracking CD market, which makes it difficult to get a concise idea about the CD market. A Report based on survey data, estimates global CD market size USD 1 trillion in 2023 and it is projected to reach USD 1.5 trillion in 2032.6 Another report projected to reach CD market to USD 2.3 trillion by 2033 from USD 1.5 trillion in 2024.7 Whatsoever the estimates are, it still reflects smaller share in the outstanding USD 128 trillion global debt market as on August 2020, estimated by international capital market association (ICMA). Lack of public data across CD markets presents a challenge when it comes to monitoring these markets, and thus may discourage broader investor participation (FSB, 2024). II.2 Indian Experience In India, although CDs are mentioned in the Reserve Bank of India Act 1934, due to the lack of an active secondary market, administered interest rates and possible danger of fictious transactions, CDs were not issued until 1989. The Vaghul Committee on money market reforms recommended issuances of CDs in 1987 (RBI, 1987). Major milestones in the development of CD market in India is given in Annex table A2. Since their inception, CDs are issued by banks for up to 1 year, while the non-bank financial institutions can issue CDs for a duration of 1 to 3 years. Details about the CD product, eligible issuers and investors along with regulatory requirement are given in Annex Table A1. Typically, CD issuances go up when there is a boom in credit demand with lower growth in bank deposits. During Covid, the CD market had become dormant due to limited requirement for funds by banks and surplus liquidity conditions. Recently, there has been an increase in CD issuances and the CD rates i.e., WAEIR. CD issuance, which was muted during the Covid period (April 2020-November 2021), jumped to ₹68,973 crore in the fortnight ending March 22, 2024, from a low of ₹386 crore on May 8, 2020 (Chart 2a). As Covid-related uncertainties waned, hike in policy rates and shift in monetary policy stance at the time of robust credit growth led to the rise in outstanding CDs. On the back of Reserve Bank’s introduction of 10 per cent incremental CRR (I-CRR) from May 19, 2023, to mop up the excess liquidity emanating from withdrawal of ₹2000 denominated currency, CD issuances increased. Further, quarter-end effects of advance tax payments and goods and services tax (GST) outflows, coupled with lesser government spending leading to liquidity tightening, result in higher CD issuance by banks. Along with these factors, slowdown in CASA deposit growth for banks as bank depositors shift to alternate assets, has resulted in increased reliance on CDs by banks.8 It is found that banking liquidity and CD issuance were negatively correlated (-0.62) during the study period. Therefore, CD issuances spike in March as Banks use CDs as a way to manage liquidity needs arising as a result of tight liquidity conditions during the year-end. Since April 2022, CD issuance has been increasing and reached ₹1.17 lakh crore in March 2025. Outstanding CD issuances increased to all time high of ₹11.75 lakh crore during 2024-25 (Chart 2a and b). Among the CD issuers, public sector banks (PSBs) and private sector banks (PVBs) are the dominant players, while CD issuance by foreign banks (FBs) and small finance banks (SFBs) is muted and intermittent. The share of PVBs has declined from 85 per cent in January 2022 to 30 per cent in December 2024, concomitantly the share of PSBs has increased from 6 per cent to 69 per cent during the period. This contrasts with the general belief that issuance of CDs is dominated by PVBs to complement their current and savings account (CASA) deposits (Chart 3). Though CDs can be issued for a period up to 365 days, the average tenor depends on the liquidity needs of banks and expectations of the future interest rates. During interest rate hike cycle, banks benefit by locking longer tenor CDs, while in easing cycle banks usually have no benefit in issuing longer tenor CDs unless there is high credit demand. The average tenor of CDs witnessed increasing trend from 95 days in June 2019 to 296 days in October 2021, which coincides around the start and peak of interest rate easing cycle; and thereafter, the average tenor has decreased to 128 days in May 2022 when Reserve Bank raised policy rate. In September 2024 the average tenor of CD issuances was lower at 146 days indicating that banks were raising CDs for short-term funding and expecting decline in interest rates (Chart 4a). 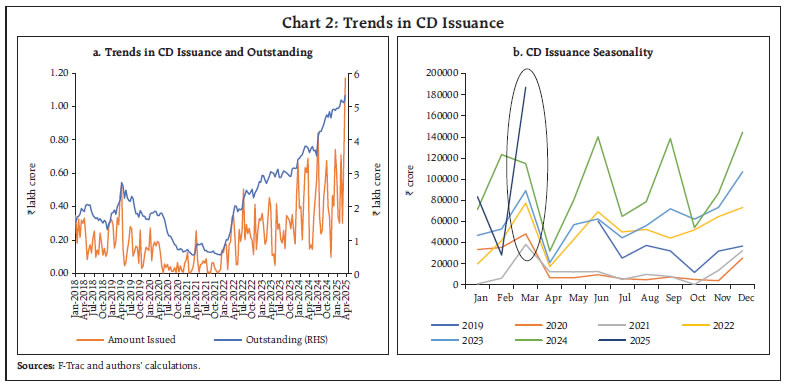 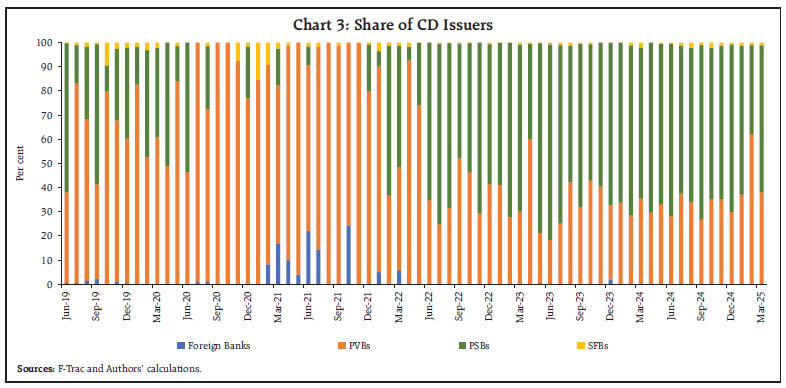 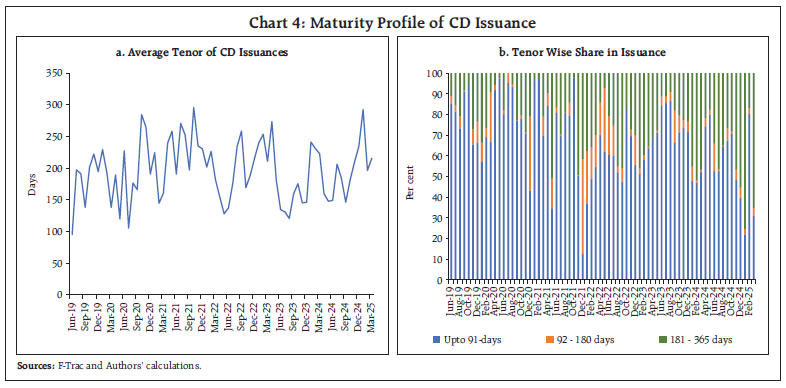 Amongst the various tenors, the share of CDs issued up to 91 days and between 180-365 days dominate the CD issuance, thus making CDs either an instrument of short-term liquidity management or an instrument to lock short-term rates for longer period (up to 1 year), which may be beneficial for banks during the interest rate upcycle. This is further corroborated by the fact that the share of CDs between 180-365 days has declined since April 2023, when RBI paused interest rate hikes. Since then, the share of CDs issued up to 91 days dominate the CDs issuance, indicating the use of CDs as instrument to meet short-term liquidity needs (Chart 4b). As CDs are unsecured debt instruments, the average tenor of the CD issuance and WAEIR provide insights into short-term funding dynamics among the four broad categories of commercial banks. The average tenor for PVBs is higher at 222 days, vis-à-vis both PSBs as well as SFBs at 155 and 215 days, respectively. Longer tenor of CDs issuance by PVBs imply that they raise funds to not just meet the short-term funding requirements but also for locking in lower interest rates. PSBs have an average tenor of 155 days, indicating use of CDs mostly as instruments for their short-term funding needs (Charts 5). The CD WAEIR increased steeply after February 2022 alongside increase in policy rate, signalling deficit liquidity conditions. A comparison of WAEIR of different categories of issuing banks shows that on an average, PSBs had lower WAEIR than others. However, this spread in the WAEIR among the banks narrowed since July 2022. For SFBs, the WAEIR is usually higher than others, reflecting higher risk premia (Chart 6). 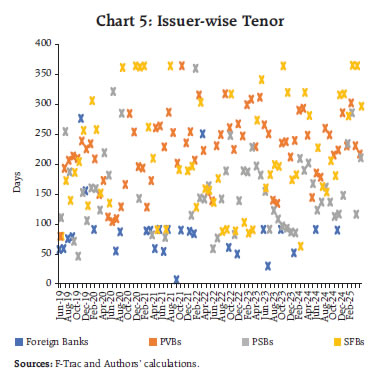 III.1 Who are the CD Investors? Globally, it has been found that money market mutual funds are the major investors in the CD market (Aquilina et al., 2023). In the Indian context also, mutual funds remain the dominant investors, with an average share of 85 per cent since November 2021. Among other investors, PVBs and PSBs have an average share of 11 and 6 per cent, respectively, while corporates have a marginal share (Chart 7). As debt mutual funds are mandated to invest in shorter duration instruments they are always on the lookout for investment opportunities in the CD market. Thus, an increase in assets under management (AUM) of debt MFs further might have boosted the MFs’ share in the total investment in CDs during the post-covid period. The AUM of debt MFs registered a compounded annual growth rate of 12.2 per cent from March 2022 to September 2022 (Gupta et al., 2022) [Chart 8]. 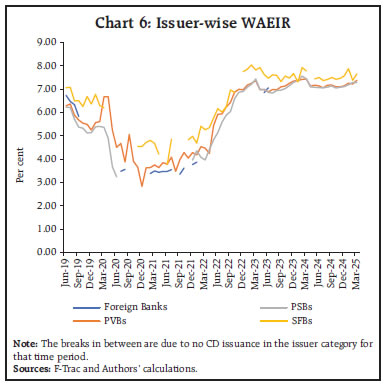 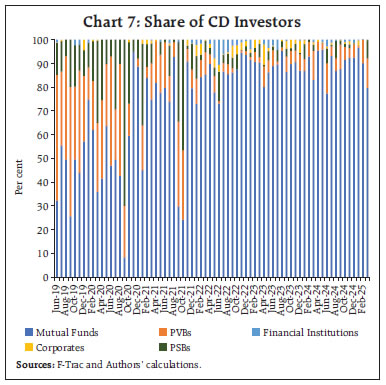 III.2 Credit Rating Across CD Issuance The credit risk of the underlying assets held by the issuing banks is reflected in its credit rating. If a bank is less creditworthy, it has to pay higher rate for CD issuance. This is in line with global experience (Johnson et al. 2008). However, CD market is considered to be less efficient and as CD rates are negotiated bilaterally, market stakeholders and bank specific characteristics can influence CD rates. Almost all the CD issuances are A1+ rated while among the rating agencies, CRISIL dominates with 55 per cent share (Chart 9). 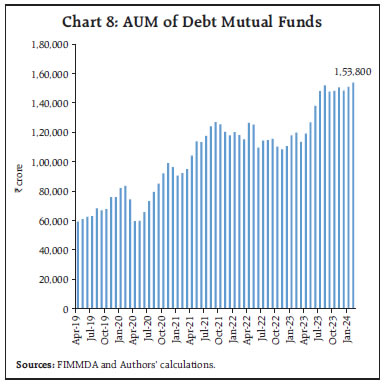 IV. CD Issuance in India: Trends and Correlates Allen (1971) observed that CD issuance is sensitive to interest rates of other money market instruments, thus CDs’ outstanding volume is dependent on the ability of CDs to compete with other money market instruments and banks’ funding requirements. A positive correlation between CD issuance and WAEIR with the weighted average call rate (WACR) is found in the Indian CD market. The WAEIR of CD issuance follows the path of policy rate cycle. For instance, it increased consistently between the fortnight ending May 6, 2022 to December 31, 2023, from 4.2 per cent to 7.5 per cent, in line with the increase in policy repo rate. The 3-month CDs traded marginally above the repo rate before the onset of COVID pandemic, however, it was below the repo rate during the surplus liquidity phase and mostly traded around the repo rate till the first hike on May 4, 2022; thereafter, remained above the repo rate, which points to tight liquidity conditions in accordance with RBI’s withdrawal of accommodation stance. Consequent to the rate hike, liquidity conditions tightened whereby liquidity absorption declined from average of ₹6.5 lakh crore in January 2022 to ₹4,547 crore in February 2023, further to an injection of ₹1.17 lakh crore in December 2023 (Chart 10). 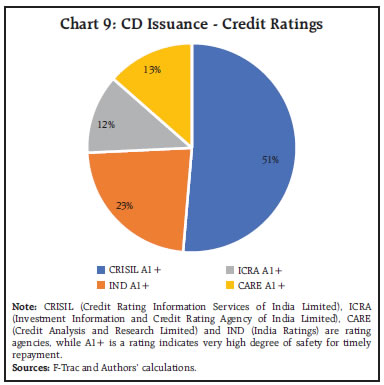 Macroeconomic shocks can affect banks’ risk premia on CDs i.e., spread between the WAEIR of CDs and the risk free rate (Kishan and Opiela, 2015) as it can be seen that during the US regional banking crisis in March 2023, The CD WAEIR spiked. In India, the spread between WAEIR of CDs and repo rate has decreased since the pause in policy rate hikes in April 2023. The narrowing of spread between CD issuances of various tenors implies that the compensation for term premia is declining in the CD market, following a pattern similar to the G-sec market. The spread of 3-month CDs over 3-month T-Bill has moved in sync with the liquidity conditions, remaining broadly range bound during the period. The spread was less than 40 basis points (bps) in December 2021 and increased thereafter to 100 bps around March 2023. The range between the minimum and maximum rate of CD issuance on fortnightly basis reflects the heterogeneity among the issuers as well as future interest rate expectations and liquidity needs of market participants (Chart 11). 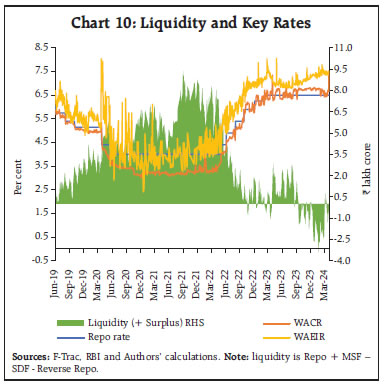 CDs can also act as a substitute to traditional deposits, especially during stressed liquidity conditions (Cohan, 1973). CDs and shorter tenor deposits are strong substitutes for one another and banks tend to prefer CDs over deposits as the latter are more sensitive to rates than the former (Humphrey 1979). A positive relationship between incremental credit deposit (ICD) ratio and CD issuances during the fortnight may exist as higher credit offtake compared to deposits could lead to higher issuance of CDs to meet the liquidity requirement of banks (Chart 12). Further, robust CD issuances during Q4:2023-24 may be due to sustained increase in credit growth along with trailed deposit growth because of moderate increase in deposits rates during the period. The weighted average term deposit rate (WATDR) of PSBs, PVBs and Foreign banks on outstanding deposits increased by 188 bps, 177 bps and 295 bps, respectively, during April 2022 to May 2024 (RBI, 2024) [Chart 13]. 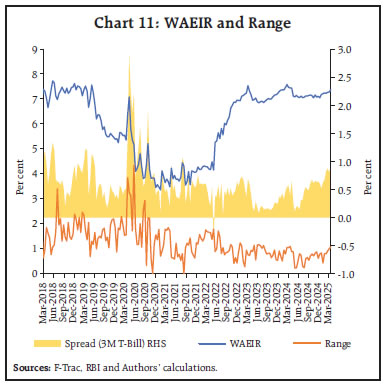 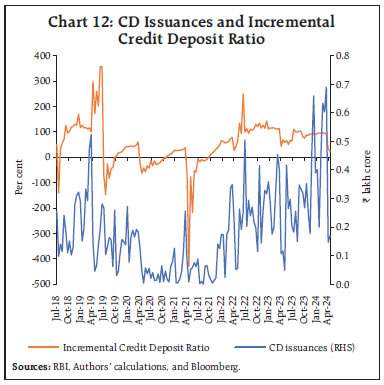 During highly uncertain market conditions, it is expected that CD issuance could be less due to muted credit demand by industry. This limits the need for banks to issue CDs. Further, during heightened volatility period, some investors may shift towards safer assets, such as T-bills. The India volatility index (VIX), being an indicator of uncertainty in the market, is a market fear gauge, and has negative correlation with CD issuance (Chart 14).  CD issuances tend to be influenced by a number of factors as discussed above (section IV). In order to further understand the contribution of various factors towards growth/decline in CD issuances over time, a regression model is estimated using fortnightly data (July 2018-November 2023). To understand the factors driving CD issuance, the following equation is estimated:  In the estimated model, dependent variable CDt depicts fortnightly CD issuances which is represented by the natural logarithm of seasonally adjusted CD issuances during a fortnight. ψ is the error correction term. The independent variable Xt includes market volatility index (VIX) which measures the uncertainty in the markets, Sensx_return as a proxy of equity returns, CD_RATE_CH as a measure of variation in CD rate (WAEIR), ICD_ratio for how much new deposits are being utilised for lending, LAF_CH as a measure of variation in liquidity over a fortnight and OIS_CH as a measure of variation in OIS rates. The variable description and descriptive statistics are presented in Annex Tables A3 and A5, respectively. CD rate change (CD_RATE_CH) indicates fortnightly variation in the rates (WAIER) at which CDs are issued. The relationship of WAIER with CD issuances depends on the RBI policy cycle, credit growth and availability of other short term deposit instruments among others. When CD issuance act as a substitute to the deposits (short term up to 1 year) especially when credit demand is soaring, and deposit growth is lagging behind an increase in CD rates (WAIER) should lead to a decline in CD issuances and vice versa. Incremental Credit Deposit ratio (ICD_ratio) indicates the fortnightly change in credit deposit ratio; therefore, a positive relationship may exist as higher credit offtake relative to deposits could lead to higher issuance of CDs to meet the increasing reserve requirements. The liquidity adjustment facility change (LAF_ CH) indicates the variation in banking liquidity during the fortnight vis-à-vis previous fortnight. While a positive value implies increase in surplus liquidity, a negative value indicates decline in system liquidity during the fortnight. A period of liquidity shortage encourages banks to explore alternative avenues to raise the funds. Thus, CD issuances tend to increase with the decline in liquidity and decrease with the increase in surplus liquidity. It is therefore expected that CD issuances, in the long run, are negatively related to system liquidity measure, LAF_CH variable in the model. A dummy for liquidity tightness has also been taken, where 1 indicates period when RBI pivoted monetary policy stance towards withdrawal of accommodation post pandemic, otherwise zero. Interest rate expectations impact money market instruments’ behaviour. For the CD issuance, increase in market expectation of interest rates could lead to increase in CD issuance and vice versa. The variable overnight indexed swap (OIS_CH), in our model, indicates the variation in OIS rates over a fortnight. While a positive value indicates increase in OIS rate, a negative value implies a decline in the rate over the fortnight. The increase in OIS rates reflects expectations of higher interest rates and lower credit growth, could lead to decline in CD issuances. In time series econometrics, divergence from mean over time implies non-stationarity and it is considered as a violation of assumption of the classical linear regression estimation as it may lead to misleading or spurious regression. The Augmented Dicky Fuller (ADF) tests for stationarity of selected variables depict a mix of I(0) and I(1). In order to measure the predictive power of the independent variables, a Granger causality test (Granger, 1969) is applied (Annex Table A4). The results reconfirm that liquidity and higher credit growth relative to deposits growth can predict the future volume of CD issuances (Annex Table A6). Further as the F-statistic establishes a single long run relationship, the ARDL technique is appropriate for estimation (Annex Table A7). The cointegration technique is a powerful way of detecting the presence of steady state equilibrium between non-stationary variables. As per Pesaran et al. (2001), the autoregressive distributed lag (ARDL) cointegration technique can be used in determining the long run relationship between series with different order of integration like, I(0) and I(1) but not I(2). The coefficient of error correction term (ECT) associated with the ARDL model reflects the speed of adjustment to long-run path following a short run deviation. If the F-statistics (Wald test) establishes that there is a single long run relationship and the sample data size is small (n≤ 30) or finite, the ARDL error correction representation becomes relatively more efficient. However, limitation of the ARDL approach is that when there are multiple long-run relationships, the model cannot be applied. As per the estimation results in the short run, CD issuances are negatively impacted by increase in surplus liquidity. On the other hand, withdrawal of accommodation (DUMMY) impacted CD issuances positively, which is indicative of the fact that CD issuances increased after the Reserve Bank shifted its monetary policy stance to withdrawal of accommodation. Among the variables that have long run impact over CD issuances include market volatility measure (VIX), incremental CD ratio, LAF variation over the fortnight and fortnightly variation in OIS rates (Table 1). The estimation results confirm that liquidity situation, interest rate expectation, and volatility (VIX) determine CD issuance in the long run. A positive ICD coefficient indicates increase in credit with lower deposits mobilisation prompts CD issuances. In the short run also, liquidity is found to be the major driver of CD issuances. The findings reconfirm that CD issuances are mainly driven by liquidity management and short-term funding requirements. CD is a money market instrument issued by banks to meet their short-term funding requirement. However, in the recent period it was in focus due to higher issuances accompanied by robust credit growth and a lagging deposit growth. It has been observed that during the covid induced liquidity surplus phase private banks were front runner in issuing the CDs; however, after February 2022 PSBs dominates the share in CD issuance. Foreign banks and relatively new SFBs have limited presence in the CD market. CD rates are relatively higher for SFBs while PSBs were able to raise CDs at relatively lower rates. Mutual funds continued to remain the major investor in CDs as higher retail participation in equity market led to higher asset allocation by mutual funds. The empirical results depict a positive impact of withdrawal of accommodation and incremental credit deposit ratio over the volume of CD issuances during the study period. This indicates banks’ inclination towards increased usage of CDs, amidst tightened liquidity conditions coupled with credit growth outpacing deposits growth. Although, CD market is largely a bilaterally negotiated market, CD issuances is found to be sensitive to current and expected rate of interest. Furthermore, during uncertainty banks tend to reduce CD issuances. References Allen, J. B. (1971). Factors Determining the Volume of Certificates of Deposits Outstanding: A Case Study of the Drain off in 1969. American Economist, 15(2), 32–37. Aquilina, M., Schrimpf, A., and Todorov, K. (2023). CP and CDs Markets: A Primer. BIS Quarterly Review, September 2023, 63–76. Cohan, B. S. (1973). The Determinants of Supply and Demand for Certificates of Deposit. Journal of Money, Credit and Banking, 5(1), 100–112. Darpeix, P.-E. (2022). The Market for Short-Term Debt Securities in Europe: What We Know and What We Do Not Know. SSRN Electronic Journal, 21. Faniband, M. (2020). The behaviour of trading volume: Evidence from money market instruments. Indian Journal of Finance. FSB. (2024). FSB examines vulnerabilities in short-term funding markets. https://www.fsb.org/2024/05/fsb-examines-vulnerabilities-in-short-term-funding-markets. Granger, C. W. J. (1969). Investigating Causal Relations by Econometric Models and Cross-spectral Methods. Econometrica. 37 (3): 424–438. Gupta, M., Kumar S., Seet, S., & Borad A. (2022). Market Returns and Flows to Debt Mutual Funds. RBI Bulletin, October. Humphrey, D. B. (1979). Large Bank Intra-Deposit Maturity Composition. Journal of Banking & Finance, 3(1), 43–66. Johnson, R. M., Lange, D. R., & Newman, J. A. (2008). The market for retail certificates of deposit: Explaining interest rates. Financial Services Review. Kishan, R. P., & Opiela, T. P. (2015). Macroeconomic Shocks and Discipline in the Market for Large Certificates of Deposit. Banks and Bank Systems, (10, Iss.4),8-14. Liu, K. (2018). Why Does the Negotiable Certificate of Deposit Matter for Chinese Banking? Economic Affairs. McKinney, G. W. (1967). New Sources of Bank Funds: Certificates of Deposit and Debt Securities. Law and Contemporary Problems, 32(1), 71. Pesaran, M. H., Y. Shin, and R. P. Smith (1999), “Pooled Mean Group Estimation of Dynamic Heterogeneous Panels”, Journal of the American Statistical Association, Vol. 94, No. 446, pp. 621-634. Puri, N. (2012). Role of Money Market in Context to Growth of Indian Economy. IRJC International Journal of Marketing, Financial Services & Management Research, 1(9), 3622. www.indianresearchjournals.com RBI. (1987). Report of the Working Group on the Money Market. https://rbi.org.in/documents/87730/39711208/CR637_19872e959bf4b54549d981c7ff70f0f5e7d8.pdf RBI. (2023). Reserve Bank of India Bulletin. September RBI. (2024). Monetary policy report, April. Winningham, S. (1979). The Effect of Money Market Certificates of Deposit on the Monetary Aggregates and Their Components. Economic Review, 20–31. Annex  * Anshul and Dipak R. Chaudhari are from Financial Markets Operations Department. Priyanka Priyadarshini is from Issue Department, Bengaluru RO. Authors are grateful to Shri G. Seshsayee, Vikram Rajput and Saurabh Gupta for their comments on the earlier version of the article. The authors would like to thank the anonymous reviewer and the editorial team for their helpful comments and feedback. The views expressed in this article are those of the authors and do not represent the views of the Reserve Bank of India. 1 CDs can also be issued by all India financial institutions (AIFIs) for 1 to 3 years, are not considered in the article. 2 Liquidity here is RBI’s net liquidity adjustment facility (LAF) position. If banks borrow more than lend back, it indicates liquidity deficit. 3 https://www.business-standard.com/article/finance/cd-issuances-hit-15-year-high-106031001082_1.html 4 https://www.investor.gov/introduction-investing/investing-basics/investment-products/certificates-deposit-cds 5 https://www.sec.gov/reportspubs/investor-publications/investorpubscertific 6 https://dataintelo.com/report/global-certificate-of-deposit-market 7 https://www.verifiedmarketreports.com/product/certificate-of-deposit-market 8 https://economictimes.indiatimes.com/industry/banking/finance/banking/more-savers-ditch-bank-deposits-to-flirt-with-equity/articleshow/107923540.cms |
Page Last Updated on:


