
Exogenous Shocks and India’s Growth Performance Post COVID-19 - RBI - Reserve Bank of India


Exogenous Shocks and India’s Growth Performance Post COVID-19
| by Amit Kumar^, Chaitali Bhowmick^, Kaustav K. Sarkar^, Kunal Priyadarshi^, Sapna Goel^ and Satyananda Sahoo^ This study attempts to discern broad trends and underlying nuances of the recovery path of the Indian economy in the aftermath of the COVID-19 pandemic. The Engel curve finds a shift of consumer preferences towards services and high-value products even before the pandemic. A significant positive relationship between growth of non-food credit and fixed investment confirms the supply-leading process of bank intermediation. Average rainfall deviation during El Niño years may adversely impact agricultural GVA growth in 2023-24. The adverse impact of energy price shock on manufacturing output has been dissipating. Private consumption and fixed investment remained resilient in Q1:2023-24, boding well for the economy going forward. Introduction The National Statistical Office (NSO) released its provisional estimates (PE) of national income for 2022-23 along with quarterly estimates of gross domestic product (GDP) on May 31, 2023.1 The National Accounts Statistics (NAS) 2023 comprising a detailed and disaggregated information on national income aggregates till 2021-22 was released earlier on April 27, 2023. This article analyses these new data releases against the backdrop of unfolding of three large exogenous shocks – the pandemic, the war in Ukraine and the synchronised global tightening of monetary policy – all in the span of three years.2 The first two factors led to supply chain disruptions, accentuation of commodity prices and intensification of inflationary pressures at a global level, prompting central banks to tighten monetary policy at the fastest pace in the last four decades. Historically, India has exhibited fortitude during periods of global slowdown and managed to maintain a relatively steady GDP growth rate. During the global financial crisis (GFC) of 2008-09, while many countries experienced recession, India managed to record a growth of 3.1 per cent (Annex Table 1 and Annex Table 2). India’s perseverance during this challenging period can be attributed to prudent fiscal and monetary management and buoyancy in domestic demand, especially private consumption. The atypical nature of COVID-19, however, resulted in a protracted revival of private consumption as a full-fledged normalisation of activity and restoration of consumer confidence took place only after the receding of the Omicron wave in early 2022. The government’s commitment to upscale infrastructure development facilitated an impressive rebound of gross capital formation (GCF). Following COVID-19, the Indian economy registered a ‘V-shaped’ recovery on the back of a series of recent reforms, and pertinent policy support from the Government of India (GoI) and the Reserve Bank. As the Indian economy aspires to become a developed economy going forward,3 a holistic appraisal of the current macroeconomy is warranted to identify the bright spots and the weak points. 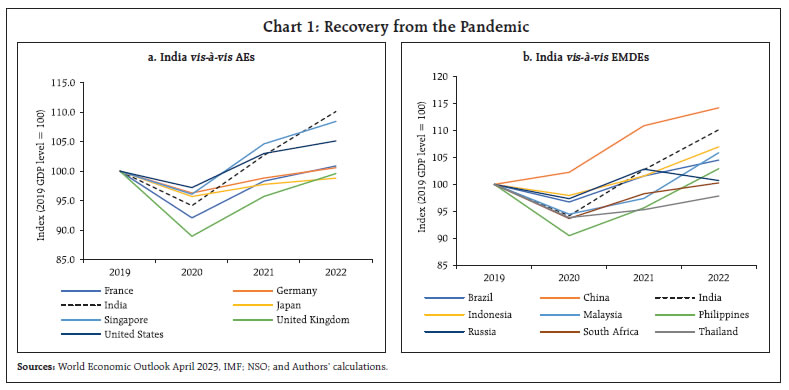
Against this backdrop, this article attempts to discern the broad trends and underlying nuances of the recovery path of the Indian economy in the aftermath of the pandemic. The macro-level assessment has been supplemented by granular level analyses, using household survey, industry-wise data and high frequency indicators (HFIs) for drawing deeper insights. The remainder of the article is organised along the following lines. Section II presents broad trends of the Indian economy. It is followed by an assessment of drivers of aggregate demand in Section III and that of supply-side constituents in Section IV. An assessment of Q1:2023-24 using HFIs of economic activity is presented in Section V. Section VI offers concluding observations. In the years following the COVID-19 outbreak, India emerged as one of the fastest growing major economies in the world. With PE for 2022-23 placing real GDP growth at 7.2 per cent, GDP in level terms stood at 10.1 per cent above the pre-pandemic level of 2019-20. When compared with the group of advanced economies (AEs) and emerging and developing market economies (EMDEs), vis-à-vis their respective GDP levels of 2019, India staged the fastest turnaround in GDP, next only to China (Chart 1a and 1b). The Indian economy proved to be more resilient to the pandemic aberrations than perceived initially based on the available coincident indicators. This is evident in the sharp upward revision in GDP figures for both 2020-21 and 2021-22 in their revised estimates compiled using firmer data with detailed coverage (Chart 2). Buoyant domestic demand consolidated India’s GDP growth in 2022-23 amidst a slowing global economy and heightened geopolitical tensions. The recovery was anchored by an impressive turnaround in private final consumption expenditure (PFCE), more pronounced in first half of the year, aided by a revival in contact-intensive services and release of pent-up demand. It, however, lost steam in the second half of 2022-23, partly on account of accentuated inflationary pressures squeezing disposable income of households. Gross fixed capital formation (GFCF) surged on the back of government’s thrust to infrastructure development (Chart 3). Government final consumption expenditure (GFCE), on the other hand, remained muted as the government continued on a path of consolidation while scaling up its capital expenditure. 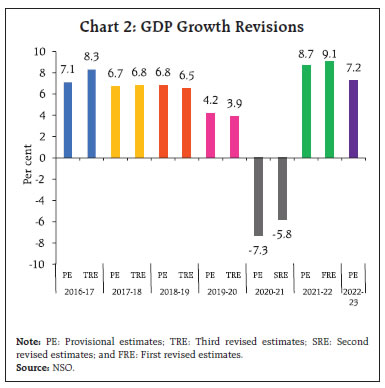
Gross value added (GVA) at basic prices expanded by 7.0 per cent in 2022-23, driven by resilience in agriculture and allied activity and recovery in the services sector, while growth in the industrial sector remained tepid (Chart 4). 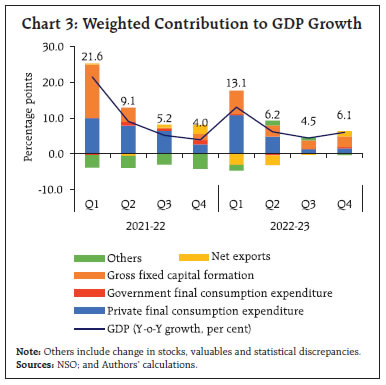
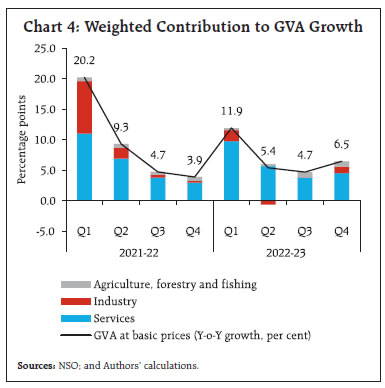
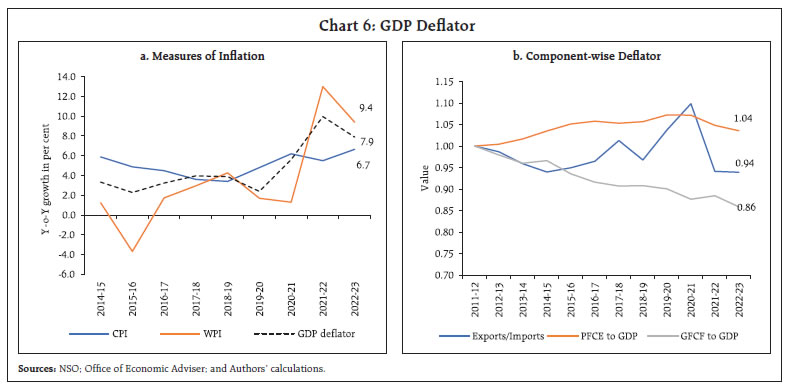
Regarding quarterly trajectory, an acceleration in GDP growth to 6.1 per cent in Q4:2022-23 from 4.5 per cent in the preceding quarter provided a major boost to overall growth. While PFCE remained subdued, GFCE picked up and fixed investment remained strong in Q4:2022-23. Net exports contributed positively to GDP growth in Q4 as exports, primarily services, remained robust whereas imports moderated sharply (Table 1). Real GVA growth accelerated to 6.5 per cent in Q4:2022-23. Disaggregated data suggest a healthy growth momentum across most sectors. The agricultural sector grew at a robust 5.5 per cent in Q4:2022-23 owing to impressive production of wheat, rice and coarse cereals as per the third advance estimates of crop production for 2022-23. Manufacturing GVA rebounded in Q4:2022-23 after two consecutive quarters of contraction, as easing of input costs facilitated an improvement in profit margin of listed manufacturing companies. Within the services sector, a broad-based resurgence was recorded in construction, financial, real estate and professional services, and public administration, defence and other services (PADO) in Q4:2022-23 as compared with Q3:2022-23 (Table 2). Following a moderation in Q3:2022-23, the seasonally adjusted annualised rate (SAAR) of real GDP and GVA at basic prices at 5.5 per cent and 8.1 per cent, respectively, for Q4:2022-23, exhibited an upsurge in momentum (Charts 5a and 5b). GDP deflator inflation – a measure of implied inflation – touched its highest level in 2021-22 since 2011-12 and remained elevated in 2022-23. Since GDP deflator is based on a combination of the wholesale price index (WPI) and the consumer price index (CPI) for respective sectors, GDP deflator inflation tends to lie between the two. It, however, depicts a higher correlation with WPI inflation (0.90) than CPI inflation (0.49), primarily due to higher weight of the former. Among the components, while the ratio of PFCE deflator to GDP deflator displayed an upward trend except for the pandemic years (2020-2022), that of GFCF deflator to GDP deflator has declined steadily, reflecting a rise in relative price of consumer goods vis-à-vis investment goods. The ratio of exports deflator to imports deflator, a metric of terms of trade pertaining to the external sector, declined in early 2010s but increased in the subsequent years and turned volatile (Chart 6). 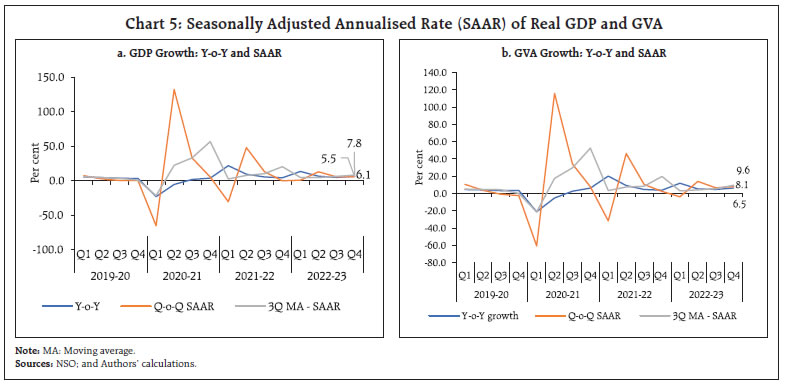
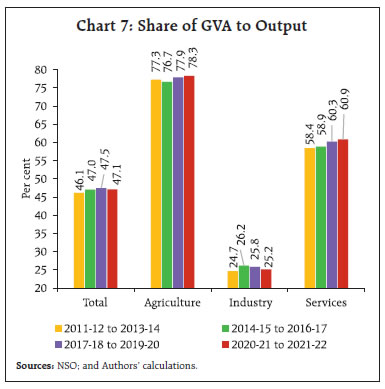
In the last decade, efficiency gains at the aggregate level have been underway in the Indian economy as corroborated by the share of GVA to gross value of output (GVO)4. The ratio of GVA to GVO has improved over time, albeit variations among sectors, signifying an improvement in efficiency of the value chain. The ratio is the highest for agriculture, forestry and fishing, and has been growing over time. On the other hand, the ratio is lower in industrial activity signifying that the sector creates substantial backward linkages by creating demand for the output of other sectors (Chart 7). Secondly, the incremental capital output ratio (ICOR) for India declined till 2016-17 reflecting growing efficiency in the process of capital accumulation. The ratio was, however, on an upward trend prior to the pandemic, before improving in 2021-23 (Chart 8). In a nutshell, the Indian economy gained traction, shrugging off the debilitating impact of the pandemic. Growth impulses remained tenacious amidst global headwinds. The innate strength of the macroeconomic fundamentals and efficiency gains helped India to stay ahead of its peers in the recovery process. 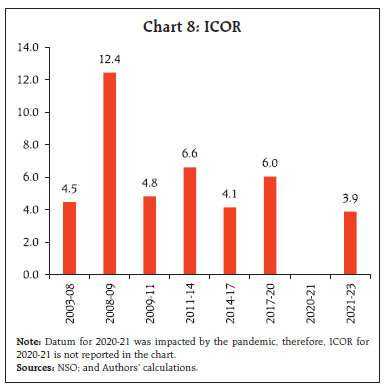
III. Drivers of Aggregate Demand Private consumption and fixed investment account for roughly 90 per cent of the aggregate demand. While private consumption is a relatively stable component, investment is highly cyclical in nature. While fixed investment staged a V-shaped recovery and rose by 18.3 per cent above its pre-pandemic level in 2022-23, private consumption rebounded in a staggered manner, with a delayed catch up of contact-intensive services and discretionary spending. With growth in private consumption slackening to a modest 2.5 per cent in H2:2022-23, recent debate centres around whether or how quickly there will be a turnaround in private consumption demand. In view of the above, this section takes a deep dive into various aspects of these two components of aggregate demand. Private Consumption Following the pandemic, PFCE resuscitated to a growth of 7.5 per cent in 2022-23, expanding its share in GDP to 58.5 per cent – the highest since 2011-12. An item-wise analysis of consumption expenditure in terms of compound annual growth rate (CAGR) in pre and post COVID times suggests that the brunt of the pandemic was divergent across sub-sectors (Chart 9). During the pandemic, consumption of necessary items like food and beverages remained intact; expenditure on clothing and footwear, health and education moderated to a limited extent, while consumption of services such as transport, communication, hotel and restaurants was the worst affected. 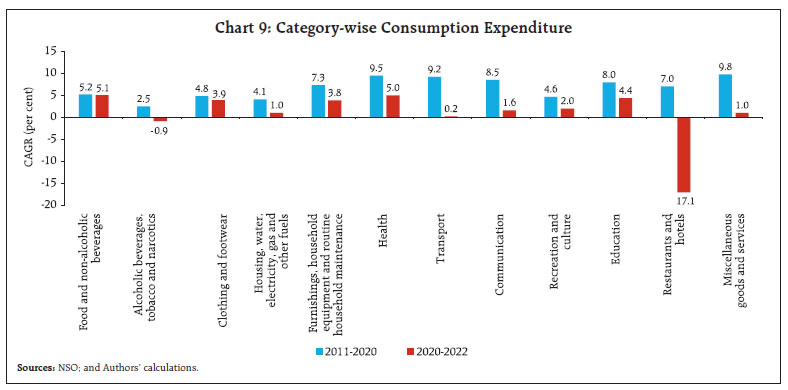
Furthermore, over the last two decades, there has been a structural shift in consumers’ preference from consumption of necessary and subsistence items to high-valued durable goods and services consumption. Barring the pandemic years, the share and contribution of services consumption has been steadily increasing, primarily at the cost of non-durables and semi-durable goods, while consumption of durables is also gaining share (Chart 10). 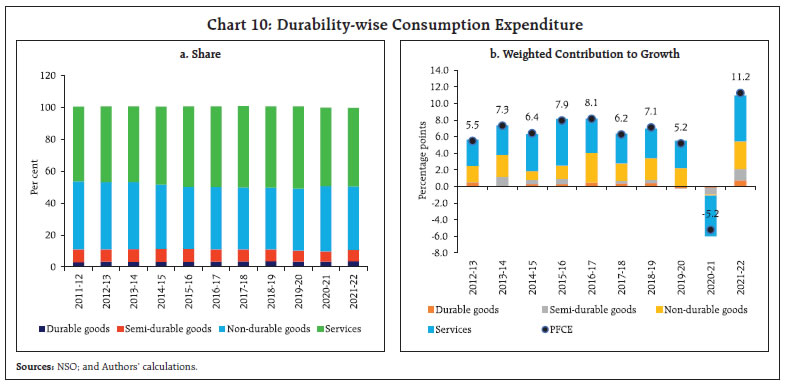
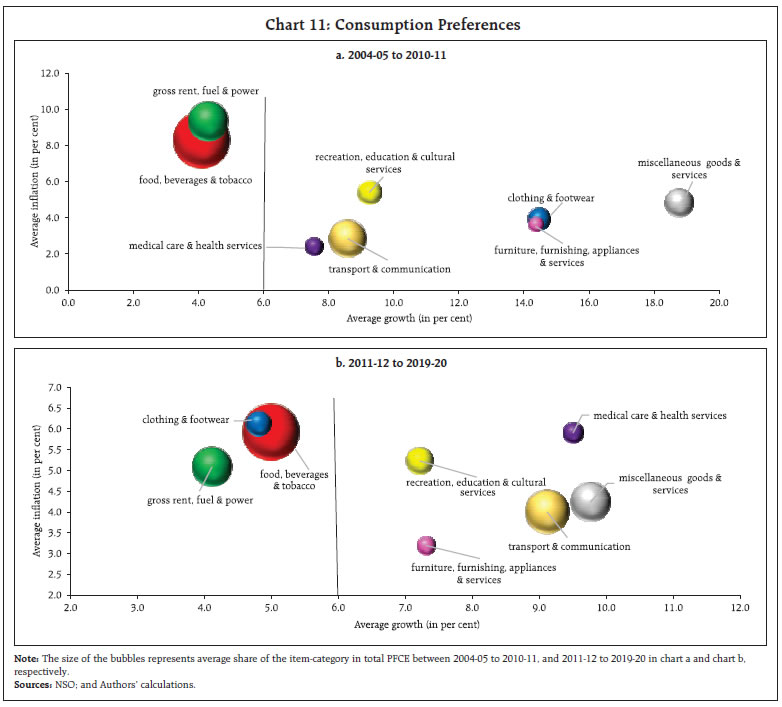
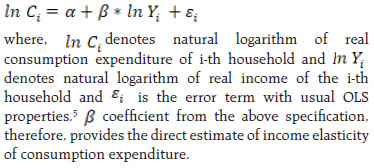
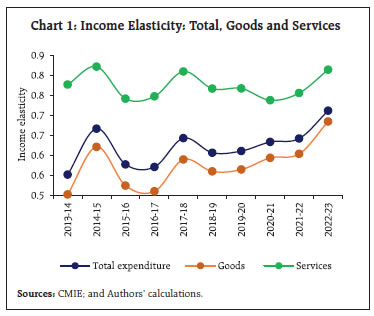
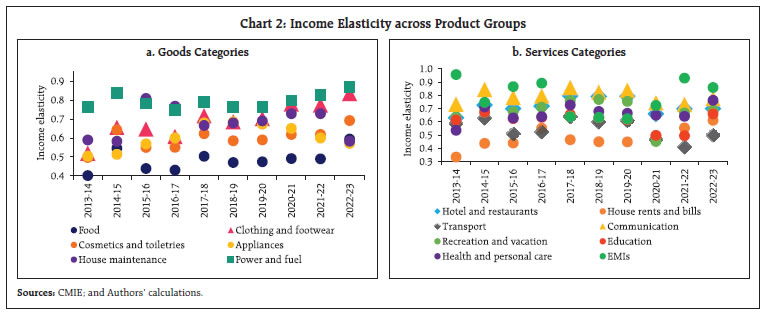
A comparison of PFCE for the two-time periods 2004-05 to 2010-11 and 2011-12 to 2019-20 endorse the shift in consumers’ preferences towards services in the later period (Chart 11). In categories like food, beverages, and tobacco; gross rent, fuel, and power, consumption growth remained subdued notwithstanding moderation in inflation in the later period. Expenditure on clothing and footwear moderated sharply in the later period as average inflation had surged. In contrast, average growth in health expenditure accelerated despite higher inflation during the same period (2011-20). Overall, consumption growth has moderated across all categories of services in the later period, but higher growth in services relative to goods led to increased share of services in total consumption. A commodity level analysis of Engel curve relationship in the Indian context based on survey-based household-level data also portrays that the income elasticity of various consumption items remained higher for services related items (Box 1).
Gross Fixed Capital Formation GFCF, contributing around 34 per cent to GDP – accelerated by 11.4 per cent in 2022-23. Strong performance of capital goods and infrastructure segments, as indicated by the index of industrial production (IIP), provided impetus to growth. Sector-wise, investment in dwellings, other buildings and structures comprise majority of fixed investment by the government and household sectors, while machinery and equipment and intellectual property products have a large and growing share of private non-financial corporations in GFCF (Chart 12). 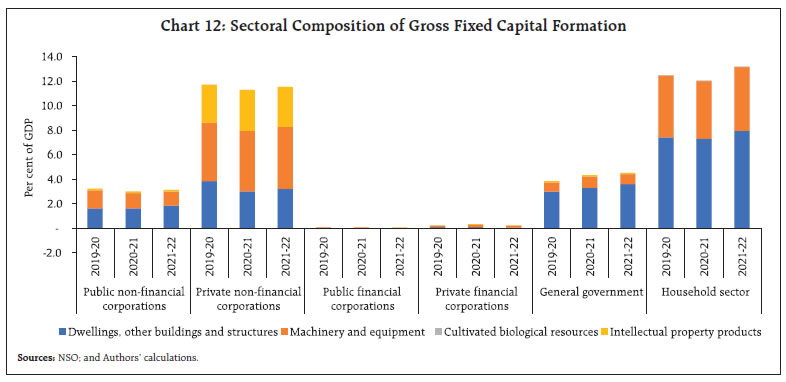
The revival in fixed investment assumes paramount importance to sustain high growth trajectory in the medium-term as it increases the productive capacity of the economy. India’s high-growth phase of 2003-04 to 2007-08 at an average growth of 7.9 per cent was largely led by investment. Investment activity moderated between 2012-13 and 2020-21 owing to a confluence of factors, viz., weakening of balance sheets of the financial institutions, overleveraged corporate sector and trade related uncertainties. Since 2021-22, however, fixed investment has exhibited revival led by GoI’s thrust on infrastructure. In 2022-23, real estate activity exhibited exuberance leading to the highest ever launches and sales of residential units recorded in Q4:2022-23.6 Consequently, the share of real GFCF in overall GDP surged to 35.3 per cent of GDP in Q4:2022-23 from 24.6 per cent in Q1:2020-21. New launches and sales of residential units, however, have slowed in Q1:2023:24, with inventory overhang inching up. To explore the various determinants of fixed investment in the Indian economy, an equation for real investment has been estimated using OLS method with due care for stationarity properties. The factors that impact the investment climate include real GDP growth rate, weighted average call money rate (WACMR)7 adjusted for GDP deflator inflation, India policy uncertainty index (Chart 13) and growth of non-food credit adjusted for GDP deflator inflation (Table 3). Quarterly data from Q1:2004-05 to Q4:2019-20 have been used, thereby excluding the COVID-19 period from the estimation. Regression results suggest that higher growth of aggregate demand has a positive impact on investments, though the coefficient is statistically insignificant. The real WACMR, a proxy for borrowing costs in the economy, has a negative impact on investment activity. Furthermore, uncertainty increases the systematic risk, and thereby the cost of capital in the economy, which results in reduced investment (GoI, 2019). Higher uncertainty dampens animal spirits, which impedes investment. A significant relationship between growth of non-food credit and fixed investment confirms the supply-leading process of bank intermediation. Finally, significant GFC period dummy confirms its debilitating impact on the economy. With the lagged dependent variable being statistically significant and positive, it reflects the persistence in the progress of investment activity. It is evident that results are consistent with empirical literature (RBI, 2018; Raj et al., 2018; and Shukla and Shaw, 2021). 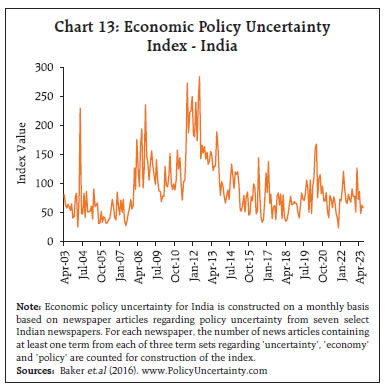
Subramanian and Felman (2019) had discussed about the interest-growth pincer which had pushed the economy into a downward spiral. In the current scenario, these dynamics have turned favourable for India’s growth. In Q4:2022-23, while nominal GDP growth stood at 10.4 per cent, weighted average lending rate for outstanding loans by scheduled commercial banks – proxy for cost of borrowing of the private sector – stood at 9.7 per cent, thereby implying that with (i-g) in negative territory, leverage of the corporate sector is insouciant (Chart 14). On a similar note, average 10-year G-sec yield remained flat at 7.4 per cent – 3.0 percentage points lower than the nominal growth, reflecting sustainability of government debt dynamics. With regard to availability of resources, financial saving of the household sector in 2022-23 has tapered as credit inched up. On the other hand, flows from the external sector increased with the current account deficit (CAD) at 2.0 per cent of GDP during 2022-23 as compared with 1.2 per cent during the preceding year. Furthermore, with deficit of the central government moderating, the availability of resources has not been a concern for the private corporate sector in 2022-23. From the supply side, economic activity in the non-agriculture sector suffered the brunt of pandemic while agriculture sector, which was exempted from lockdown, cushioned overall GVA. The economy was subject to a cyclical downturn even before COVID-19, induced by slowdown in mining and manufacturing. Industrial GVA growth decelerated to 0.7 per cent on average during 2017-18 to 2019-20. Amidst an industrial slowdown from 2017-18 onwards, the Indian economy was bolstered by steady growth in the services sector. Following two back to back drought years in 2014-15 and 2015-16, agriculture recovered showcasing resillience with an average growth of 4.7 per cent between 2016-17 to 2022-23. 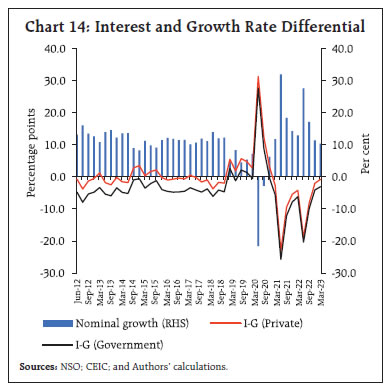
During 2023-24, the agriculture sector may be riddled with weather-related uncertainities. The south-west monsoon (SWM) – rainfall between the months of June to September – is a principal determinant of kharif crop in India and also impacts rabi crop indirectly through soil-moisture and reservoir levels. There is a forecast of normal SWM for 2023 by the India Meteorological Department (IMD). The actual performance of the SWM rainfall would depend on the interplay of an El Niño event and the counterbalancing effects of events such as a positive Indian Ocean Dipole. Average rainfall during El Niño years tends to be below normal which can have some adverse impact on the agricultural GVA growth (Chart 15). Up to August 9, 2023, the cumulative seasonal rainfall reached at the same level as the long period average (LPA) owing to a sharp catchup in July. East and north-east India, however, is facing deficient rainfall, which could impede kharif sowing. As on August 4, 2023, total kharif sowing stood at 0.4 per cent higher than the last year on account of higher sowing in rice, oilseeds, sugarcane and coarse cereals. Although the contribution of agriculture to overall GVA has reduced to less than one-fifth, it still provides livelihood for a majority of the population, and therefore, strongly influences aggregate demand. The Kernel density estimates of growth in PFCE exhibit higher mean PFCE growth during normal monsoon years compared to that during the deficit monsoon years (Chart 16). 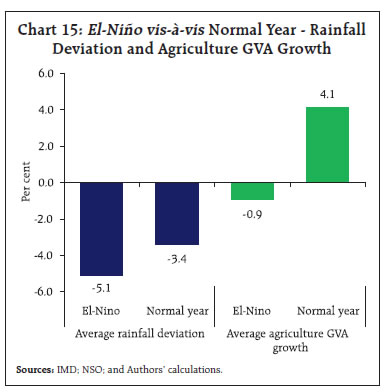
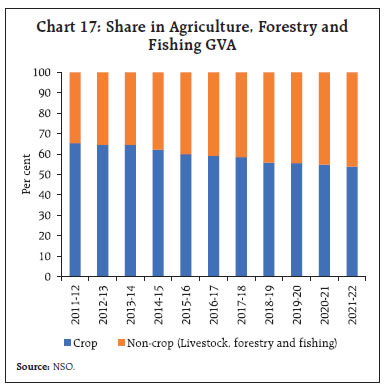
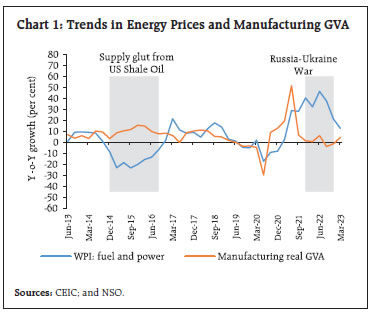
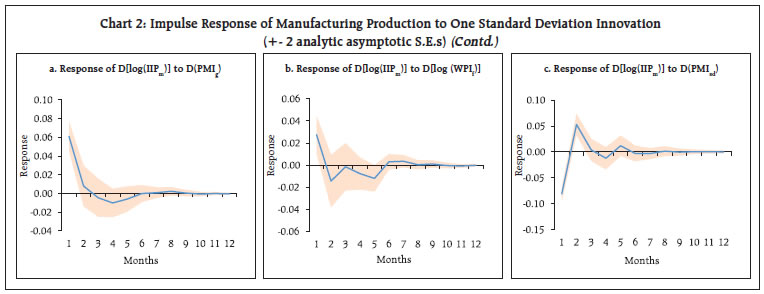
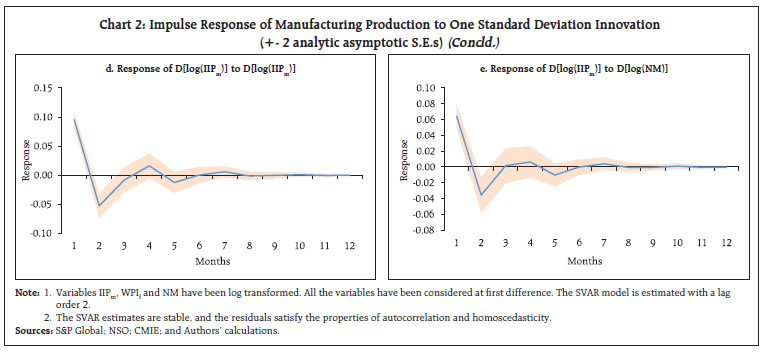
Notwithstanding the monsoon precariousness, prospects of the agriculture sector are expected to remain bright in 2023. The growing share of non-crop allied activity, which is less impacted by rainfall, imparts resilience to overall agriculture output (Chart 17). Second, yield losses appear to have declined, in absolute as well as relative terms, under both moderate and severe drought conditions (Birthal et al., 2015). The industrial sector recorded the fastest turnaround from COVID-19 with its weighted contribution in overall GVA growth in 2021-22 being the highest since 2015-16. A deleveraged corporate sector balance sheet, benefit from corporate tax cut (RBI, 2022) just before the pandemic and government’s thrust to capital expenditure spearheaded manufacturing sector to register a robust post-COVID recovery. An upsurge in input cost pressures following the Russia-Ukraine war and synchronised tightening of monetary policy, however, impinged on corporate profitability and output during Q3:2022-23 (Box 2), which improved in the subsequent quarters. 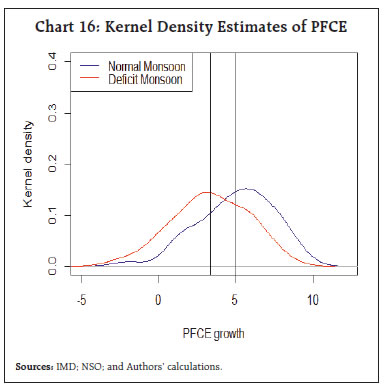
A steady improvement in capacity utilisation surpassing its long-run average as per the last few rounds of Reserve Bank’s Order Book, Investment and Capacity Utilisation Survey (OBICUS) of the manufacturing sector present green shoots of revival in private sector capex cycle (RBI, 2023). According to the 102nd round of the quarterly Industrial Outlook Survey (IOS), manufacturing firms exude positive sentiments on production, order books, employment conditions and capacity utilisation for the second half of the financial year with some easing in input cost pressures. One of the distinctive features of India’s growth trajectory has been that the services sector has remained the prime mover of the economy over the last three decades (RBI, 2020). The services sector plummeted during the pandemic as lockdowns restricted mobility and dented confidence and income of consumers. In 2022-23, the services sector convalesced from the enervating impact of the pandemic, recording a growth of 9.5 per cent and contributing five-sixth to overall growth. Going forward, the continued buoyancy in the services sector is expected to drive growth. Firms in the services sector exuded optimism in the 37th round of the Reserve Bank’s Services and Infrastructure Outlook Survey (SIOS), with demand for services projected to grow sequentially throughout 2023-24. For Q1:2023-24, firms in the infrastructure sector expect job landscape to improve further albeit marginal waning of optimism in overall business situation. For the three subsequent quarters, i.e., Q2:2023-24, Q3:2023-24 and Q4:2023-24, overall business situation, turnover and employment conditions are anticipated to improve. 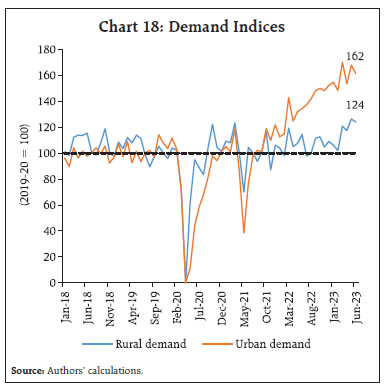
Beyond the official release, the trajectory of economic activity for Q1:2023-24 is captured in terms of various HFIs. The monthly activity indices for both urban10 and rural11 demand, constructed using principal component analysis (PCA), showed that urban demand continues to move on an upward trajectory despite oscillations in recent months. Rural demand, after staying subdued throughout 2022, has reflected a sustained uptick during March-June 2023 (Chart 18). Along with resilient urban demand, sustained momentum in rural consumption is essential to provide a major thrust to aggregate demand going forward. In the July 2023 round of Consumer Confidence Survey (CCS), while consumer confidence stood marginally lower than the previous round, sentiments on current income improved and moved to optimistic zone for the first time in four years. 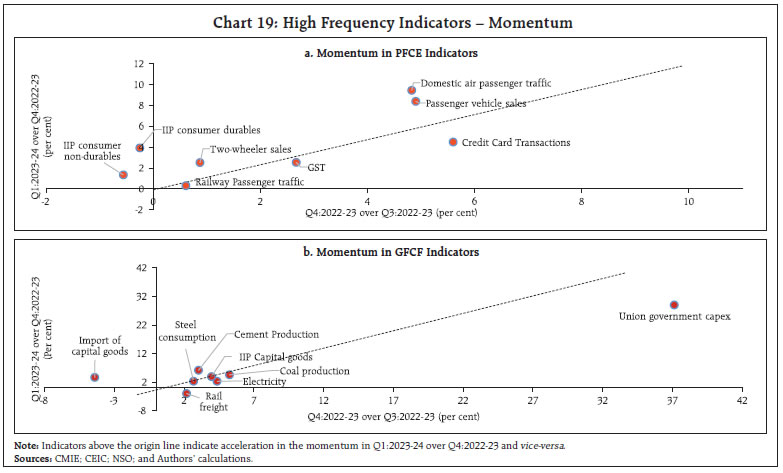
Momentum measured in terms of seasonally adjusted q-o-q growth in HFIs pertaining to private consumption and fixed investment remained resilient in Q1:2023-24. PFCE appeared to have gathered traction in Q1:2023-24 from the preceding quarter, with traction from passenger vehicle sales, consumer durables and non-durables, two-wheeler sales and domestic air passenger traffic (Chart 19a). With regard to HFIs pertaining to fixed investment, momentum tapered slightly in Q1 in case of rail freight and electricity production (Chart 19b). In contrast, cement production recorded an acceleration while coal production and steel consumption remained robust in Q1:2023-24 vis-à-vis the previous quarter. Central government capex sustained its spectacular growth in Q1:2023-24. Import of capital goods recorded a robust recovery in Q1:2023-24 from a contraction in momentum in the preceding quarter. In the light of recent data releases of national accounts, this study presents an appraisal of India’s growth dynamics. India emerged as one of the fastest growing major economies in the post pandemic world on the back of resilience in domestic demand, supported by proactive and coordinated response of fiscal and monetary policies that nurtured a quick recovery. A swathe of structural reforms undertaken related to banking, digitalisation, taxation, manufacturing and labour, have laid the foundation for strong and sustainable growth over the medium and long term.12 The revival in contact-intensive activity anchored an impressive revival in private consumption in 2022-23, while turnaround in GFCF took place from 2021-22 and remained robust throughout 2022-23. A compositional shift in private consumption has been underway in the Indian economy much before the pandemic as reflected in a sustained increase in the share of services over goods in total consumption. The empirical exercise on determinants of fixed investment in India infers that higher growth in GDP and real non-food credit have a positive and significant impact on investment activity, while economic policy uncertainty adversely impacts investment. The year 2022-23 ended with a broad-based acceleration in momentum in economic activity across sectors. The agriculture sector is expected to remain resilient amidst monsoon related uncertainties, cushioned by buoyant allied sector activity and improved drought resilience of crops. The adverse impact of energy price shock on manufacturing output has been dissipating. The buoyancy in the services sector activity is expected to sustain going forward. Moreover, with regard to some important catalysts for India’s growth going forward, “the demographic dividend in India that set in from 2018 is regarded as an asset and an opportunity in a world where many countries are confronting ageing and declining populations. The upgradation of physical infrastructure and the digital payments revolution provide tailwinds to India’s growth prospects”.13 References: Baker, S.R., Bloom, N., and Davis, S. J. (2016). Measuring Economic Policy Uncertainty. Quarterly Journal of Economics, 131, No. 4 (November), 1593-1636. Birthal, P. S., Negi, D. S., Khan, M. T., and Agarwal, S. (2015). Is Indian agriculture becoming resilient to droughts? Evidence from rice production systems. Food Policy, 56, 1–12. Chiacchio, F., De Santis, R. A., Gunnella V., and Lebastard, L. (2023). ‘How have higher energy prices affected industrial production and imports?’ ECB Economic Bulletin Issue 1/2023, European Central Bank. https://www.ecb.europa.eu/pub/economic-bulletin/focus/2023/html/ecb.ebbox202301_02~8d6f1214ae.en.html. Ebru, Ç., and Melek, A. (2012). An Econometric Analysis of Engel’s Curve: Household Food and Clothing Consumption in Turkey. Scientific Annals of Economics and Business Vol. 59, No. 1, pp. 313-319. doi: 10.2478/v10316-012-0021-x. GoI. (2019). How does Policy Uncertainty affect Investment?, Economic Survey 2018-19, Volume 1, Chapter 6. International Monetary Fund. (2023). World Economic Outlook: A Rocky Recovery. Washington DC. April. Ministry of Statistics & Programme Implementation (MOSPI). (2023). Provisional Estimates of National Income 2022-23 and Quarterly Estimates of Gross Domestic Product for the Fourth Quarter (Q4) OF 2022-23. https://mospi.gov.in/sites/default/files/press_release/PressNoteQ4_FY2022-23_31may23.pdf. Raj, J., Sahoo, S., and Shankar, S. (2018). India’s Investment Cycle: An Empirical Investigation. RBI Working Paper Series No. 05. Reserve Bank of India (RBI). (2018). Annual Report 2017-18. /en/web/rbi/publications/reports/annual_report. Reserve Bank of India (RBI). (2020). Annual Report 2019-20. Reserve Bank of India (RBI). (2022). Annual Report 2021-22. Reserve Bank of India (RBI). (2023). Annual Report 2022-23. Shukla, A. K., and Shaw, T. S. (2021). Impact of Leverage on Firms’ Investment: Decoding the Indian Experience. Economic and Political Weekly, Volume 56, No. 35, pp. 44-53. Subramanian, A., and Felman, J. (2019). India’s Great Slowdown: What Happened? What’s the Way Out? Centre for International Development Faculty Working Paper No. 370 ^ The authors are from Department of Economic and Policy Research. The authors express their gratitude to Smt. Rekha Misra for the insightful comments. The authors are extremely grateful to the Editorial Board of the RBI Bulletin for their insightful comments and suggestions. The views expressed in this article are those of the authors and do not represent the views of the Reserve Bank of India. 1 Provisional Estimates of National Income 2022-23 and Quarterly Estimates of Gross Domestic Product for the Fourth Quarter (Q4) of 2022-23, May 31, 2023, National Statistical Office, Government of India. 2 ‘Central Banking in Uncertain Times: The Indian Experience’, Opening Plenary Address delivered by Shri Shaktikanta Das at the Summer Meetings organised by Central Banking, London, June 13, 2023. 3 Address by Hon’ble Prime Minister Shri Narendra Modi on 76th Independence Day on August 15, 2022. https://pib.gov.in/PressReleasePage.aspx?PRID=1852024 4 GVO is the sum of GVA and intermediate consumption. 5 CMIE Household Pyramid data reports consumption expenditure and income data in nominal terms which are deflated using item-wise PFCE deflator and GDP deflator, respectively, from the NAS. Wherever the mapping of consumption categories is not possible, deflators for either overall goods category or services category have been applied for arriving estimates in real terms. 7 WACMR – which represents the unsecured segment of the overnight money market– is the operating target of monetary policy in India. 8 The nominal non-oil imports have been deflated using WPI (excluding crude, petroleum and natural gas and fuel and power). 9 Inverted PMIsd is taken indicating that higher value of the index indicates increase in delivery time and vice-versa. 10 The urban index consists of 10 indicators – CMIE urban employment rate, domestic air passenger traffic, domestic passenger vehicle and scooter sales, railway passenger bookings – suburban, petroleum consumption (motor spirit and LPG), NEFT, RTGS and mobile volume transactions. 11 The rural index consists of 7 indicators – domestic tractor sales, domestic motorcycle sales, CMIE rural employment rate, diesel consumption (high speed and low diesel oil), fertiliser production, and MGNREGA work demand persons. 12 ‘Central Banking in Uncertain Times: The Indian Experience’, Opening Plenary Address delivered by Shri Shaktikanta Das at the Summer Meetings organised by Central Banking, London, June 13, 2023. 13 ‘The Dawn of India’s Age, Inaugural address delivered by Dr. M.D. Patra at IGIDR Alumni Conference, Mumbai, May 10, 2023. |

Share this page:


Install the RBI mobile application and get quick access to the latest news!


